August 2004
•
NREL/CP-500-35966
Load Mitigation Control Design for a Wind Turbine Operating in the Path of Vortices
M.M. Hand National Renewable Energy Laboratory
M.J. Balas University of Colorado
Presented at the Science of Making Torque from Wind
2004 Special Topic Conference
Delft, The Netherlands
April 19–21, 2004
National Renewable Energy Laboratory 1617 Cole Boulevard, Golden, Colorado 80401-3393 303-275-3000 • www.nrel.gov Operated for the U.S. Department of Energy Office of Energy Efficiency and Renewable Energy by Midwest Research Institute • Battelle Contract No. DE-AC36-99-GO10337
NOTICE The submitted manuscript has been offered by an employee of the Midwest Research Institute (MRI), a contractor of the US Government under Contract No. DE-AC36-99GO10337. Accordingly, the US Government and MRI retain a nonexclusive royalty-free license to publish or reproduce the published form of this contribution, or allow others to do so, for US Government purposes. This report was prepared as an account of work sponsored by an agency of the United States government. Neither the United States government nor any agency thereof, nor any of their employees, makes any warranty, express or implied, or assumes any legal liability or responsibility for the accuracy, completeness, or usefulness of any information, apparatus, product, or process disclosed, or represents that its use would not infringe privately owned rights. Reference herein to any specific commercial product, process, or service by trade name, trademark, manufacturer, or otherwise does not necessarily constitute or imply its endorsement, recommendation, or favoring by the United States government or any agency thereof. The views and opinions of authors expressed herein do not necessarily state or reflect those of the United States government or any agency thereof. Available electronically at http://www.osti.gov/bridge Available for a processing fee to U.S. Department of Energy and its contractors, in paper, from: U.S. Department of Energy Office of Scientific and Technical Information P.O. Box 62 Oak Ridge, TN 37831-0062 phone: 865.576.8401 fax: 865.576.5728 email: mailto:
[email protected] Available for sale to the public, in paper, from: U.S. Department of Commerce National Technical Information Service 5285 Port Royal Road Springfield, VA 22161 phone: 800.553.6847 fax: 703.605.6900 email:
[email protected] online ordering: http://www.ntis.gov/ordering.htm
Printed on paper containing at least 50% wastepaper, including 20% postconsumer waste
Load Mitigation Control Design for a Wind Turbine
Operating in the Path of Vortices
M. Maureen Hand
National Wind Technology Center
National Renewable Energy Laboratory
(NREL)
1617 Cole Blvd., MS 3811
Golden, CO 80401-3393 USA
[email protected]
Mark J. Balas
Aerospace Sciences Center
University of Colorado
429 UCB
Boulder, CO 80309-0429 USA
[email protected]
flow field adversely affects wind turbine operation. We incorporated a simple, Rankine, vortex model into the aerodynamics code AeroDyn [5] to isolate the aerodynamic response of a wind turbine to a vortex in the inflow. AeroDyn provides aerodynamic loads to structural codes such as SymDyn [6, 7]. The vortex parameters were varied systematically, and the blade root flap bending moment that resulted from vortex passage was obtained. The study established the size, circulation strength, plane of rotation, and orientation of vortices that cause large cyclic blade loads that contribute to fatigue damage [4]. The ability to incorporate active control algorithms that counter the adverse effects of the vortex/wind turbine interaction will extend blade fatigue life and increase turbine reliability. We identified specific restrictions to determine whether advanced control can be applied successfully to the wind turbine/vortex interaction problem. The control design studies were performed on a threeblade, variable-speed wind turbine. This restricts the study to the vortex/wind turbine interaction because any commercial two-blade wind turbine would have a teetered rotor, which complicates the dynamic response. The control study was also restricted to Region 3 operation—the simplest regime in which to design control algorithms. This operating regime occurs at above-rated wind speeds, where the primary control objective is to regulate rotor speed to maintain rated power. Disturbance accommodating control (DAC) methods are suitable for wind turbine applications because the wind is a persistent disturbance to the system. This work explores the disturbance model part of a DAC controller with the intent of commanding full-span blade pitch to mitigate blade root flap bending moments induced by passage of a coherent vortex while maintaining constant speed regulation.
Abstract* Turbulence generated in the stable atmospheric boundary layer can contain vorticity that adversely affects wind turbine blade fatigue life. We investigated advanced control algorithms that mitigate the vortex/wind turbine interaction. State space control designs can meet multiple control objectives such as maintaining power regulation while mitigating blade flap bending moment amplitude. We implemented disturbance accommodating control (DAC) methods in a structural dynamics code to mitigate blade loads and maintain constant power production in above-rated wind speeds. As a best-case scenario, we implemented a disturbance model that incorporated very detailed vortex characteristics in full-state feedback. This reduced equivalent fatigue load as much as 30% compared to a standard proportional-integral (PI) controller. A realizable DAC controller that incorporates only the vertical shear component of the vortex reduced loads by 9% compared to a PI controller, and as much as 29% when the vortex was superimposed over normal turbulence. Keywords: wind turbines, state-space control, disturbance accommodating control
1 Introduction Wind turbines mounted on towers that approach 100 m in height operate in atmospheric boundary layers with different turbulence generation mechanisms than those that occur closer to the ground. Atmospheric phenomena in the stable boundary layer, such as low-level jets, gravity waves, and Kelvin-Helmholtz instabilities, can generate coherent turbulence. This turbulence may contribute to large blade load excursions that are not explained with current industry turbulence models [1, 2]. Attempts to correlate Reynolds stress fields with wind turbine blade loads [3, 4] imply that vorticity in the
2 Simulation Parameters We selected a “test vortex” based on the results of the vortex parameter variation study to test all control designs [4]. A vortex rotating in the XZ plane and
*
This work was performed at the National Renewable Energy Laboratory in support of the U.S. Department of Energy under Contract No. DE-AC36-99GO10337.
1
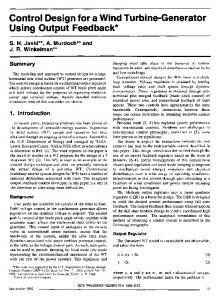
centered at the hub height produces the most significant flap bending moment amplitude variation (Figure 1). Because the vortex orientation caused little response difference, we restricted the control study to a counterclockwise vortex orientation. Vortex radius and circulation strength corresponded to significant— but not extreme—blade load response. The resulting vortex had a radius of 10.7 m, circulation strength of –577 m2/s, and convection speed of 18 m/s. Simulations represented 55 seconds, and the vortex center passed through the rotor at 45 seconds. The first 20 seconds of simulation were neglected to exclude start-up transients. The SymDyn code [6, 7] was used exclusively for the control design.
R
z x
simulation models for step changes in wind speed. The wind turbine response to the test vortex under PI control is shown in Figure 2. Figure 3 is a schematic of the wind turbine simulation with the PI controller. The test vortex serves as the wind input. Servo-electric motors provide actuation for the blade pitch based on a commanded pitch angle. The blade flap angles indicate significant motion associated with vortex passage. The wind force that results in blade root flap bending moment also causes blade flap angle deflection. The PI controller commands collective pitch angles. This means that each blade is pitched the same amount and in the same direction as the vortex passes. Figure 2 presents the baseline response to which all DAC designs are compared.
3 Disturbance Accommodating Control Implementation
(xo, yo, zo)
3.1
u
w
General DAC Implementation
The first requirement for design of a DAC algorithm is a linear model of the plant, or in this case, the wind turbine. The highly nonlinear equations of motion are linearized by perturbing each state and each input about an operating point. In this study, the operating point was specified to be a uniform wind speed of 18 m/s; the u velocity component is 18 m/s, and the w velocity component is 0 m/s. The linear equations of motion are transformed into a first-order state-space form for control design. The linear parameters (A, B, BD) are periodic; the period is equal to the time required for one rotor revolution. These parameters are computed for several azimuth angle positions and then averaged over the equivalent of one rotor revolution. This method was developed by Stol [7]. For this study, the linear plant model outputs are state measurements such as the rotor speed and the blade flap angles. This linear model is implemented in the Simulink® environment for state-space-based control design; now x , u , and u D are functions of time. The state vector is defined as:
Wind
FIGURE 1. VORTEX ROTATING COUNTERCLOCKWISE IN THE XZ PLANE AND CENTERED AT HUB HEIGHT The wind turbine simulation represented a typical 750-kW, 46-m diameter, variable-speed, three-blade turbine based on an early iteration of the WindPACT rotor design study [8]. A baseline controller designed with commonly accepted tools was required for comparison to advanced control designs. The industry standard wind turbine controller uses proportionalintegral-derivative (PID) algorithms. In above-rated wind speeds, the control objective is to maintain constant power by regulating rotor speed. The generator torque is held constant. The rotor speed is permitted to deviate slightly from the rated speed of 26.64 rpm. For this three-blade turbine, a range of ±3% was sufficient. The baseline controller is a proportional-integral (PI) controller based on a design for NREL’s Controls Advanced Research Turbine (CART) [9], a two-blade, 600-kW wind turbine located at NREL’s National Wind Technology Center near Boulder, Colorado. We input a series of step changes in wind speed to the three-blade turbine simulation, and recorded the rotor speed and pitch actuation. Beginning with the gains for the CART, we adjusted these gains to achieve similar speed regulation and actuator demand between the two
ψ 1 β
1 β2 β x = 3 ψ& 1 & β1 β&2
& β3
2
Rotor azimuth position
Blade 1 flap angle
Blade 2 flap angle Blade 3 flap angle Rotor speed Blade 1 flap rate Blade 2 flap rate
Blade 3 flap rate
The linear model includes 4 degrees of freedom: rotor rotation, and blade flap for each of three blades. Because the drive-train torsion degree of freedom is not modeled, the generator speed is proportional to the rotor speed by the gear ratio of the gearbox. Thus, rotor speed and generator speed are used interchangeably in this text. The linear plant model is presented in Equations (1) and (2), where control inputs, u , are dimension M = 3 (three pitchable blades); plant outputs, y , are dimension P = 4 (generator speed and 3 blade flap angles); and states, x , are dimension N = 8.
2
Blade flap angle (deg)
1.5
Blad e 1 Blad e 2 Blad e 3
1 0.5 0
- 0.5 -1 35
x& (t) = Ax(t) + Bu (t) + BD u D (t) 40
45 Time (s)
50
y(t) = Cx(t) ; x(0) = x0 (2) The number of disturbance inputs, u D , is 5 or 60,
55
24
depending on the disturbance generator model chosen. Figure 4 shows a schematic of a general DAC design built around a linear plant model.
Blade pitch angle (deg)
22
Disturbance Waveform Generator The wind is modeled as a persistent disturbance of known waveform but unknown amplitude [10, 11]. The disturbance inputs, u D , have dimension MD, and
20 18
the disturbance states, z D , have dimension ND.
16
u D (t ) = Θz D (t )
14 12 35
(1)
(3)
0 z& D (t ) = Fz D (t ) ; z D (0) = z D
40
45 Time (s)
50
(4)
The matrices F and Θ are selected to represent the waveform approximation of the disturbance that
55
0
enters the linear system. The initial condition, z D , is not known. For instance, a step disturbance, which is an adequate approximation of uniform wind speed for wind turbine controllers [7, 9, 11], is modeled with F = 0 and Θ = 1.
2 7.2
Rotor speed (rpm)
2 7.0
Composite (Plant/Disturbance) State Estimator Because the wind disturbance inputs cannot be directly measured, the disturbance states are estimated from the plant outputs by augmenting the usual plant state estimator with a disturbance estimator that uses feedback correction from the plant output error. The estimator error, defined as the difference between the state and the state estimate, is minimized by the selection of gains. If the augmented state matrix and the augmented output matrix are observable, the gains, KX and KD, can be chosen through arbitrary pole placement to ensure exponential decay of the error between the states and the state estimates, as well as the error between the disturbance and the disturbance estimate.
2 6.8
2 6.6
2 6.4
2 6.2 35
40
45 Time (s)
50
55
FIGURE 2. WIND TURBINE RESPONSE TO TEST VORTEX WITH PI CONTROLLER
3
wdata Wind input
Wind output
q
q_out
Generator torque
DOF angles
qdot
Generator torque controller
Actual pitch angles
Commanded pitch angles
loads
Slow actuator dynamics, three blades
PI controller
qdot_out DOF velocities loads_out Internal Loads
Nonlinear SymDyn model
Generator speed (in rotor speed frame)
U(E) U
Extract generator speed
FIGURE 3. SCHEMATIC OF WIND TURBINE SIMULATION WITH PI CONTROLLER IN SIMULINK ENVIRONMENT. IN ABOVE-RATED WIND SPEEDS, THE GENERATOR TORQUE CONTROLLER COMMANDS CONSTANT TORQUE. Disturbance Generator
uD = Θz D z&D = FzˆD z D ( 0) = z D
uD 0
+
u
Plant x& = Ax + Bu + BD uD y = Cx x (0) = xo
Plant State Estimator
GX xˆ
GD zˆ D
y
uˆD = ΘzˆD z&ˆD = FzˆD + K D ( y − yˆ ) zˆD (0) = 0
y − yˆ
xˆ& = Axˆ + Bu + BD uˆ D + K X ( y − yˆ ) yˆ = Cxˆ xˆ (0) = 0
uˆ D
Disturbance Estimator
Θ
FIGURE 4. SCHEMATIC OF GENERAL DAC DESIGN
elem_data Blade element velocity components
Wind output
phi_op Operating pitch angle
q
q_out DOF angles
Disturbance feedback gain
K*u
qdot
Qe Generator torque
loads
K*u State feedback gain
qdot_out DOF velocities
Nonlinear SymDyn model
Fast actuator dynamics, three blades
loads_out Internal loads
q
States, x
qdot
Subtract operating point
FIGURE 5. SCHEMATIC OF FSFB CONTROLLER USING 10-ELEMENT DISTURBANCE MODEL IN SIMULINK ENVIRONMENT
4
In summary, the linear plant model is used to create a plant state estimator. A disturbance generator model that defines F and Θ is developed to simulate the waveform of the wind input to the wind turbine. This disturbance generator is used to create a disturbance state estimator, which is appended to the plant state estimator. If the augmented state and output matrices are observable, the gains, KX and KD, are selected to dissipate the error between the state and the state estimate. If the linear plant model is controllable, the gain, GX, is selected to provide desired transient behavior of the plant states. The realizable control law results in desirable transient stability of the closed loop system. The disturbance gain, GD, is selected to minimize the effect the disturbance introduces to the system. The disturbance is thus “accommodated” through the control design.
3.2
Ten-Blade Element Disturbance Model The wind turbine simulation code uses blade element momentum theory to compute the aerodynamic loads that the wind imparts to the blade. This assumes each blade can be subdivided into elements along the span. We computed the aerodynamic load for each element with the velocity components computed at the blade element. We used 10 blade elements along the span of each blade to capture the details of the vortex as a disturbance model for control design. The disturbance model assumed a u and w velocity component step change at each of these 10 elements for each of the three blades, for a disturbance model that consisted of 60 inputs. For the step change disturbance, F = 0 and Θ = 1. For the 60 inputs, these matrices are 60 rows by 60 columns, where F is populated with zeros and Θ is the identity matrix of dimension 60. We perturbed each of the 60 disturbance inputs independently to create the wind input matrix, BD. The operating point was defined to be a uniform wind of 18 m/s. In other words, the u velocity component was perturbed to 18.1 m/s and to 17.9 m/s at each blade element for each blade. The w velocity component was perturbed to 0.1 m/s and to –0.1 m/s at each blade element for each blade. The average of the two perturbations results in the value inserted in the BD matrix. The GD matrix was obtained with the MoorePenrose pseudoinverse [12]. We used LQR to determine the state gain, GX. Initially, we input step changes in wind speed to the simulation and adjusted the weightings on the diagonal entries in Q associated with the rotor states until the speed regulation and pitch actuation were similar to those of the PI controller. Next, we adjusted the blade state gains by adding weight in the Q matrix to reduce the blade cyclic loading and fatigue equivalent load that resulted from the step change wind input. Table 1 compares the open and closed loop poles. The first two entries are associated with the rotor state; the last six with the blade states. The addition of damping through feedback reduces the flap deflection.
Performance Assessment Criteria The state and estimator gains are selected using a linear quadratic regulator (LQR) as implemented in MATLAB™ [12]. This formulation seeks a solution to the algebraic Riccati equation [12] to minimize a cost function. ∞
J = ∫ ( x T Qx + u T Ru )dt 0
DAC Designs
(5)
The cost function, J, has no physical significance, but it permits a solution that balances state regulation with input amplitude. For instance, a wind turbine control system balances rotor speed regulation with pitch actuator demand. Using an LQR to design state feedback and estimator feedback gains is especially useful when multiple states are modeled. Blade root flap bending moments are the most commonly used measure of blade loads associated with the force imparted by the wind (blade root edge bending moments are governed by the inertial and gravitational load fluctuations). We used the damage equivalent fatigue load [4] to compare wind turbine simulation response with different control algorithms. Because the damage equivalent load is dominated by the largest cyclic amplitude, we also examined the range of flap bending moment over the simulation. The metrics used to evaluate control designs included actuator demand, speed regulation, and load mitigation. The blade pitch actuator peak rate and peak acceleration were limited to 18°/s and 150°/s2, respectively. The root-mean-square (RMS) of rotor speed error was minimized, and the peak rotor speed was restricted to 3% of the rated speed. The blade root flap bending moment range and damage equivalent fatigue load were minimized. The tables comparing performance of controllers (2-4) include the maximum equivalent fatigue load of the three blades and the bending moment range for each of the three blades.
TABLE 1. POLES FOR OPEN LOOP SYSTEM AND CLOSED LOOP SYSTEM
5
Open Loop Poles
Closed Loop Poles
0 –0.21 –3.58 + 19.03i –3.58 – 19.03i –3.66 + 18.84i --3.66 – 18.84i –3.66+ 18.84i –3.66 – 18.84i
–1.02 + 0.21i –1.02 – 0.21i –7.03 + 1.33i –7.03 – 1.33i –7.11 + 1.08i –7.11 – 1.08i –7.11 + 1.08i –7.11 – 1.08i
The next step was to design a state estimator for the system by augmenting the turbine states with the disturbance states. The observability condition on the composite state/disturbance estimator is not met with this 60-input disturbance model. However, creating a full-state feedback (FSFB) controller with this disturbance model yields the best-case scenario. This assumes that each state in the turbine and disturbance models is a known quantity. We used the test vortex as wind input and output the u and w time-varying velocity components associated with each blade element from the simulation as a text file. This file was then read into the controller simulation to result in known disturbance input. Figure 5 is a diagram of this FSFB control system. Table 2 compares the simulated turbine response to the test vortex with FSFB of the 10-element disturbance model and the response with the PI controller. The blade fatigue equivalent load might be reduced as much as 30% if the disturbance model incorporates enough detail of the vortex in the inflow. Each blade’s cyclic amplitude may also be reduced more than 30%. The FSFB controller exceeds the pitch actuator rate and acceleration limits. FSFB causes the pitch input to constantly adjust because new disturbance information is presented. There is no settling time as there is with limited or no input.
2
Blade flap angle (deg)
1.5
807.2
1092%
8.02
40.63
407%
369 422 551 381
258 288 386 249
-30% -32% -30% -35%
0
40
45 Time (s )
50
55
40
45 Time (s )
50
55
50
55
24
Blade pitch angle (deg)
22 20 18 16 14
12 35
Test Vortex FSFB Difference 0.05 -6% 1.4 -17% 31.5 219% 2.81 174%
67.7
0.5
-1 35
2 7.2
2 7.0
Rotor speed (rpm)
RMS speed error (rpm) Max speed error (% rated) Max pitch rate (deg/s) RMS pitch rate (deg/s) Max pitch acceleration (deg/s^2) RMS pitch acceleration (deg/s^2) Flap damage equivalent load (kNm) Blade 1 RFB range (kNm) Blade 2 RFB range (kNm) Blade 3 RFB range (kNm)
1
-0.5
TABLE 2. COMPARISON OF PI CONTROLLER AND FSFB OF 10-ELEMENT DISTURBANCE MODEL CONTROLLER PERFORMANCE FOR TEST VORTEX (RFB = root flap bending moment) PI 0.05 1.6 9.9 1.03
Blad e 1 Blad e 2 Blad e 3
Figure 6 shows the wind turbine time-series response to the test vortex. The flap angle deflection is reduced compared to that corresponding to the PI controller in Figure 2. This contributes to blade flap damage equivalent load reduction. Also, the blade pitch angles are commanded independently in response to the velocity conditions associated with the vortex at each blade position.
2 6.8
2 6.6
2 6.4
2 6.2 35
40
45 Time (s)
FIGURE 6. WIND TURBINE RESPONSE TO TEST VORTEX WITH FSFB OF 10-ELEMENT DISTURBANCE MODEL CONTROLLER
6
DAC with Hub-Height Wind Speed and Sinusoidal Vertical Shear Disturbance Model (DAC HH+VSHR) Wind turbines that operate in the atmospheric boundary layer are generally subjected to a vertical shear profile. Wright [9] proposed a DAC controller design to mitigate blade loads that result from homogenous turbulence in vertical shear for a two-
blade wind turbine. This disturbance model incorporates a step change in uniform wind along with a sinusoidal variation that represents the vertical shear profile. As the vortex passes through the rotor, a vertical shear is induced by the u velocity components at the top and bottom of the rotor. The vortex also induces a w velocity component that is not associated with vertical shear. Figure 7 shows the time-series traces of both the u and w velocity components at the tip of each blade that result from passage of the test vortex. Figure 7 also shows the corresponding total velocity (vector sum of u and w components). The vertical velocity component contributes very little to the total velocity at the tip of each blade. A sinusoidal variation of the velocity appears to be an adequate approximation of the tip velocity that results from
vortex passage. Thus, Wright’s [9] disturbance model, adapted to a three-blade wind turbine, was applied to
the vortex problem.
Vertical shear as a function of height above ground is frequently described with Equation (6). An exponent of 1/7 corresponds to average vertical shear profiles. This term is expanded in a binomial series; the higher order terms are neglected; and the substitution, zg = r cos Ψ1, is made. The amplitude of the sinusoid, AD, is assumed to be unknown.
0 z& D1 0 z& 0 0 D2 z& D 3 = 0 − Ω 2 & 0 z D 4 0 0 z& D5 0
0
0
1
0
0
0
0 0 0 − Ω2
0 z D1 0 z D 2 0z D3 (7)
1 z D 4
z D5
0
w velocity component (m/s)
u velocity component (m/s)
30
25
Blade 1 Blade 2 Blade 3
20 15 10 5 35
40
45 Time (s )
50
55
40
45
50
55
50
55
10
5
0 -5 -10 35
Time (s)
m
zg W (z g ) = W * 1 + ≈ W (1 + AD cos Ψ1 ) (6) h
30
Total velocity (m/s)
In this disturbance model, the uniform wind is modeled as a step change. The vertical shear is modeled as a sinusoidal variation as a function of blade azimuth angle. The three blades are each 120º out of phase with each other. This phase difference is incorporated in the disturbance model by associating the wind perturbation on each blade with the azimuth angle of Blade 1. Three disturbance inputs that comprise five disturbance states are created from the combination of uniform step and sinusoidal variations. The complete disturbance model that incorporates all three disturbance inputs is:
25 20 15 10 5 35
40
45 Time (s)
FIGURE 7. BLADE TIP VELOCITY COMPONENTS ASSOCIATED WITH TEST VORTEX
z D1
uD1 1 0 0 0 0 zD 2 u = 0 1 0 0 0 z
D3 D2 uD3 0 0 0 1 0 zD 4 z D5
The wind input matrix, BD, is constructed to incorporate the wind speed perturbations on each
blade. The terms associated with a perturbation in
uniform wind speed provide one column. The other
two columns represent modifications of the terms
7
associated with a uniform wind speed perturbation that use the constants (1/2 and 0.866) that prescribe the 120º phase shift for the sinusoidally varying disturbance states. The wind disturbance gain, GD, was determined with the Moore-Penrose pseudoinverse. We determined the state gains, GX, with LQR. The rotor state weights used with the FSFB controller achieved speed regulation performance similar to that of the PI controller. Only rotor states were weighted because the disturbance to be accommodated affects the blade flap angle states. A state estimator was constructed. Because the augmented state and output matrices are observable when measuring the three blade flap angles and the rotor speed, we selected the estimator gains, KX and KD, with LQR. We compared a simulation of the wind turbine response to passage of the test vortex with this DAC controller (DAC HH+VSHR) to the response using the PI controller. Table 3 includes this comparison along with a comparison for the example of full-field turbulence (generated using SNWind [13]) and the example of the test vortex superimposed on the fullfield turbulence [4]. The time-series response of the turbine to the vortex is presented in Figure 8. Compared to the PI controller, the DAC design that includes uniform wind and vertical shear variation mitigates the blade flap equivalent load by 9%. This margin is increased to 21% when turbulence is added. Figure 8 illustrates the independent blade pitch angle commanded by the controller. The pitch angle commands are 120º out of phase, as desired. Comparison with Figure 2 illustrates the flap angle reduction that causes the blade damage equivalent load reduction. The pitch rate limitation of 18°/s is exceeded in the examples including the vortex. Actual implementation of the controller would not permit this rate, which may result in slightly reduced blade response. The blade flap states and state estimates are shown in Figure 9. The estimates follow the trend of the state, as desired. Figure 10 illustrates the estimated uniform wind speed, which remains at 18 m/s. The estimated rotor speed and the actual rotor speed, also shown in Figure 10, are very similar. This is expected because the rotor speed is a measurement input to the controller. Figure 11 shows the estimated sinusoidal variation in wind speed associated with the vertical shear profile. The wind speed associated with each blade tip is shown for comparison. The test vortex convects with a uniform wind (i.e., there is no vertical shear other than that induced by the vortex). However, the disturbance estimates predict fluctuations that follow the trend of the velocity fluctuations associated with the vortex. Vertical shear is an adequate approximation of vortex passage, but it does not include the details of the vortex.
2
Blade flap angle (deg)
1.5
Blad e 1 Blad e 2 Blad e 3
1 0.5 0 - 0.5
-1 35
40
45 Time (s)
50
55
45 Time (s)
50
55
50
55
24
Blade pitch angle (deg)
22
Blad e 1 Blad e 2 Blad e 3
20 18 16 14 12 35
40
2 7.2
Rotor speed (r pm)
2 7.0
2 6.8
2 6.6
2 6.4
2 6.2 35
40
45 Time (s )
FIGURE 8. WIND TURBINE RESPONSE TO TEST VORTEX WITH DAC HH+VSHR CONTROLLER
8
TABLE 3. COMPARISON OF PI CONTROLLER AND DAC HH+VSHR CONTROLLER
PERFORMANCE FOR TEST VORTEX, FULL-FIELD TURBULENCE, AND VORTEX
SUPERIMPOSED ON TURBULENCE
PI 0.05 1.6 9.9 1.03
RMS speed error (rpm) Max speed error (% rated) Max pitch rate (deg/s) RMS pitch rate (deg/s) Max pitch acceleration (deg/s^2) RMS pitch acceleration (deg/s^2) Flap damage equivalent load (kNm) Blade 1 RFB range (kNm) Blade 2 RFB range (kNm) Blade 3 RFB range (kNm)
Test Vortex DAC HH+VSHR Difference 0.08 68% 1.9 14% 23.5 138% 2.94 186%
67.7
136.4
8.02
14.74
369 422 551 381
336 345 501 334
Full-Field Turbulence DAC PI HH+VSHR Difference 0.32 0.29 -11% 2.4 2.6 5% 7.4 13.9 87% 2.73 5.19 90%
Turbulence + Vortex DAC PI HH+VSHR Difference 0.33 0.29 -12% 2.4 2.5 4% 9.8 25.8 164% 2.93 6.55 124%
33.4
67.7
49.5
111.4
125%
84% 10.76
20.85
94% 12.31
25.03
103%
295 430 440 376
-21% -16% -21% -28%
101%
-9% -18% -9% -13%
268 317 310 396
0.5
0
-0.5 -1 35
40
45 T ime (s)
50
Blade 2 flap rate (deg/s)
Blade 2 flap angle (deg)
0 -0.5
40
45 T ime (s)
50
0
-10
40
45 T ime (s)
50
55
40
45 T ime (s)
50
55
40
45 T ime (s)
50
55
10 0 -10 -20 35
55
20 Blade 3 flap rate (deg/s)
1 Blade 3 flap angle (deg)
372 510 555 521
20
0.5
0.5 0 -0.5 -1 35
-22% -14% -16% -22%
10
-20 35
55
1
-1 35
210 272 260 309
20
Stat e Estimat e
Blade 1 flap rate (deg/s)
Blade 1 flap angle (deg)
1
103%
40
45 T ime (s)
50
10 0 -10 -20 35
55
FIGURE 9. BLADE STATES AND STATE ESTIMATES FOR DAC HH+VSHR CONTROLLER
9
mitigates blade loads compared to the PI controller for all conditions. The margin decreases as the vortex radius decreases, and it remains relatively constant as circulation increases. The maximum pitch rate exceeds the prescribed limit in most cases, and the maximum pitch acceleration is exceeded in two cases. When the vortex center height is increased from the hub height to the top of the rotor, the load variation that results from the vortex decreases substantially. The DAC controller mitigates the blade loads compared to the PI controller for each selected height. The margin decreases as the vortex center is raised, but the load magnitude decreases in general.
Wind speed estimate (m/s)
30 25
20
15
10
5
35
40
45
50
55
Time (s )
30
2 7.2
Rotor speed (rpm)
2 7.0
Wind speed (m/s)
S tate Estimate
2 6.8 2 6.6
2 6.2
35
25
20
15
10
5
35
2 6.4
40
45
50
30
55
Wind speed (m/s)
Time (s )
FIGURE 10. WIND SPEED ESTIMATE, ROTOR SPEED, AND ROTOR SPEED ESTIMATE FOR DAC HH+VSHR CONTROLLER Robustness of DAC HH+VSHR Controller We created two additional full field turbulence files to determine the range of conditions under which the DAC design outperforms the PI controller, and we superimposed the same test vortex on each. The comparison is presented in Table 4. In the three randomly generated full-field turbulence files, the DAC controller mitigated the blade flap equivalent load by 12% to 29%. This wide range in mitigation levels may be further explored by generating numerous turbulence cases with randomly generated seeds. However, the result indicates that this application of the DAC controller mitigates the blade loads induced by vortex passage and the effects of turbulence to some degree. We then adjusted the vortex parameters to determine the robustness of the DAC controller’s response to parameter variation. We input five vortex configurations, all with a mean convection speed of 18 m/s, to the simulation. Again, the DAC controller
40
45 Time (s)
50
55
50
55
50
55
Estimate Velocity at Blade 2
25
20
15
10
5
35 30
Wind speed (m/s)
Estimate Velocity at Blade 1
40
45 Time (s)
Estimate Velocity at Blade 3
25
20
15
10
5
35
40
45 Time (s)
FIGURE 11. SINUSOIDAL DISTURBANCE ESTIMATES FOR DAC HH+VSHR CONTROLLER
10
TABLE 4. ADDITIONAL COMPARISONS OF PI CONTROLLER AND DAC HH+VSHR CONTROLLER
PERFORMANCE FOR VORTEX SUPERIMPOSED ON FULL-FIELD TURBULENCE
RMS speed error (rpm) Max speed error (% rated) Max pitch rate (deg/s) RMS pitch rate (deg/s) Max pitch acceleration (deg/s^2) RMS pitch acceleration (deg/s^2) Flap damage equivalent load (kNm) Blade 1 RFB range (kNm) Blade 2 RFB range (kNm) Blade 3 RFB range (kNm)
Turbulence + vortex (2) DAC PI HH+VSHR Difference
Turbulence + vortex (3) DAC PI HH+VSHR Difference
0.34 2.5 8.4 3.11
0.34 2.4 19.3 6.87
-2% -5% 130% 121%
0.34 2.1 11.3 2.93
0.27 1.9 24.3 6.89
-20% -11% 116% 135%
50.6
109.8
117%
68.4
164.2
140%
11.74
25.35
116% 13.79
27.40
99%
362 539 487 476
257 378 383 367
388 474 579 524
-12% -28% -11% -20%
-29% -30% -21% -23%
443 661 650 653
that incorporated a uniform wind disturbance and two sinusoidal disturbances that approximated the azimuthally varying effect of vertical shear provided 9% damage equivalent load reduction when the vortex was input to the simulation. This DAC design reduced the damage equivalent load even more over the PI controller when the vortex was superimposed on turbulent wind. The controller appears robust when the vortex radius and circulation strength are varied because the DAC produces lower blade damage equivalent loads than the PI controller. As the vortex is raised from hub height to the top of the rotor, the magnitude of the blade loads is reduced, as is the margin of load reduction achieved by the DAC over the PI controller. The blade load conditions that lead to increased fatigue damage caused by vortex passage are mitigated by implementing a DAC controller. The disturbance is modeled as a uniform wind and an azimuthally varying vertical shear. Implementing FSFB of a disturbance model that incorporates velocity changes at multiple points along the blade span indicates that even greater blade load mitigation is possible.
3.3 Additional Considerations before Field Implementation Because the speed regulation is quite similar between the PI and the DAC controllers, power production should be essentially equivalent. However, several issues must be addressed before the DAC controller is implemented in the field. For instance, the actuator’s physical limitations, i.e., pitch rate and acceleration restrictions, may reduce the margin of improvement somewhat. Modes that were not modeled in the control design, such as drive-train torsion and tower fore-aft bending, will almost certainly become unstable when included. However, Wright [9] demonstrated that these modes could be stabilized with state-space-based control design methods.
4 Conclusions A baseline PI controller was designed for a threeblade turbine model to perform similarly to the PI controller implemented in the two-blade CART field experiment. All subsequent DAC designs were compared to this baseline controller. Multiple performance metrics were used to evaluate controller performance. The peak rotor speed, RMS of rotor speed error, pitch actuation rate and acceleration, blade root flap bending moment range, and damage equivalent load were all assessed as important criteria for controller performance. Several DAC designs were presented. Initially a disturbance model that included both u and w velocity components for 10 elements on each blade, which resulted in 60 disturbance inputs, was created. An estimator could not be designed because the augmented system was not observable. However, implementation of this design as an FSFB controller indicated that blade load range and damage equivalent load could be reduced as much as 30%. This was accomplished by commanding independent blade pitch angles in relation to the vortex velocity field. A DAC design
Nomenclature h m r
wind turbine hub height, m vertical wind shear exponent radial distance from vortex center to (x, y, z) position, m t time, s u control input (vector of perturbed blade pitch angles), rad uD wind/disturbance input u,v,w wind velocity components corresponding to x, y, z coordinates, respectively, m/s x , x(t) state vector
x0
11
initial state vector
x,y,z
blade element coordinates in aerodynamic code coordinate system, m x0, y0, z0 position of vortex center in aerodynamic code coordinate system, m y , y(t) output vector
published as NREL Report No. CP-500-30917, Golden, CO: NREL. [3]. Kelley, N.D.; Bialasiewicz, J.T.; Osgood, R.M.; Jakubowski, A. “Using Wavelet Analysis to Assess Turbulence/Rotor Interactions.” Wind Energy (3:4), 2000; pp.121–134.
z D , z D (t) disturbance state vector
zD zg A AD B BD C F GX GD J KX KD M N ND P Q R W βj Θ ψj Ω
x& xˆ
0
initial disturbance vector height above ground level, m
time-averaged state matrix, N × N
amplitude of disturbance generator sinusoid, m/s time-averaged control input matrix, N × M time-averaged disturbance input matrix, N × ND output matrix, dim N × P disturbance state matrix, NDS × NDS state gain disturbance gain linear quadratic regulator cost function state estimator gain disturbance estimator gain number of control inputs number of states number of disturbance inputs number of plant (turbine) outputs linear quadratic regulator state weighting matrix radius of vortex, m, or linear quadratic regulator input weighting matrix wind speed, m/s blade flap angle, rad disturbance input matrix, ND × NDS blade azimuth angle (Blade 1 at 0° in the 12 o’clock position), rad rotor angular speed, rad/s first derivative of x with respect to time estimated value of x blade number (1, 2, or 3)
[4]. Hand, M.M. Mitigation of Wind Turbine/Vortex Interaction Using Disturbance Accommodating Control. Ph.D. thesis. Boulder, CO: University of Colorado, 2003. Also published as NREL Report No. TP-500-35172, Golden, CO: NREL. [5]. Laino, D.J.; Hansen, A.C. (Last modified August 8, 2001). “User’s Guide to the Wind Turbine Aerodynamics Computer Software AeroDyn v.12.50.” http://wind.nrel.gov/designcodes/Aero Dyn/AeroDyn.pdf. Accessed September 24, 2003. [6]. Stol, K.; Bir, G. (Last modified July 15, 2003). “User’s Guide for SymDyn Version 1.2.” http://wind/designcodes/symdyn/symdyn.pdf. Accessed October 2, 2003. [7]. Stol, K. Dynamics Modeling and Periodic Control of Horizontal-Axis Wind Turbines. Ph.D. thesis. Boulder, CO: University of Colorado, 2001. [8]. Malcolm, D.J.; Hansen, A.C. WindPACT Turbine Rotor Design Study: June 2000–June 2002. NREL/SR-500-32495. Golden, CO: NREL, 2002; 82 pp. [9]. Wright, A. Modern Control Design for Flexible Wind Turbines. Ph.D. thesis. Boulder, CO: University of Colorado, 2003.
References
[10]. Johnson, C.D. “Theory of Disturbance Accommodating Controllers.” Leondes, C.T., ed. Control and Dynamic Systems: Advances in Theory and Applications, Vol. 12. New York: Academic Press, 1976; pp. 387–489.
[1]. Kelley, N.D. Full Vector (3-D) Inflow Simulation in Natural and Wind Farm Environments Using an Expanded Version of the SNLWIND (VEERS) Turbulence Code. NREL/TP-442-5225. Prepared for the 12th ASME Wind Energy Symposium, January 1993. Golden, CO: NREL, 1992; 8 pp.
[11]. Balas, M.J.; Lee, Y.J.; Kendall, L. “Disturbance Tracking Control Theory with Application to Horizontal Axis Wind Turbines.” Collection of the 1998 ASME Wind Energy Symposium Technical Papers, New York: American Society of Mechanical Engineers (ASME), 1998; pp. 95–99.
[2]. Kelley, N.; Hand, M.; Larwood, S.; McKenna, E. “The NREL Large-Scale Turbine Inflow and Response Experiment—Preliminary Results.” Collection of the 2002 ASME Wind Energy Symposium Technical Papers Presented at the 40th AIAA Aerospace Sciences Meeting and Exhibit, 14–17 January, Reno, Nevada. New York: ASME, 2002; pp. 412–426. Also
[12]. The Mathworks, Inc. MATLAB: The Language of Technical Computing User’s Manual, Version 6.5. Natick, MA: The Mathworks, Inc., 2002.
j
[13]. Buhl, M.L. (Last modified June 4, 2003). “SNWIND User’s Guide.” http://wind.nrel.gov/ designcodes/snwind/snwind.pdf. Accessed October 21, 2003.
12
Form Approved OMB No. 0704-0188
REPORT DOCUMENTATION PAGE
The public reporting burden for this collection of information is estimated to average 1 hour per response, including the time for reviewing instructions, searching existing data sources, gathering and maintaining the data needed, and completing and reviewing the collection of information. Send comments regarding this burden estimate or any other aspect of this collection of information, including suggestions for reducing the burden, to Department of Defense, Executive Services and Communications Directorate (0704-0188). Respondents should be aware that notwithstanding any other provision of law, no person shall be subject to any penalty for failing to comply with a collection of information if it does not display a currently valid OMB control number.
PLEASE DO NOT RETURN YOUR FORM TO THE ABOVE ORGANIZATION. 1. REPORT DATE (DD-MM-YYYY) 2. REPORT TYPE
August 2004 4.
3.
Conference Paper
TITLE AND SUBTITLE
DATES COVERED (From - To)
April 19 - 21,2004 5a. CONTRACT NUMBER
Load Mitigation Control Design for a Wind Turbine Operating in the Path of Vortices
DE-AC36-99-GO10337 5b. GRANT NUMBER
5c. PROGRAM ELEMENT NUMBER
6.
AUTHOR(S)
5d. PROJECT NUMBER
M.M. Hand and M.J. Balas
NREL/CP-500-35966 5e. TASK NUMBER
WER43105 5f. WORK UNIT NUMBER
7.
PERFORMING ORGANIZATION NAME(S) AND ADDRESS(ES)
National Renewable Energy Laboratory 1617 Cole Blvd. Golden, CO 80401-3393 9.
8.
PERFORMING ORGANIZATION REPORT NUMBER
NREL/CP-500-35966
SPONSORING/MONITORING AGENCY NAME(S) AND ADDRESS(ES)
10. SPONSOR/MONITOR'S ACRONYM(S)
NREL 11. SPONSORING/MONITORING AGENCY REPORT NUMBER 12. DISTRIBUTION AVAILABILITY STATEMENT
National Technical Information Service U.S. Department of Commerce 5285 Port Royal Road Springfield, VA 22161 13. SUPPLEMENTARY NOTES 14. ABSTRACT (Maximum 200 Words)
Turbulence generated in the stable atmospheric boundary layer can contain vorticity that adversely affects wind turbine blade fatigue life. We investigated advanced control algorithms that mitigate the vortex/wind turbine interaction. State space control designs can meet multiple control objectives such as maintaining power regulation while mitigating blade flap bending moment amplitude. We implemented disturbance accommodating control (DAC) methods in a structural dynamics code to mitigate blade loads and maintain constant power production in aboverated wind speeds. As a best-case scenario, we implemented a disturbance model that incorporated very detailed vortex characteristics in full-state feedback. This reduced equivalent fatigue load as much as 30% compared to a standard proportional-integral (PI) controller. A realizable DAC controller that incorporates only the vertical shear component of the vortex reduced loads by 9% compared to a PI controller, and as much as 29% when the vortex was superimposed over normal turbulence. 15. SUBJECT TERMS
wind energy, wind turbine, wind turbine control systems 16. SECURITY CLASSIFICATION OF: a. REPORT
b. ABSTRACT
Unclassified
Unclassified
c. THIS PAGE
Unclassified
17. LIMITATION 18. NUMBER OF ABSTRACT OF PAGES
UL
19a. NAME OF RESPONSIBLE PERSON
19b. TELEPONE NUMBER (Include area code) Standard Form 298 (Rev. 8/98) Prescribed by ANSI Std. Z39.18
F1147-E(05/2004)