Load Synchronization and Sustained Oscillations Induced by Transactive Control Md Salman Nazir
Ian A. Hiskens
arXiv:1702.04863v1 [cs.SY] 16 Feb 2017
Department of Electrical Engineering and Computer Science University of Michigan Email: mdsnazir,
[email protected]
Abstract—Transactive or market-based coordination strategies have recently been proposed for controlling the aggregate demand of a large number of electric loads. Such schemes offer operational benefits such as enforcing distribution feeder capacity limits and providing users with flexibility to consume energy based on the price they are willing to pay. However, this paper demonstrates that they are also prone to load synchronization and power oscillations. A transactive energy framework has been adopted and applied to a population of thermostatically controlled loads (TCLs). A modified TCL switching logic takes into account market coordination signals, alongside the natural hysteresis-based switching conditions. Studies of this marketbased coordination scheme suggest that several factors may contribute to load synchronism, including sharp changes in the market prices that are broadcast to loads, lack of diversity in user specified bid curves, low feeder limits that are encountered periodically, and the form of user bid curves. Case studies illustrate challenges associated with market-based coordination strategies and provide insights into modifications that address those issues. Index Terms—Load synchronization and oscillations; Thermostatically controlled loads; Transactive, market-based coordination.
I. I NTRODUCTION The modeling and control of electric loads and their applications to power systems services have been considered in various studies [1]. Due to the significant potential of thermostatically controlled loads (TCLs) (e.g. air-conditioners, space and water heaters), several control techniques have been explored in the literature, with applications ranging from fast regulation or load following [2]–[4], to optimizing the day-ahead generation schedules [5]. These strategies typically use either direct control via set-point variation [2], [6] or probabilistic switching-based distributed control [4]. Another stream of recent work employs market-based coordination strategies or a so-called transactive energy control framework to manage the aggregate demand of a large number of electric loads [7]–[13]. Risks related to load synchronization and cold load pick up are discussed in [14]–[16] in the context of direct load control, but there has been limited work to investigate such risks under market coordination strategies. Hence, the objective of this paper is to identify cases where oscillatory The authors gratefully acknowledge the contributions of the Natural Sciences and Engineering Research Council of Canada (NSERC) and the U.S. National Science Foundation through grant CNS-1238962.
behavior of either power consumption levels or clearing price may emerge when market-based coordination signals are used, and to investigate the factors that give rise to such behavior. Transactive control (TC) demonstration projects have shown that with residential loads market-based coordination strategies can reduce utility demand and congestion at peak times [7], [8], [10], [11]. An optimization problem has been formulated in [10] where the coordinator first makes control decisions to maximize the social welfare, and then the individual users choose energy consumption to maximize individual utility based on the coordinator’s control decisions. The companion paper [11] demonstrates the applicability of the proposed approach. However, the impact of control strategies on the temperature dynamics, as well as the possibility and causes of power oscillations, have not been analyzed in these studies. This paper investigates factors that could lead to oscillatory response. To achieve this objective, the transactive coordination mechanism [7], [10], [11] has been adopoted and applied to a population of TCLs. We present a modified TCL switching logic that takes into account market coordination signals, alongside the natural switching conditions. Simulations suggest that several factors could contribute to load synchronization and power oscillations, including sharp changes in market prices broadcast to loads, lack of diversity in user specified bid curves, feeder limits being set too low and being encountered periodically, and the form of user bid curves. The case studies illustrate challenges associated with market-based coordination and control strategies. The insights obtained through these investigations provide a basis for addressing these challenges through modifications to the control and market mechanisms. II. M ODELING TCL S IN A T RANSACTIVE C ONTROL F RAMEWORK A. TCL model preliminaries Consider a large population of TCLs. The set-point, deadband, internal and ambient temperatures (◦ C) corresponding to each load i are denoted by θis , δi , θi and θ a , respectively. Each load can be modeled as a thermal capacitance, Ci (kWh/◦ C), in series with a thermal resistance, Ri (◦ C/kW). Finally, the binary variable mi denotes whether the load is on or off, and Pi (kW) the energy transfer rate when a cooling (or heating)
TCL is switched ON. One can model the dynamics of TCLs using a set of independent first-order difference equations [17], g
θi,t+h = ai θi,t + (1 − ai )(θ a − mi,t θi ) + wi,t
(1)
−h/(Ci Ri )
where h is the time-step, ai = e is the parameter governing the thermal characteristics of the thermal mass, g θi = Pi Ri is the temperature gain when a cooling TCL is ON and w is a noise process. The variable mi,t for TCL i captures the TCL’s switching behavior according to, if θi < θimin 0, mi,t+h = 1, (2) if θi > θimax mi,t , otherwise where θimin = θis − δi /2 and θimax = θis + δi /2. With coefficient of performance (scaling factor related to efficiency [2]), ηi , the aggregate electrical power consumed by NTCL devices is given by, Ptelec =
NTCL
∑ mi,t Pi/ηi .
(3)
i=1
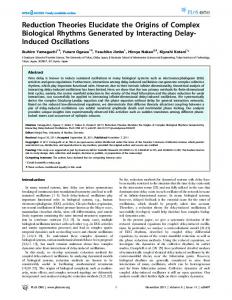
B. Transactive coordination framework The transactive control framework is based on a double auction mechanism [18]. Following the existing literature on the TC framework and modeling of the market clearing mechanism [10], [11], subsequent work is based on the following assumptions: (i) A ‘coordinator’ is present to receive the bidding information from a population of devices and to send back the market clearing information. (ii) Each device is equipped with a smart thermostat that can measure the room temperature. It also has communication capabilities to exchange bid information with the coordinator. (iii) Before each market period, the device measures its room temperature, and submits a bid to the coordinator. The bid should consist of the load power and the bidding price. (iv) The device has prediction capability to forecast its temperature 5 minutes ahead, which it then uses to establish its bidding price. Hence, the bidding price depends on the current temperature and the temperature 5 minutes ahead. In a TC framework, every load submits a demand bid where it specifies its desired amount of energy demand over a specific interval. Note that to be consistent with the literature, market clearing intervals with 5-minute duration have been considered. Hence, the bids are also based on average energy demand over 5-minute intervals. C. Modeling TCL bids Based on the above framework, let pbid i,t denote the price bid bid of load i at time t and qi,t be its corresponding amount of energy demand over the next 5-minute period. Fig. 1 shows how a TCL determines its bid [11], [18]. Here, an air-conditioner user bids p0i if its temperature θi,t is at its set-point, θis (i.e. desired temperature level), with the offer varying if the temperature deviates from θis . Above a certain cap threshold θimax the maximum bid is capped at pi . Similarly, below the threshold θimin the TCL might not be willing to bid,
Fig. 1. Demand side offer mapped to temperature.
so places pbid i = 0. Fig. 1 shows a piecewise linear mapping, with slopes γ1 and γ2 depending on if the temperature is above or below the set-point. Thus, the bid and temperature relation can be expressed as, (θi,t − θis )γ1 + p0i , if θi,t >= θis (θ s − θ )γ + p0 , if θ < θ s i,t 2 i,t i i i pbid (4) i,t = min 0, θ < θ i,t cap pi , θi,t > θ max . Since the bids are over 5-minute intervals, whereas TCLs have faster dynamics (few seconds), θi,t may be the latest measured temperature, or a predicted temperature (e.g. at 2.5 minutes ahead) based on its current on/off operating state, as detailed in [11]. Finally, qbid i,t will be the average power consumed if TCL i remains on during the 5-minute interval. D. Market clearing mechanism Since in a transactive framework the grid is organized in a hierarchical way, the TCL nodes are connected to a distribution feeder, which clears an allowable demand level at a particular price. Initially the feeder broadcasts a base price, but adjusts that price if the feeder capacity constraint is exceeded. Let πtbase be the base price forecast at time t and dtbase be the corresponding base aggregate demand. The clearing price πtclr and the cleared aggregate demand dtclr can be found at time t according to the following algorithm, keeping in mind that dtclr must satisfy the feeder capacity limit, dtclr ≤ d Feeder .
(5)
The overall transactive control mechanism, based on [10], [11], can be summarized as: 1) Gather anonymous bids (price versus demand) and build an aggregate demand function (see Fig. 2). 2) Using the aggregate demand function and the base price information for that time period πtbase , obtain the corresponding base aggregate demand dtbase . 3) If dtbase < d Feeder (see Fig. 2(a)), dtclr = d Feeder . Set πtclr = πtbase . 4) If dtbase ≥= d Feeder (see Fig. 2(b)), set dtclr = d Feeder . Set πtclr . 5) Each load compares its offer with πtclr and selfbid ≥ π clr . dispatches if πi,t t
Fig. 2. (a) Market clearing with feeder capacity not exceeded. (b) Market clearing with feeder capacity exceeded.
Note that the above market clearing mechanism ignores the network structure and the network flow constraints [10].
Fig. 3. (a) Temperature evolution of individual TCLs, (b) 5-minute average aggregate demand, (c) base price and clearing price.
E. Modified TCL switching logic Under the transactive framework, the switching variable mi,t in (1) will be multiplied by an additional decision variable vi,t , thus the overall expression becomes, g
θi,t+h = ai θi,t + (1 − ai )(θ a − mi,t vi,t θi ) where,
( 0, if vi,t = 1, if
bid < π clr πi,t t bid ≥ π clr . πi,t t
(6)
(7)
Here, vi,t can be thought of as an upper level decision variable, the TCL’s response to a transactive incentive signal or a clearing price πtclr . If at any time vi,t = 1 then the TCL simply follows its natural thermostat cycle. Note that under the above switching scheme, 1) A TCL consumes power when mi,t = 1, and vi,t = 1. 2) A TCL does not consume power when mi,t = 1, vi,t = 0. 3) A TCL does not consume power when mi,t = 0 (natural thermostat off mode). III. C ASE S TUDY Consider a population of 1000 TCLs. Parameter values are similar to those used in [2], [3]. A base price is sent at 5minute intervals. The coordinator sends the participants only the 5-minute ahead base price. Each load’s bid levels are constructed with continuous offers, similar to Fig. 1. Bid levels can range between 10 to 50 $/MWh. Each load has its own slopes γ1 and γ2 for its bid curve. Additionally, the feeder capacity constraint was set at 70% of the maximum power capacity of the TCLs (5600 kW for 1000 TCLs). Since the simulation of TCL temperature dynamics requires faster time steps, while market clearing occurs every 5 minutes, the TCL temperature dynamics were simulated using a time-step of h = 10 s, and the market mechanisms were simulated with 5-minute time-steps. A. Oscillations induced due to changes in base price Initial investigations considered the response of TCLs to sharp changes in the base price. The base price is initially 42 $/MWh and stays at that level for 6 hours before suddenly
dropping to 20 $/MWh for a further 6 hours, and then finally to 9 $/MWh for the remainder of the time. In reality, these price changes might correspond to sudden changes in background demand, such as an industrial load or electric vehicle charging. Fig. 3 provides a prototypical example of TCL synchronization. The TCLs started with diverse initial temperatures. But because the base price remained high (at 42 $/MWh) for a few hours, most of the TCLs did not initially consume power. (Their bids were not sufficiently high to be cleared.) However, within a few hours (around minute 200) their temperatures synchronized. Later, as the base price drops to 20 $/MWh, TCLs find the price level favorable and want to turn on. The aggregate demand reaches the feeder limit, causing the market clearing price to rise above the base price level. During minutes 480-720, the demand stays flat and TCL temperatures remain close to their set-point values. Next, at t=720 min, when the price drops to 9 $/MWh, the TCLs find this low price even more favorable and many compete to consume power. Large oscillations in aggregate power are observed and the feeder limit is hit periodically. Thus, a step change in base price, especially to a low value, can induce large power oscillations. This is mainly due to TCL temperatures becoming synchronized during preceding periods of relatively high base prices. Fig. 4 shows the evolution of bids for 20 TCLs (with 5 minute time-steps on the x-axis). Once synchronized, groups of similar bids are cleared and so those TCLs begin to cool. As they cool, their bids fall, allowing other groups with higher bids to be cleared. Besides heterogeneity in bid curves, customers may also have different set-points for their individual air-conditioners. While studies show that heterogeneity in the population leads to damping of oscillations under direct load control [16], Fig. 5 shows that step changes in the base price still result in large oscillations. Results are similar to the case without heterogeneity in the set-points (Fig. 3). This is understandable because even though set-points vary, the relative temperature differences (compared to the individual set-points) may still
Bid price of TCLs
50 0 0
20
50 15
100 150
10 200
Time (5 mine steps)
5
250 300
TCL index
0
Fig. 4. Bid evolution at 5 minute intervals for 20 randomly chosen TCLs.
Fig. 6. Temperature synchronization and highly fluctuating demand due to moderate fluctuations in base price.
relative movements of the TCL bids (due to changes in their temperatures) compared to the base price levels may lead to significant fluctuations in the aggregate power, as shown in Fig. 6(b). C. Oscillations induced due to feeder capacity constraint
Fig. 5. Oscillations in 5-minute average aggregate demand, induced by sharp changes in base price, despite heterogeneity in TCL set-points.
synchronize, which then leads to oscillations in aggregate demand when the base price falls considerably. B. Fast transients due to temperature synchronization and fluctuating prices Instead of large step changes in price, this case considered a price signal which fluctuates between 20 and 30 $/MWh. Behavior is shown in Fig. 6. Surprisingly this triggers a highly fluctuating response in the 5-minute average TCL demand. Investigations suggest that variations in the TCL bids (as their temperatures change) relative to the base price cause these sharp transients in aggregate power levels. This study assumed that the slopes of the bid curves, though heterogeneous, are not significantly different. Initially very few TCL bids were sufficiently high to be cleared. Hence, their temperatures rose to around 20.6◦ C. At this point, many placed sufficiently high bids and were subsequently cleared. If the base price remained unchanged, these TCLs would continue to consume power enabling their temperatures to reach the desired set-points. However, if the base price were to rise slightly, it would cause some TCLs to turn off since their bids become unfavorable. Conversely, if the majority of the TCLs were off, then a small drop in the base price would lead to TCLs with similar bids being cleared and turning on. As their temperatures approach their set-points, they bid lower and at some point will no longer be cleared. Thus, these
Fig. 7 shows a situation where fast oscillations were induced due to the feeder capacity constraint. The base price signal in this case resembles a pulse train fluctuating between 14 and 24 $/MWh. Every time the base price drops, TCLs switch on and the base aggregate demand of the TCLs reaches the feeder limit. For example, when the price drops to 14 $/MWh at t = 240 min, all TCLs want to cool since their temperatures have risen considerably during the preceding high price period. However, if all TCLs turn on at the same time, the feeder limit will be violated. Following the mechanism described in Section II-D, the clearing price is revised above the base price and therefore feeder limits are respected. However, as the clearing price approaches 14 $/MWh, a specific pattern of fast oscillations emerges, as seen in Fig. 7(b). By the time clearing prices approach 14 $/MWh, TCL temperatures are near their set-points so they offer low bids. However, a fraction of TCLs still bid higher than 14 $/MWh and are cleared. As these cool more, they bid lower and subsequently turn off. By that time, temperatures of a second group have risen such that their bids now exceed 14 $/MWh and they turn on. Thus, the most aggressive ones get cleared first, then the next group, and so on. Subsequently, as the base price rises again to 24 $/MWh, all loads turn off since they are unwilling to pay such a high price when their temperatures are already near their desired set-points. This behavior continues as long as the base price keeps oscillating. D. Oscillations due to subgroups of TCLs with similar bid curves This case shows that it is not necessary for all TCLs to be synchronized at the same temperature to cause power oscillations. It can be seen from Fig. 8 that groups of TCLs
of different frequency oscillations from groups of separately synchronized TCLs. Future research will investigate these effects in a more formal Poincar´e analysis setting and develop control algorithms that are able to avoid the risks of oscillatory behavior from synchronized TCLs. R EFERENCES
Fig. 7. Fast oscillations due to groups of TCLs having synchronized temperatures.
Fig. 8. Fast power oscillations due to groups of TCLs having similar bids, leading to their synchronized temperatures.
have synchronized temperatures, with TCLs within each group evolving in a similar manner. This then results in quasiperiodic behavior for the ensemble of loads. Besides large magnitude oscillations in power, the ensemble demand also displays jitter. The quasi-periodic evolution of the ensemble results in mixing of oscillations of different frequencies. IV. D ISCUSSIONS AND F UTURE W ORK A transactive coordination mechanism has been applied to a population of TCLs. A modification to TCL switching logic was established to take into account market coordination signals, alongside the natural hysteresis-based switching of TCLs. Investigations identified conditions that give rise to load synchronization and power oscillations. Simulations suggest that several factors can contribute to such synchronism, including sharp changes in base price, prolonged flat base prices, lack of diversity in user specified bid curves, the form of the bid curves, and similarity of bid curves across subgroups of TCLs. It was also observed that imposing a feeder limit constraint, while effectively limiting demand through adjustment of market clearing prices, may lead to an oscillatory power response where jitters appear due to mixing
[1] D. S. Callaway and I. A. Hiskens, “Achieving controllability of electric loads,” Proceedings of the IEEE, vol. 99, no. 1, pp. 184–199, Jan 2011. [2] D. S. Callaway, “Tapping the energy storage potential in electric loads to deliver load following and regulation, with application to wind energy,” Energy Conversion and Management, vol. 50, no. 5, pp. 1389–1400, 2009. [3] S. Bashash and H. K. Fathy, “Modeling and control of aggregate air conditioning loads for robust renewable power management,” IEEE Transactions on Control Systems Technology, vol. 21, no. 4, pp. 1318– 1327, 2013. [4] J. L. Mathieu, S. Koch, and D. S. Callaway, “State estimation and control of electric loads to manage real-time energy imbalance,” IEEE Transactions on Power Systems, vol. 28, no. 1, pp. 430–440, 2013. [5] M. S. Nazir, F. D. Galiana, and A. Prieur, “Unit Commitment Incorporating Histogram Control of Electric Loads with Energy Storage,” IEEE Transactions on Power Systems, vol. 31, no. 4, pp. 2857–2866, 2016. [6] S. Kundu, N. Sinitsyn, S. Backhaus, and I. Hiskens, “Modeling and Control of Thermostatically Controlled Loads,” in Proceedings of the 17th Power Systems Computation Conference, 2011. [7] D. Jin, X. Zhang, and S. Ghosh, “Simulation models for evaluation of network design and hierarchical transactive control mechanisms in smart grids,” in 2012 IEEE PES Innovative Smart Grid Technologies, 2012, pp. 1–8. [8] P. Huang, J. Kalagnanam, R. Natarajan, M. Sharma, R. Ambrosio, D. Hammerstrom, and R. Melton, “Analytics and Transactive Control Design for the Pacific Northwest Smart Grid Demonstration Project,” in Smart Grid Communications (SmartGridComm), 2010 First IEEE International Conference on, 2010, pp. 449–454. [9] H. Hao, C. D. Corbin, K. Kalsi, and R. G. Pratt, “Transactive Control of Commercial Buildings for Demand Response,” IEEE Transactions on Power Systems, pp. 1–1, 2016. [10] S. Li, W. Zhang, J. Lian, and K. Kalsi, “Market-Based Coordination of Thermostatically Controlled Loads - Part I: A Mechanism Design Formulation,” IEEE Transactions on Power Systems, vol. 31, no. 2, pp. 1170–1178, 2016. [11] ——, “Market-Based Coordination of Thermostatically Controlled Loads - Part II: Unknown Parameters and Case Studies,” IEEE Transactions on Power Systems, vol. 31, no. 2, pp. 1–9, 2016. [12] A. K. Bejestani, A. Annaswamy, and T. Samad, “A hierarchical transactive control architecture for renewables integration in smart grids: Analytical modeling and stability,” IEEE Transactions on Smart Grid, vol. 5, no. 4, pp. 2054–2065, 2014. [13] J. Knudsen, J. Hansen, and A. M. Annaswamy, “A Dynamic Market Mechanism for the Integration of Renewables and Demand Response,” IEEE Transactions on Control Systems Technology, vol. 24, no. 3, pp. 940–955, 2016. [14] S. Ihara and F. C. Schweppe, “Physically based modeling of cold load pickup,” IEEE Transactions on Power Apparatus and Systems, vol. PAS100, no. 9, pp. 4142–4150, 1981. [15] S. Kundu and N. Sinitsyn, “Safe protocol for controlling power consumption by a heterogeneous population of loads,” in 2012 American Control Conference (ACC), June 2012, pp. 2947–2952. [16] C. Perfumo, J. Braslavsky, J. K. Ward, and E. Kofman, “An analytical characterisation of cold-load pickup oscillations in thermostatically controlled loads,” in 2013 3rd Australian Control Conference, 2013, pp. 195–200. [17] R. E. Mortensen and K. P. Haggerty, “Stochastic computer model for heating and cooling loads,” IEEE Transactions on Power Systems, vol. 3, no. 3, pp. 1213–1219, 1988. [18] J. C. Fuller, K. P. Schneider, and D. Chassin, “Analysis of residential demand response and double-auction markets,” in IEEE Power and Energy Society General Meeting, 2011, pp. 1–7.