sparse coding, features are automatically assigned to the centers that can optimally .... here we call them template features, to construct the Lapla- cian matrix.
Local Features Are Not Lonely – Laplacian Sparse Coding for Image Classification Shenghua Gao, Ivor Wai-Hung Tsang, Liang-Tien Chia, Peilin Zhao School of Computer Engineering, Nanyang Technological University, Singapore {gaos0004,IvorTsang,asltchia,zhao0106}@ntu.edu.sg
Abstract
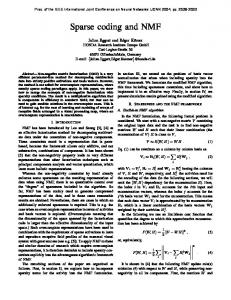
Similar features to be quantized
Sparse coding which encodes the original signal in a sparse signal space, has shown its state-of-the-art performance in the visual codebook generation and feature quantization process of BoW based image representation. However, in the feature quantization process of sparse coding, some similar local features may be quantized into different visual words of the codebook due to the sensitiveness of quantization. In this paper, to alleviate the impact of this problem, we propose a Laplacian sparse coding method, which will exploit the dependence among the local features. Specifically, we propose to use histogram intersection based kNN method to construct a Laplacian matrix, which can well characterize the similarity of local features. In addition, we incorporate this Laplacian matrix into the objective function of sparse coding to preserve the consistence in sparse representation of similar local features. Comprehensive experimental results show that our method achieves or outperforms existing state-of-the-art results, and exhibits excellent performance on Scene 15 data set.
k-means
Sparse Coding
Visual words
Laplacian Sparse Coding
Figure 1. Feature Quantization strategies for different methods. In k-means, each feature is only assigned to one clustering center; In sparse coding, features are automatically assigned to the centers that can optimally reconstruct this feature, but it is sensitive to feature variance. In Laplacian sparse coding, similar features are not only assigned to optimally-selected cluster centers, but we also guarantee the selected cluster centers are also similar. Therefore, Laplacian sparse coding is more robust for feature quantization.
In these three modules, codebook generation and feature quantization are the most important and govern the quality of image presentation. Codebook, whose entries are termed as visual words, is a collection of basic patterns used to reconstruct the input local features. Usually hard assignment method, such as k-means is adopted to generate the codebook, and kNN is used to assign each local feature to the visual words. However, such method may cause severe information loss [1] by assigning each visual feature to only one visual word, especially for those features located at the boundary of several visual words. Thereafter, soft assignment [16, 19] is introduced to assign each feature to more than one visual words. However, the way of assigning weight to the visual words and the number of visual words to be assigned for each visual feature are not trivial to be determined. One evident drawback in BoW model is the spatial information loss. To overcome this, Lazebnik et al.[8] extended the BoW model with Spatial Pyramid Matching Kernel (SPM) by exploiting the spatial information of location regions. More specifically, each image is partitioned into increasingly finer sub-regions and Pyramid Match Kernel [4] is used to compare corresponding sub-regions. Many work [8, 24, 25] have shown the effectiveness of SPM in
1. Introduction Image classification is one of the fundamental problems in computer vision, which has attracted lots of researchers’ attention these years. Many image representation models have been proposed for this problem, such as Part-based model [3], Bag of Words(BoW) model [18], etc. Amongst these models, BoW model has shown excellent performance and been widely used in many real applications (such as image classification [22], image annotation [21], image retrieval [16] and video event detection [24]) due to its robustness to scale, translation and rotation variance. BoW image representation contains the following three modules: (i) Region selection and representation; (ii) Codebook generation and feature quantization; (iii) Frequency histogram based image representation. 1
many computer vision applications including image classification, image retrieval and video retrieval. Recently, Yang et al.[25] proposed an extension of SPM by using Sparse Coding (referred to as ScSPM), and showed state-of-the-art performance in image classification. By replacing k-means with sparse coding, their method can automatically learn the optimal codebook, and concurrently, search for the optimal weight to be assigned to the visual words for each local feature. In this way, both the quantity of codebook and the accuracy of the quantization process are improved. After this, SPM based maximum pooling is used to summarize all the local features information to represent the image. However, in sparse coding, local features are dealt separately. The mutual dependence among local features is ignored, which results in the sparse codes may vary a lot even for similar features. To overcome this drawback, in this paper, we propose a more robust sparse coding method: Laplacian sparse coding which can be used to learn the codebook and quantize local features more robustly. We illustrate the difference among k-means, sparse coding and Laplacian sparse coding in Fig. 1. The contributions of this paper can be summarized as follows: we propose a more robust Laplacian Sparse Coding for feature quantization. By introducing a histogram intersection based kNN method to construct Laplacian matrix, which can well characterize the similarity between the local features, our new formulation can generate more discriminative sparse codes which can be used to represent the image more robustly. Moreover, as shown in Section 4.6 and 4.7, this dependence can dramatically reduce the quantization error and preserve the consistence of sparse codes of the similar local features during the image representation process. The rest of this paper is organized as follows: We will discuss the related work in Section 2. In Section 3, we propose Laplacian sparse coding framework for feature quantization and image classificationin which histogram intersection based kNN method is used to construct the Laplacian matrix to measure the dependence among the local features. Experimental results on several publicly available data sets are reported in Section 4. We give the conclusive remarks in Section 5.
2. Related Work Several variants of sparse coding technique have been proposed in recent research by adding some additional regularization and/or constraints. Kavukcuoglu et al. proposed spatial consistent sparse coding for local feature extracting[7]. By adding additional spatial consistent constraint, they can extract discriminative features for image representation. Julien et al. successfully used simultaneously sparse coding to make all features response to a subset of the codebook in image restoration[15]. In this way,
the similarity between the features are obtained. But forcing dissimilar features to have similar response may worsen the performance. Sparse coding has been used in image classification in recent work[17, 25]. Mairal et al. [14] proposed a joint dictionary learning and classifier construction framework. By adopting sparse coding to generate the codebook, their model achieved excellent performance in texture classification. However, their model cannot be easily embedded in BoW model based image classification framework. Our work extends ScSPM proposed by Yang et al. [25], referred to as LScSPM. LScSPM automatically learns an unsupervised dictionary, as well as the sparse representation that preserves the consistence of similar local features. The details of our method will be described in the following sections.
3. Spatial Pyramid Matching using Laplacian Sparse Coding (LScSPM) 3.1. Sparse Coding for Codebook Generation k-means clustering is widely used for the codebook generation in BoW model. In k-means method, the data matrix of local feature space X = [x1 , x2 , . . . , xN ] ( xi ∈ Rd×1 ) is partitioned into k clusterings S = [S1 , S2 , . . . , Sk ], and the corresponding centers U = [u1 , u2 , . . . , uk ] ∈ Rd×k form the codebook. In k-means clustering, each local feature is assigned to one clustering center only, and the weight contributing to that center is 1. Note that k-means aims at finding these clustering centers and minimizing the inter-class error. This can be formulated as optimization problem: min U,S
k � �
�xj − ui �2 = min
i=1 xj ∈Si
U,V
N �
�xi − U vi �2
i=1
(1)
subject to : Card(vi ) = 1, |vi | = 1, vi � 0, ∀i. Here V is a matrix of clustering indices. V = [v1 , v2 , . . . , vN ] (where vi ∈ Rk×1 ). However, the constraint that each local feature only contributes to one visual word is too strict, especially for those points located at the boundary of several clusters. To this end, the hard constraint Card(vm ) = 1 on vm is usually relaxed for the soft assignment method. Moreover, to avoid each feature to be assigned to too many clusters, the sparse constraint on the weight vector vm is usually added to the objective. Then, we arrive at the optimization problem of sparse coding 1 : min U,V
N �
�xi − U vi �2 + λ�vi �1
i=1
(2)
subject to : |uj | ≤ 1, ∀j = 1, . . . , k. 1 We only sample some features to learn the codebook U due to the large amount of local features.
3.2. Laplacian Sparse Coding Sparse coding has shown its effectiveness in feature quantization. However, there still exists two limitations: (i): Due to the over-complete codebook/dictionary, even a small variance in local features may result in totally different responses to the basis in the codebook(Fig. 6). Thus, sparse coding is sensitive to the variance of the features [7]. This can greatly influence the final image representation. (ii): In addition, the dependence information among the local features is lost during sparse coding process. However, recent work shows that the relationship among the features are important for image representation, such as the geometric relationship [23]. To better characterize the relationship between the local features and alleviate the sensitiveness of sparse coding, in this subsection, we introduce the Laplacian sparse coding. More specifically, the similarity among the sparse codes is considered during the process of sparse coding. Different from simultaneously sparse coding[15], we explicitly introduce a regularization term into the optimization problem (2) to preserve the consistence of sparse codes for the similar local features. Thus, the sparse codes for local features are no longer independent. Moreover, with the use of this regularization, the quantization error of the local features can be significantly reduced and the similarity of sparse codes among the similar local feature can be maximally preserved. Denote the similarity matrix 2 as W , which encodes the relationship among the local features. The resultant optimization problem is reformulated as follows: min�X − U V �2F + λ
�
U,V
i
= min�X − U V U,V
�2F
+λ
�vi �1 + β/2
�
�
�vi − vj �2 Wij
ij
�vi �1 + βtr(V LV T )
i
subject to : �um �2 ≤ 1. (3) Here the Laplacian matrix L is defined as L = D − W � where Dii = j Wij is the degree of the ith node, and we also set Wii = 0(i = 1, 2, . . . , n), and �um �2 ≤ 1 is used to avoid the scaling problem of um .
3.3. Implementation The formulation (3) is not convex for U and V simultaneously, but it is convex for U when V is fixed and it is also convex for V when U is fixed. Following the work[9], we optimize U and V alternatively. Due to large quantity of local features, it is computationally infeasible to construct the Laplacian matrix using all the features and learn the sparse 2 The size of similarity matrix: W ∈ RN ×N , and N is the local feature number sampled for codebook generating.
codes for all the features simultaneously. So we use the following two stages to learn the sparse codes for each feature. Step 1: Learning codebook and sparse codes of template feature. We firstly randomly sample some local features, here we call them template features, to construct the Laplacian matrix. And we use these template features to learn the codebook U . Meantime, we keep the sparse codes of these template features. Step 2: Learning sparse codes for new features. When a new feature comes in, we calculate its k nearest neighbors in the template feature pool and form a similarity vector Wi . Suppose that the input of this new feature does not affect the graph used in the codebook learning process, then the sparse codes for the template features are fixed. We just need to optimize the following objective: � �v − vi �2 Wi (4) min�x − U v�2F + λ�v�1 + β v
i
Here x and v are the new local feature and the corresponding sparse code. Subscript i is used to index the template feature. And Wi is calculated by using histogram intersection based kNN strategy. Therefore, we can get the sparse code for this new feature. More specifically, when V is fixed in formula (3), we can update the codebook by optimizing the following objective using conjugate gradient decent method[9]. min�X − U V �2F s.t. �um �2 ≤ 1 U
(5)
When U is fixed, we optimize each vi alternatively rather than optimize (3) simultaneously. To optimize each vi , we fix the sparse codes vj (j �= i) for other local features. So the optimization of objective of (3) equals to optimizing the following objective: minL(vi ) + λ�vi �1 , vi
(6)
where L(vi ) = �xi − U vi �2 + β(viT (V Li ) + (V Li )T vi − viT Lii vi ), and Li is the ith column of L and Lii is the entry located in the ith column, ith row of L. We follow the feature sign search algorithm[9] to solve the vi . It is worthy mentioning that in order to speed up the convergence of sparse codes, we initialize the sparse codes as the results of general sparse coding.
3.4. Histogram Intersection for Laplacian Matrix As aforementioned, one can incorporate different similarity matrix W into our proposed Laplacian sparse coding to generate the codebook and quantize the local features. Recall that local descriptor SIFT is actually the histogram of the gradients in a local patch, the desired result is for similar local features to have similar sparse codes according to
the histogram information. Moreover, histogram intersection has shown its effectiveness in evaluating the similarity between two histograms [22, 8]. So it is natural to use histogram intersection to construct the similarity matrix of the SIFT features. In addition, compared with Gaussian kernel, histogram intersection can be easily used as there is no need to tune the parameter, and the performance of Gaussian kernel is very sensitive to the parameter. The histogram intersection between two histograms is defined as follows: W (Hi , Hj ) =
D �
min(Hid , Hjd )
(7)
d=1
where D is the dimension of two histograms. After that, we use kNN method to construct the similarity matrix W . Specifically, if xj is in the k nearest neighbor of xi , then we set Wij = Wji = W (xi , xj ), otherwise we set Wij = 0. In our experiments, we set k = 5.
3.5. Maximum Feature Pooling and Spatial Pyramid Matching Based Image Representation After sparse coding, we can learn both the codebook, in which each basis vector represents one basic local patch pattern, and hundreds of thousands of sparse codes. Each entry of certain sparse code represents the response of the patch to the corresponding basic pattern in the codebook. On the one hand, noises usually behave as small response to the basic patterns in the codebook, and it is necessary to overcome these noises to make the image representation more robust. On the other hand, to follow the work of Yang et al.[25] for a fair comparison, we use maximum pooling based image representation. Suppose one image region has n local features, and the codebook size is k. The sparse codes for these local features are [v1 , v2 , . . . , vn ]. After maximum pooling, each image will be represented by a k dimensional vector y, and the lth entry is the largest response to the lth basis vector of the all the sparse codes in the selected region (vnl is the lth entry of vn ): yl = max{|v1l |, |v2l |, . . . , |vnl |}
(8)
To preserve the spatial information, SPM is also used in our method. By dividing the whole image into increasing finer regions and using maximum pooling image representation in each subregion, both the spatial layout and more basic pattern responses will be retained.
4. Experiments In this section, we evaluate our method on several data sets: Scene 15, Caltech 256, Corel10 and UIUC-Sport. Experiments setting, quantization error and similarity between Laplacian sparse codes are also analyzed in this section.
4.1. Parameters Setting Local features descriptor is essential to image representation. In our work, we adopt the widely used SIFT[11] feature due to its excellent performance in image recognition[2, 20, 1, 6]. To be consistent with previous work[8, 25], we use the same setting to extract SIFT feature. Specifically, we use dense grid sampling strategy to select regions of interest. It is empirically showed that higher performance can be achieved if smaller step size is used, which results in more local patches and inevitably increases the computation costs. To fairly compare with others, we fix the step size and patch size to 8 and 16 respectively. We also resize the maximum side(lenth/width) of each image to 300 pixels3 . After obtaining the SIFT, we use �2-norm to normalize the SIFT feature to 1. For the codebook size, we fix it to 1024, and randomly select (1.0 ∼ 1.2) ∗ 105 features to generate codebook for each data set. All the results for each data set are based on 6 independently experiments, and the training images are selected randomly. For SPM, we use the top 3 layers and the weight for each layer is the same. We use one-vs-all linear SVM due to its advantages in speed and excellent performance in maximum feature pooling based image classification[25]. In our formulation, the most important two parameters are (i): the sparsity of the sparse codes γ. The performance is best in ScSPM[25] when it is 0.3-0.4. We follow the same setting of 0.3-0.4.(ii): the weight on the similarity constraint β; According to our observation, the performance is good when β is fixed at 0.1(γ = 0.3) or 0.2(γ = 0.4). Specifically, in Caltech 256 and UIUC-Sport, we set β = 0.1, γ = 0.3, and in Scene and Corel10, we set β = 0.2, γ = 0.4.
4.2. Scene 15 Data Set Scene 15 contains 15 categories and 4485 images in all, 200 to 400 images per category. The image content is diverse, containing not only indoor scene, such as bedroom, kitchen, but also outdoor scene, such as Building and country etc. To compare with others’ work, we randomly select 100 images per class as training data and use the rest as test data. We list the performance based on different methods in Table 14 . Moreover, the confusion matrix for scene is shown in Fig. 2. Table 1 shows that our LScSPM can achieve extremely high performance on scene classification and outperform ScSPM by nearly 10% by adding the Laplacian constraint. The probable reason is that for scene, it contains more plentiful textures in each single patch, which results in the unstableness for sparse coding process. By adding the Laplacian 3 For UIUC-Sport data set, we resize the maximum side to 400 due to the high resolution of original image. 4 All the results of HIK + OCSVM are based on step size = 8 in this paper.
Table 1. Performance Comparison on Scene 15 Data Set(%) (KSPM: Spatial pyramid matching and SVM using Histogram intersection kernel; ScSPM: Sparse coding incorporating spatial pyramid matching; HIK+OCSVM: Using Histogram intersection kernel and one class SVM to quantize local feature.)
0
0.2
0
0
0
0
0
0.1
0
0
0
0.2
0
highway
0.2
2.8
insidecity
0.1
0
0
0
0.1
0.1
0
0.1
0.1
0
0.1
opencountry street
99
0
0
0.5
0
0
0
0
0.3
0
0
0.4
0.4 92.8
0.3
0.5
0
0
0.6
0.5
0.3
0.8
0
0
0.6
0 91.2
0.2
0.9
3.4
1.3
0
0
0
1
0.5
1.5
0.2 91.4 0
3.7
0
store
0.1
livingroom
0 0.4
kitchen
0 0.1
industrial
0 0
bedroom
PARoffice
0 0.3
street
0 0
forest
mountain
opencountry
0 2.3
mountain
0 0.8
insidecity
0
0 95.9
highway
99.6
forest
tallbuilding
coast
coast
suburb
Average Classification Rate 81.40±0.50 80.28±0.93 84.00±0.46 89.75±0.50
suburb
Method KSPM[8] ScSPM[25] HIK+OCSVM[22] LScSPM
7.2
0.3
0.2
0
0.1
0
0.1
0.2
0.2
94.2
1.2
0
0
0
0
0.3
0.2
0.3
0
0
0
0.8
4.3
0.7
0
92.7
0.5
0
0
0.2
0
0.2
0.6
tallbuilding
0.4
0.3
0.7
0.1
0.8
1
0
0
95.8
0
0.2
0.6
0
0
0.3
PARoffice
0
0
0
0
0
0
0
0
0
99.1
0.3
0.4
0.1
0
0
bedroom
0.6
0
0
0
0
0.6
0
0
0.4
8
87.5
1.6
0.3
0.7
0.3
industrial
2.4
1.4
0.8
0.8
0.3
1.6
0
0.8
6.6
3.9
2.8
71.7
0.4
0.2
6.2
kitchen
0
0
0
0
0
79.4 12.9
livingroom
0
0
0
0
1.1
0.5
0
0.8
0
0.1
0.7
0.1
13.5 76.9
store
0
0
0
0
0.1
0
0
0
4.7
1.5
3.4
1.1
0.1
2
0.4
0
0.1
0.3
0.4
5.7
5
4.8 6.3
longs to these 256 categories. Compared with Caltech 101, in which the objects are often in the center of image, the intra-class variance, including object location, in Caltech 256 is much bigger. Therefore Caltech 256 is a very challenging data set so far for object recognition. We evaluate our method under the four different settings: 15, 30, 45 and 60 training images respectively. The results on this data set are listed in Table 2. From this table we can see that our method can outperform or achieve state-of-the-art performance on this data set. Moreover, our method is more robust in term of the accuracy. Table 2. Performance Comparison on Caltech 256 Data Set(%) (KC: Kernel codebook;)
TrnNO 15 30 45 60
KSPM[5] NA 34.10 NA NA
KC[19] NA 27.17±0.46 NA NA
ScSPM[25] 27.73±0.51 34.02±0.35 37.46±0.55 40.14±0.91
LScSPM 30.00±0.14 35.74±0.10 38.54±0.36 40.43±0.38
78.2
Figure 2. Confusion Matrix on Scene 15 Data Set(%). In confusion matrix, the entry in the ith row and j th column is the percentage of images from class i that are misidentified as class j. Average classification rates for individual classes are listed along the diagonal.
Figure 3. Some misclassified instances in Scene 15 Data Set. The images in 1st row are from kitchen, but they are misclassified as living room, and the images in 2nd row are from class living room but they are misclassified as kitchen.
term, similar patches will be encoded into similar sparse codes. Thus image can be more accurately represented. Fig. 2 shows the classification and misclassification status for each individual class. Our method performs amazingly good for class office, suburb and forest(more than 99%). What’s more, we notice that the class kitchen and living room have a high percentage being classified wrongly, and this may result from that they are visually similar to each other. We list some misclassified images in Fig. 3 of these two classes.
We notice that as the number of training data increases, the improvement of our method decreases compared with ScSPM in Table 2. The reason may be that the Laplacian term can make similar features close to each other in the sparse codes space by reducing the variance. This results in the images belonging to the same class are finally represented similarly. As a result, features distribution density of the same class is enhanced. This will facilitate the classification performance. As the training data increases, the distribution density of the feature from the same class is dense enough. So the improvement compared with sparse coding without Laplacian becomes smaller.
4.4. UIUC-Sport Data Set UIUC-Sport[10] contains 8 categories and 1792 images in all, and the image number ranges from 137 to 250. These 8 categories are badminton, bocce,croquet, polo, rock climbing, rowing, sailing and snow boarding. To compare with others’ work, we also randomly select 70 images from each class as training data and randomly select 60 images as test data. We list our results in Table 3. Moreover, the confusion matrix for this data set is shown in Fig. (4). Table 3. Performance Comparison on UIUC-Sport Data Set(%)
Method ScSPM[25], HIK+OCSVM[22] LScSPM
Average Classification Rate 82.74±1.46 83.54±1.13 85.31±0.51
4.3. Caltech 256 Data Set Caltech 2565 contains 256 categories and 29780 images besides a background class in which none of the image be5 www.vision.caltech.edu/Image_Datasets/Caltech256/
4.5. Corel10 Data Set Corel10[13] contains 10 categories and 100 images per category. These categories are skiing, beach, buildings,
snowboarding
sailing
rowing
polo
croquet
bocce
badminton
RockClimbing
94.6 0.0 0.1 0.5 0.5 1.6 0.1 2.4 0.1 93.6 1.8 1.4 1.2 0.6 0.4 0.9 5.0 2.0 64.7 11.9 4.5 6.2 0.5 5.2 3.4 0.6 11.8 77.8 3.4 1.3 0.8 0.8 2.1 1.5 2.8 1.8 86.6 3.9 0.0 1.3 1.2 1.6 2.0 0.8 2.9 87.8 1.9 1.9 0.0 0.0 1.5 2.4 0.1 1.5 93.9 0.6 3.9 1.0 5.6 1.5 0.8 3.2 0.6 83.5
Rock Climbing badminton bocce croquet polo rowing sailing snowboarding
compute the AverQE of our Laplacian sparse coding (LSc) and Sparse coding (Sc) on all the template features in Table 5. Our method can greatly decrease quantization loss. The reason is that sparse codes of Laplacian sparse coding preserve the spatial consistence of SIFT features, while sparse coding does not preserve these redundancies among similar SIFT features.(as shown in Fig 1 and 6). Table 5. Average Feature Quantization Error on Different Data Sets.
Figure 4. Confusion Matrix on UIUC-Sport Data Set(%).
Sc LSc tigers, owls, elephants, flowers, horses, mountains and food. Following the setup of Lu et al.[13], we randomly select 50 images as training data and use the rest 50 images as test data. Results of our method are shown in Table 4 and Fig. 5.
Scene 0.8681 0.1802
Caltech 256 0.9164 0.1161
Sport 0.8864 0.1245
Corel 0.9295 0.1810
Laplacian Sparse codes for a feature pair, Similarity = 0.8541 0.4 0.2 0
−0.4
food
Method SMmK[13] SMK[12] ScSPM[25] LScSPM LScSPM+CM
Average Classification Rate 90.0 77.9 86.2±1.01 88.4±0.78 92.0±1.12
Table 4 shows the effectiveness of our method. But we notice that SMmK achieves better results, this is because both texture and color features are used in SMmK, and images in the same class show similar color distribution in this data set. By incorporating block-wise color moment(CM), our LScSPM+CM can achieve the best performance of all the methods under comparison.
4.6. Feature Quantization Error Average quantization error (AverQE) is an important index for evaluating �N the quality of feature quantization. AverQE = N1 i=1 �xi − U vi �2F . Smaller quantization error means less information loss in the feature quantization, which will boost the classification performance. We
400
600
800
1000
1200
0.4 0.2 0 −0.2 −0.4
0
200
400
600
800
1000
1200
Figure 6. The sparse codes for two similar SIFT features. The sparse codes for these SIFT features are totally different. But our Laplacian sparse codes are still similar. Laplacian Sparse coding Similarity between LSc
Table 4. Performance Comparison on Corel10 Data Set(%) (SMK: Spatial Markov Model; SMmK: Spatial Mismatch Kernel)
200
Sparse codes for a feature pair, Similarity = 0.8541
flower 88.0 0.5 2.5 5.0 0.0 0.0 1.5 0.0 2.5 0.0 elephants 4.5 73.0 5.5 1.0 0.0 5.5 0.0 2.5 2.5 5.5 owls 1.5 4.0 82.5 0.0 2.0 0.5 0.0 3.5 3.0 3.0 tiger 1.0 0.0 0.0 98.0 0.5 0.0 0.0 0.0 0.0 0.5 building 0.5 0.5 0.5 4.5 92.0 0.0 2.0 0.0 0.0 0.0 beach 0.5 0.0 0.5 0.0 0.0 91.5 0.0 5.0 2.5 0.0 skiing 0.0 0.0 0.0 0.0 0.0 0.0 97.0 0.0 1.5 1.5 horses 0.0 1.0 2.0 0.5 0.0 2.0 0.0 94.5 0.0 0.0 mountains 1.5 7.5 4.0 0.0 2.5 0.5 0.0 0.5 82.5 1.0 food 0.0 1.5 3.5 0.0 1.0 1.0 1.0 0.0 3.0 89.0
Figure 5. Confusion Matrix on Corel10 Data Set(%).
0
Sparse coding Similarity between Sc
mountains
horses
skiing
beach
building
tiger
owls
elephants
flower
−0.2
Similarity between SIFT
Similarity between SIFT
Figure 7. The similarity correspondence relationship between the of the sparse codes and the SIFT features.
4.7. Similarity Correspondence Between SIFT and Laplacian Sparse Codes The main contribution of our formulation is the similarity preservation. To illustrate this, we plot the Laplacian sparse codes and sparse codes for a pair of similar SIFT features sampled from scene 15 data set in Fig. 6. It can be shown that the responses from similar SIFT features using Laplacian Sparse Coding are very similar, but the responses from similar SIFT features using Sparse Coding vary a lot. To further evaluate this, 200 SIFT features from the scene
15 data set are randomly selected. We calculate their pairwise similarity by using histogram intersection. We also calculate the similarity of their sparse codes and Laplacian sparse codes by using normalized correlation. We plot their similarity correspondence in Fig. 7. Fig. 7 shows an evident linear trend of the similarity between sparse codes against the similarity between SIFT features, which proves that our Laplacian sparse coding preserves the similarity of original features.
5. Conclusion In this paper, we propose a new framework of sparse coding for feature quantization in BoW model. By adding the locality preserving constraint among similar local features in the objective, the relationship between local features can be kept. By using histogram intersection based kNN method to construct the Laplacian matrix, our method can robustly characterize the local features in sparse codes domain. Experimental results show that our method can achieve excellent performance, especially on Scene 15 data set, and outperform the general sparse coding framework. All these sufficiently demonstrate the effectiveness of our method.
6. Acknowledgement This material is based upon work funded by Singapore MOE AcRF Tier-1 Grant (RG15/08).
References [1] O. Boiman, E. Shechtman, and M. Irani. In defense of nearest-neighbor based image classification. In CVPR, Anchorage, Alaska, USA, 24-26 June 2008. 1, 4 [2] A. Bosch, A. Zisserman, and X. Munoz. Representing shape with a spatial pyramid kernel. In Proceedings of the International Conference on Image and Video Retrieval, 2007. 4 [3] R. Fergus, P. Perona, and A. Zisserman. A sparse object category model for efficient learning and exhaustive recognition. CVPR, 1:380–387, 2005. 1 [4] K. Grauman and T. Darrell. The pyramid match kernel: Discriminative classification with sets of image features. In ICCV 2005, 2005. 1 [5] G. Griffin, A. Holub, and P. Perona. Caltech-256 object category dataset. In Technical Report, 2007. 5 [6] P. Jain, B. Kulis, and K. Grauman. Fast image search for learned metrics. In CVPR, 24-26 June 2008, Anchorage, Alaska, USA. 4 [7] K. Kavukcuoglu, M. Ranzato, R. Fergus, and Y. LeCun. Learning invariant features through topographic filter maps. In CVPR, Florida, USA, June 2009. 2, 3 [8] S. Lazebnik, C. Schmid, and J. Ponce. Beyond bags of features: Spatial pyramid matching for recognizing natural scene categories. In CVPR, New York, USA, 17-22 June 2006, pages 2169–2178. 1, 4, 5
[9] H. Lee, A. Battle, R. Raina, and A. Y. Ng. Efficient sparse coding algorithms. In NIPS, Vancouver, British Columbia, Canada, December 4-7, 2006, pages 801–808. 3 [10] L.-J. Li and L. Fei-Fei. What, where and who? classifying events by scene and object recognition. In ICCV, Rio de Janeiro, Brazil, October 14-20, 2007. 5 [11] D. G. Lowe. Distinctive image features from scale-invariant keypoints. International Journal of Computer Vision(IJCV), 60(2):91–110, 2004. 4 [12] Z. Lu and H. H. Ip. Image categorization by learning with context and consistency. In CVPR, Florida, USA, June 2009. 6 [13] Z. Lu and H. H. Ip. Image categorization with spatial mismatch kernels. In CVPR, Florida, USA, June 2009. 5, 6 [14] J. Mairal, F. Bach, J. Ponce, G. Sapiro, and A. Zisserman. Discriminative learned dictionaries for local image analysis. In CVPR, Anchorage, Alaska, USA, 24-26 June 2008. 2 [15] J. Mairal, F. Bach, J. Ponce, G. Sapiro, and A. Zisserman. Non-local sparse models for image restoration. In ICCV, Kyoto, Japan, Sep. 27-Oct. 4, 2009. 2, 3 [16] J. Philbin, O. Chum, M. Isard, J. Sivic, and A. Zisserman. Object retrieval with large vocabularies and fast spatial matching. In CVPR, Minneapolis, Minnesota, USA, 18-23 June 2007. 1 [17] R. Raina, A. Battle, H. Lee, B. Packer, and A. Y. Ng. Selftaught learning: transfer learning from unlabeled data. In ICML, Corvalis, Oregon, USA, June 20-24, 2007, pages 759–766. 2 [18] J. Sivic and A. Zisserman. Video google: A text retrieval approach to object matching in videos. In ICCV, Nice, France, 14-17 October 2003,, pages 1470–1477. 1 [19] J. C. van Gemert, J. M. Geusebroek, C. J. Veenman, and A. W. M. Smeulders. Kernel codebooks for scene categorization. In ECCV, October 2008. 1, 5 [20] C. Wang, D. Blei, and L. Fei-Fei. Simultaneous image classification and annotation. In CVPR, Florida, USA, June 2009. 4 [21] C. Wang, S. Yan, L. Zhang, and H.-J. Zhang. Multi-label sparse coding for automatic image annotation. In CVPR, Florida, USA, June 2009. 1 [22] J. Wu and J. M. Rehg. Beyond the euclidean distance: Creating effective visual codebooks using the histogram intersection kernel. In ICCV, Kyoto, Japan, Sep. 27-Oct. 4, 2009. 1, 4, 5 [23] Z. Wu, Q. Ke, M. Isard, and J. Sun. Bundling features for large scale partial-duplicate web image search. In CVPR, Florida, USA, June 2009. 3 [24] D. Xu and S.-F. Chang. Video event recognition using kernel methods with multilevel temporal alignment. IEEE Trans. on Pattern Analysis and Machine Intelligence, 30(11):1985– 1997, 2008. 1 [25] J. Yang, K. Yu, Y. Gong, and T. Huang. Linear spatial pyramid matching using sparse coding for image classification. In CVPR, Florida, USA, June 2009. 1, 2, 4, 5, 6