J Neurophysiol 89: 2137–2145, 2003. First published December 27, 2002; 10.1152/jn.00582.2002.
Local Field Potentials and the Encoding of Whisker Deflections by Population Firing Synchrony in Thalamic Barreloids Simona Temereanca and Daniel J. Simons Department of Neurobiology, University of Pittsburgh, Pittsburgh, Pennsylvania 15261 Submitted 22 July 2002; accepted in final form 11 December 2002
Temereanca, Simona and Daniel J. Simons. Local field potentials and the encoding of whisker deflections by population firing synchrony in thalamic barreloids. J Neurophysiol 89: 2137–2145, 2003. First published December 27, 2002; 10.1152/jn.00582.2002. In layer IV of rat somatosensory cortex, barrel circuitry is highly sensitive to thalamic population firing rates during the first few milliseconds of the whisker-evoked response. This sensitivity of barrel neurons to thalamic firing synchrony was inferred previously from analysis of simulated barrel circuitry and from single-unit recordings performed one at a time. In this study, we investigate stimulus-dependent synchronous activity in the thalamic ventral posteromedial nucleus (VPm) using the more direct approach of local field potential (LFP) recording. We report that thalamic barreloid neurons generate larger magnitude LFP responses to principal versus adjacent whiskers, to preferred versus nonpreferred movement directions, and to high- versus low-velocity/ acceleration deflections. Responses were better predicted by acceleration than velocity, and they were insensitive to the final amplitude of whisker deflection. Importantly, reliable and robust stimulus/response relationships were found only for the initial 1.2–7.5 ms of the thalamic LFP response, reflecting arrival of afferent information from the brain stem. Later components of the thalamic response, which are likely to coincide with arrival of inhibitory inputs from the thalamic reticular nucleus and excitatory inputs from the barrel cortex itself, are variable and poorly predicted by stimulus parameters. Together with previous results, these findings underscore a critical role for thalamic firing synchrony in the encoding of small but rapidly changing perturbations of specific whiskers in particular directions.
INTRODUCTION
Behavioral studies have demonstrated that rats are able to use their whiskers to distinguish between surfaces differing subtly in texture (Carvell and Simons 1990; Guic-Robles et al. 1989). Presumably, this requires detection and processing of rapid whisker perturbations that occur as the vibrissal hair moves across the textured surface. Neurophysiological studies of the whisker-to-barrel pathway suggest that the system is indeed designed to respond robustly and rapidly to changes in sensory input (see Miller et al. 2001; Pinto et al. 2003). Following a whisker deflection, the activity of cortical layer IV “barrel” neurons appears to be strongly determined by the firing rates of populations of thalamic “barreloid” neurons during the first few milliseconds of their collective response (Pinto et al. 2000). “Preferred” whisker stimuli for cortical neurons, i.e., high-velocity deflections of the principal whisker, are associated with high thalamic firing synchrony, as inferred Address for reprint requests: D. J. Simons, Dept. of Neurobiology, E1440 Biomedical Science Tower, 200 Lothrop St., University of Pittsburgh School of Medicine, Pittsburgh, Pennsylvania 15261 (E-mail:
[email protected]). www.jn.org
from population response histograms. Analysis of simulated barrel circuitry suggests that synchronous thalamic firing effectively engages recurrent excitation within the barrel, permitting the excitatory response momentarily to withstand strong feedforward inhibition (Pinto et al. 1996). Thus information about salient whisker stimuli can be encoded in the thalamocortical circuit within the time that individual thalamic neurons fire only one or two spikes provided they do so in close temporal proximity. Synchronous thalamic firing enhances transmission of relevant thalamic information to visual cortex (Alonso et al. 1996; Usrey et al. 2000; see Usrey and Reid 1999) and may act as a code in the geniculocortical circuit, as well (Sillito et al. 1994). The study by Pinto et al. (2000) employed analyses based on single-unit data obtained one at a time. Conclusions regarding the importance of population firing synchrony were based on indirect measures derived from population peristimulus time histograms (PSTHs). Here, we use local field potential recordings as a measure of thalamic population responses and provide more direct evidence that synchronous thalamic activity differentially encodes not only deflection velocity but also stimulus location and direction of whisker movement. Together with previous findings, results strongly suggest that afferent information of particular salience to barrel circuitry is present at the population level in thalamus during a brief window of time following response onset and that firing synchrony is a rapid and robust mechanism for encoding information in the thalamus. METHODS
Surgical procedures Eleven adult female albino rats (Sprague-Dawley strain, Hilltop Lab Animals, Scottsdale, PA) were prepared for electrophysiological recordings under halothane anesthesia, using surgical procedures described in detail previously (Pinto et al. 2000; Simons and Carvell 1989). Briefly, a steel post was fixed to the skull with dental acrylic to hold the animal’s head, and a craniotomy was made at coordinates overlying the right ventral posteromedial (VPm) nucleus (2.0 – 4.5 mm posterior, 1.5– 4.0 mm lateral to bregma) (Paxinos and Watson 1998). After surgery, halothane was discontinued. To prevent spontaneous whisker movement, the animal was immobilized by pancuronium bromide, artificially respired through a tracheal cannula, and kept warm by a servo-controlled heating blanket. The rat was subsequently maintained in a lightly narcotized state by continuous infusion The costs of publication of this article were defrayed in part by the payment of page charges. The article must therefore be hereby marked ‘‘advertisement’’ in accordance with 18 U.S.C. Section 1734 solely to indicate this fact.
0022-3077/03 $5.00 Copyright © 2003 The American Physiological Society
2137
2138
S. TEMEREANCA AND D. J. SIMONS
of fentanyl (Sublimaze, Janssen Pharmaceuticals; ⬃10 g 䡠 kg⫺1 䡠 h⫺1). The condition of the animal was assessed using a computer program that continuously monitored electroencephalograms (EEGs), femoral arterial blood pressure, heart rate, respiration rate, and tracheal airway pressure, all of which remained within normal physiologic ranges throughout the experiments. At the termination of the recording session, small electrolytic lesions were made through the recording electrode. The animal was deeply anesthetized with pentobarbital sodium (Nembutal, 100 mg/kg iv) and perfused transcardially. Brain sections were subsequently cut in the coronal plane and processed for cytochrome oxidase (CO) histochemistry with Nissl counterstain. Sections were examined to confirm the location of the electrode tracks in VPm.
Multiunit activity (MUA) and local field potential (LFP) recordings Simultaneous LFP and MUA recordings were performed using low-impedance (400 k⍀ to 1 M⍀), stainless steel microelectrodes constructed from 250-m-diam stock and etched to a tip diameter of ⬃1.5 m (Frederick Haer, Brunwick, ME). The analog signal was first band-pass filtered at 1 Hz to 10 kHz and sent to secondary amplifiers having filter settings adjusted for LFP recordings (1–500 Hz) or MUA recordings (300 Hz to 10 kHz), respectively. The LFP signal was stored on disk via a D/A converter with a sample rate of 10 kHz. For some experiments, secondary amplifiers having fixed decade gains were employed to measure the absolute size of the signals (see Figs. 1 and 4). In most cases, the LFP amplifier was adjusted to maximize the amplitude of the LFP within the voltage range of the converter; Figs. 2 and 6 thus present data in arbitrary voltage units. For MUA, a time/amplitude window discriminator (BAK Electronics) was used to isolate multiunit potentials that had amplitudes at least two times larger than the noise level. Spikes and threshold levels were viewed on a digital oscilloscope. MUA was recorded as sequential spike event times with a resolution of 100 s. Recordings and on-line display of the LFP signal and MUA PSTHs were performed using custom software written in LabView (National Instruments, Austin, TX). During the experiment, VPm was identified electrophysiologically. The whisker that evoked the strongest MUA response, as determined with an audio monitor, was identified by means of a glass probe used to deflect individual whiskers manually. This whisker was designated the principal whisker (PW); immediately neighboring whiskers in the same row or arc were designated adjacent whiskers (AW). The topographic organization of PWs corresponded to the known anatomical organization of thalamic barreloids, and recording sites will hereafter be described in terms of the barreloid in which LFP and MUA data were obtained. Because of their complex three-dimensional organization, no attempt was made to identify recording sites histologically with respect to individual barreloids.
Whisker stimulation The PW, and in some experiments one AW within the same row, was deflected caudally using ramp-and-hold stimuli delivered through a piezoelectric stimulator (bimorph), constructed to produce highvelocity movements as described previously (Pinto et al. 2000). The whisker was inserted into a small (30 gauge) tube attached to the end of the stimulator and, using a ramp-and-hold waveform, was moved from its neutral, or resting, position at different velocities/accelerations and amplitudes. Deflections were maintained for 200 ms before return to the whisker’s neutral position. The stimulator was attached to the whisker 5 mm from the skin surface to produce deflection amplitudes similar to those of Pinto et al. (2000). Because of the small amplitudes of some of the stimuli, we attached the whisker to the stimulator so that it was immediately engaged by stimulus onset. Therefore in this study we will analyze in detail neuronal responses only to deflection onset. J Neurophysiol • VOL
In three experiments, the PW and several AWs were deflected at eight different directions using a ramp-and-hold deflection with the ramp velocity of ⬃125 mm/s and amplitude of 1 mm (Simons 1983). In these cases, the stimulator was attached to the whisker 10 mm from the skin surface to produce deflection amplitudes similar to those used previously in our laboratory to assess the directional tuning properties of individual thalamocortical neurons. Stimulus waveforms were generated digitally using LabView and output by an A/D converter at 10 kHz. The resonant frequency of the high-velocity bimorph stimulator was ⬃700 Hz. To avoid mechanical ringing, a digital fourth-order Bessel filter was used to attenuate high-frequency (⬎500 Hz) components in the stimulus waveforms. Two sets of stimuli were used. One consisted of three different deflection amplitudes (610, 340, and 160 m), each of which was delivered at five different velocities (accelerations) ranging from 20 mm/s (30 m/s2) to 200 mm/s (450 m/s2). The second set consisted of two deflection amplitudes (460 and 210 m), each of which was delivered at 10 velocities (accelerations) ranging from 10 mm/s (15 m/s2) to 100 mm/s (260 m/s2). Either one set or the other was employed for individual recording locations. Movement of the stimulator was calibrated at the outset of the study using a sensitive photo-diode circuit; data were recorded digitally at 10 kHz for subsequent detailed analysis (see following text). Initially, we designed the stimulus waveforms to produce deflection velocities that would be identical for different deflection amplitudes. Because of the inertial and other nonlinear properties of the piezoelectric stimulator, we found that the actual movement velocities varied with deflection amplitude. For example, movement velocities were slower than intended for the smallest amplitude deflections. Data analyses, including latency measures, will be described with reference to the actual movements of the stimulator obtained by D/A conversion of the photo-diode output. In preliminary experiments, we determined empirically that an average of 50 LFP traces provided a signal-to-noise ratio that was not noticeably improved by increasing the number of averaged trials. Therefore each stimulus was delivered 50 times with inter-stimulus intervals of 2 s. For each set, stimuli were delivered in pseudo-random order.
Data analysis Instantaneous velocities and accelerations were computed as the first and second derivative, respectively, of the recorded trajectories of the stimulator. For each stimulus, we also computed the maximum velocity and acceleration of the deflection and the average of the absolute values of instantaneous velocity and acceleration during different periods of time in 0.5-ms increments following deflection onset. Stimulus parameters were correlated with different measures of the LFP response. As described in the following text, the evoked LFP was a complex waveform consisting of multiple peaks, the most consistent of which was the initial negative phase (Figs. 1 and 3). We found that waveform components were best quantified by computing peak amplitude, duration, and total area under the curve. Because duration and area often changed together, we combined them into a single measure by computing the average voltage value during the duration of the wave. Hereafter, this measure is termed the “time-normalized LFP” (tLFP) with units of volts. These measures were applied to the early and late components of the waveform. Figure 2 is a graphical example of the response measurements that were employed in this study. The onset of the early component (2 in Fig. 2A) was taken as the time point preceding 10 consecutive negative-going (0.1 ms) bins; the voltage value of this point was subtracted from each point in the trace. The beginning of the late component (2nd 2 in Fig. 2B), which was longer in duration and more variable in onset time, was similarly identified using a criterion of 100 consecutive negative-going points.
89 • APRIL 2003 •
www.jn.org
STIMULUS-DEPENDENT SYNCHRONY IN THALAMIC BARRELOIDS
2139
RESULTS
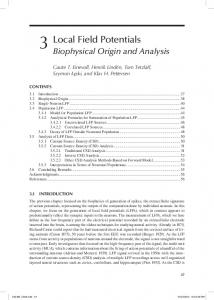
FIG. 1. Local field potential (LFP) recordings in the ventroposterior medial (VPm) nucleus of the thalamus. A–C: continuous signal from an individual trial with broad-band (1–10 kHz), multiunit activity (MUA; 0.3–10 kHz) and LFP (1–500 Hz) filtering, respectively. D and E: averages of 50 LFP and MUA traces. 1, stimulus onset; - - -, the peak of the average LFP. *, discriminated units.
Peak amplitudes of both the early and late components, which were always negative relative to the starting point, were measured as the difference between the voltage value at the onset time and the value at the minimum of the wave. The time-to-peak is the difference in time between wave onset and peak. The duration of the wave was taken as the time of return to the onset value. Multiunit recordings contained variable numbers of units, and therefore we did not analyze the magnitude of these responses. Multiunit data were used for qualitative comparison of overall spike patterns and different components of the LFP.
We recorded stimulus-evoked LFPs and MUA from 11 rats. Figure 1, top, shows data from an individual trial with broadband (1 Hz to 10 kHz), MUA (.3–10 kHz), and LFP (1–500 Hz) filtering. Averages of 50 LFP and MUA traces are shown in D and E. Whisker deflection evoked a pronounced negativity, occurring 4.3 ms after deflection onset, that is readily observed in the LFP average (E); a longer-latency, longer duration negativity in the LFP occurs 4.1 ms later. As illustrated here, responses can also be observed in some trials without averaging. However, LFP responses as in C were often small relative to noise, and in many individual trials, they were undetectable or identifiable only by reference to the time of the peak response in trial averages. The time-window discriminator distinguished five threshold events (*) in the MUA trace, one of which occurred at a time corresponding to the fasttransient in the average LFP. Averaged MUA traces (D) demonstrate that such rapid, stimulus-locked events contribute to the average LFP. These could represent a population spike consisting of near-synchronous neuronal firing. Figure 2 shows an average LFP waveform at two temporal scales. The waveform consists of an early, rapid negative wave followed by a late, slower negativity. Hereafter, these waves are denoted early and late components. Figure 3 shows representative examples of LFP and MUA responses to PW and AW deflections. As described previously (Pinto et al. 2000), thalamic neurons respond with temporally focused discharges to the onset and the offset of ramp-and-hold deflections. Over the range of velocity/acceleration parameters used, the time to peak of the early LFP component was 0.5– 4.2 ms, and its total duration was 1.2–7.5 ms. For the late component, both time to peak (5.1–92.3 ms) and duration (8.0 –120.0 ms) varied within a larger range. PW responses are larger than AW responses (see also following text). At higher temporal resolution (Fig. 3, B and D), it is evident that, as noted in the preceding text, the early component of the LFP is coincident with the MUA response. In MUA recordings, it is difficult to dissociate incoming fiber volleys from postsynaptic activity. However, single-unit data from recordings in which spike amplitudes of identified thalamocortical neurons were ⱖ10fold larger than background noise (Bruno and Simons 2002) indicate that spike latencies correspond closely (within a few 10th of a millisecond) to the onset of the LFP. The initial and most robust unit responses always occurred during the early component of the LFP, often followed by a slight pause and lower firing during the latter part of the transient response to stimulus onsets, as occurs for the MUA activity in Fig. 3. For a given recording site, LFP amplitudes varied depending
FIG. 2. Graphical representation of the measurements of LFP responses to whisker deflection onsets. A: Early component of the stimulus-evoked LFP. 2, the onset of the early component (see text); 1, its duration (see text). B: longer-time scale view comprising both early and late components, denoted by 2 and 1.
J Neurophysiol • VOL
89 • APRIL 2003 •
www.jn.org
2140
S. TEMEREANCA AND D. J. SIMONS
FIG. 3. Simultaneous MUA and LFP recordings in VPm in response to principal (PW) and adjacent (AW) whisker deflections. A: example of MUA and LFP recordings in response to PW deflections. The peristimulus time histogram (PSTH) and the corresponding LFP trace represent averages of 50 trials; bin width ⫽ 100 s. Stimulus waveforms are shown below. B: expanded view of the onset of the stimulus-evoked MUA and LFP in A that comprise the early, fast negative wave of the LFP. C: example of MUA and LFP recordings from the same location as in A but in response to AW deflections. D: expanded view as in B. The peak amplitude of the early component is significantly smaller in magnitude than that of the PW.
on the stimulated whisker and often on the direction of whisker deflection as well. Figure 4A shows average traces obtained at different depths in response to movements of four neighboring whiskers (gamma, C1, C2, and D1). Recording sites were spaced at 150 m intervals along a vertical electrode track through the physiologically defined C1 and gamma barreloids. At a depth of 4,750 m, the C1-evoked LFP consisted of
small-amplitude early and late components both of which increased in magnitude (depth ⫽ 5,050 m) and then disappeared over a total excursion of 600 m. At a depth yielding large C1 responses (5,050 m), deflections of the neighboring C2 whisker evoked only small amplitude early and late responses. At the same location, large-amplitude responses were also obtained by deflecting gamma and small responses were
FIG. 4. LFP amplitudes vary with the stimulated whisker and with the direction of its movement. A: average LFP traces recorded at different depths in a vertical penetrations passing through the C1 barreloid and into the gamma barreloid. Whiskers C2, C1, gamma, and D1 were deflected in the caudal direction. The figurine indicates whisker nomenclature, and the deflected whiskers are denoted as filled circles. B: polar plots of the early and late component LFP amplitudes obtained by deflecting whiskers in 8 different directions. All plots are made to the same scale, and the figurine in A serves as reference for their orientation.
J Neurophysiol • VOL
89 • APRIL 2003 •
www.jn.org
STIMULUS-DEPENDENT SYNCHRONY IN THALAMIC BARRELOIDS
evoked by D1; the gamma response became considerably smaller over a distance of 300 m. Interestingly, the late component of the gamma and C1 responses persisted over a larger distance. Traces in Fig. 4A were obtained by deflecting whiskers in the caudal direction only. Polar plots in B show amplitudes of the early and late LFP components evoked by whisker deflections in eight different directions. These examples illustrate that LFP response magnitude often varies with the direction of whisker movement. For 13 such plots, the early component response at the most effective direction was on average 1.39fold ⫾ 0.19 larger than responses averaged over all directions and 2.37-fold ⫾ 0.96 larger than the response at the least effective direction. For the late component, both measures of directional tuning were significantly smaller (max/mean ⫽ 1.26 ⫾ 0.08, t-test, P ⫽ 0.05; max/min ⫽ 1.63 ⫾ 0.18, t-test, P ⫽ 0.03) than those corresponding to the early component. Thus the thalamic field potential is sensitive to the direction of whisker movement and is most directionally tuned during the first 1.2–7.0 ms of the whisker-evoked response. For comparison, unit responses to the maximally effective direction are 1.80-fold larger than the mean for all deflection angles (Bruno and Simons 2002). This is consistent with the LFP representing activity of a population of VPm neurons. PW versus AW responses Four data sets included LFPs from one adjacent whisker in addition to the PW. Each data set consisted of LFPs obtained for 15 or 20 different stimuli varying in velocity/acceleration. For each recording location, early component peak amplitudes of AW responses were smaller in magnitude than those of the PW (paired t-test, P ⬍ 0.00001). On average, AW:PW ratios were 0.38 ⫾ 0.23 (mean ⫾ SD). The same relationship was observed for tLFP, but the difference was statistically significant for only three of four recording locations (AW:PW ratios ⫽ 0.46 ⫾ 0.36). Similar findings were obtained for the late component of the response, but results were less consistent. AW late components were smaller (paired t-test, P ⬍ 0.00001) for three of four recording sites, with AW:PW ratios of peak amplitudes and tLFP, respectively, of 0.48 ⫾ 0.14 and 0.48 ⫾ 0.17. For one location, AW values were larger than those for PW (paired t-test, P ⬍ 0.01). The difference in size between early and late response components was greater for PW AW deflections. LFP responses evoked by PW deflections exhibited smaller late:early ratios than AW responses, with significant differences in three of four recording locations (paired t-test, P ⬍ 0.0005). These findings indicate that the size of the late component is not proportional to the size of the early component. Overall, the early component was more consistent from one recording location to another, and differences between PW and AW responses were more pronounced. As described further in the following text, the early component also changed more systematically as a function of deflection velocity/acceleration. There were no consistent differences across recording sites between the time to peak and the duration of the early or late components for PW versus AW deflections. The average LFP onset latency to PW deflections was 3.3 ⫾ 0.5 (SD) ms, whereas the latency to AW deflections was 3.5 ⫾ 0.7 ms. For two recording locations, AW responses had significantly longer latencies than PW responses (paired t-test, P ⬍ 0.0002), J Neurophysiol • VOL
2141
whereas for one recording location, they were shorter than PW responses (P ⫽ 0.015). In the three cases, the latency differences were ⫹0.3, ⫹0.6, and ⫺0.2 ms, respectively. These results suggest that the earliest population responses to PW and AW deflections differ by no more than 1 ms. Together, the findings reported above show that PW versus AW responses are most reliably differentiated in VPm by the magnitude of the LFP response during the first 1.2–7.5 ms after its onset. Correlations of LFP response measurements with deflection velocity and acceleration LATENCY. On average, higher velocity deflections evoked slightly shorter latency responses than lower velocity deflections, with a value of 2.77 ⫾ 0.24 ms for the maximum velocity (200 mm/s) and a value of 4.05 ⫾ 0.65 ms for the minimum velocity (10 mm/s). Mechanoreceptors in the whisker follicle may have amplitude thresholds for whisker deflection that could in turn account for different response latencies with different deflection velocities. Higher velocity deflections would reach this hypothesized amplitude threshold faster than lower velocity deflections. To examine this possibility, we measured the time required for different deflections to attain amplitudes of 10, 20, 40, and 60 m, respectively. Plots of LFP response latencies versus such durations were created for each recording location, and linear regression analysis was used to fit a line through the data points. An example of one such plot is shown in Fig. 5, where the latencies of LFP responses recorded from one location were plotted versus durations computed for a 10-m amplitude threshold. The slope of the regression line was ⬎1 and the regression coefficient was 0.68 (P ⬍ 0.00001). As in this example, the critical amplitude was ⱕ20 m for all other recording sites and for both principal and adjacent whiskers. These results suggest that the velocity/ acceleration sensitivity of receptors in the whisker follicle has an amplitude threshold from rest of ⬍20 m for whisker deflections delivered ⬃5 mm from skin surface. Fig. 6A shows a representative example of early component LFP responses for different deflection velocities/ MAGNITUDE.
FIG. 5. Onset latencies of LFP responses to different velocity deflections from a single recording location plotted as a function of the time required for the stimulus to reach an amplitude of 10 m. Higher velocity deflections, associated with shorter times, evoked shorter latency responses. —, best fit using linear regression analysis.
89 • APRIL 2003 •
www.jn.org
2142
S. TEMEREANCA AND D. J. SIMONS
plots the mean R2 values obtained at 12 individual recording locations for peak LFP amplitude and deflection velocity acceleration computed over different time epochs after the onset of the whisker movement. For all epochs tested, acceleration strongly predicted peak LFP, with slopes statistically different from 0 (P ⬍ 0.01) and mean regression coefficients of 0.78 ⫾ 0.05 (mean ⫾ SE). Similar results were obtained for maximum acceleration, but at all time points, R2 values were smaller than values computed for average acceleration (paired t-test, P ⬍ 0.004). Measures of tLFP yielded virtually identical relationships. Compared with acceleration, measures of average velocity yielded smaller, though still significant, regression coefficients. Unlike acceleration, which strongly and uniformly predicted the LFP across all measurement epochs, R2 values for average velocity displayed a clear maximum, wherein the fit at time epochs of 1.0 –1.5 ms was as robust as that obtained for average acceleration (R2 ⫽ 0.82 ⫾ 0.04). Values of 1.0 –1.5 ms correspond to the time at which the bimorph, which has a resonant frequency of ⬃700 Hz (period ⫽ 1.4 ms), attains its fastest velocity. For periods up to this point, our method of
FIG. 6. Effect of deflection acceleration on LFP early component. A: responses recorded at a single location for 5 different deflection velocities/ accelerations. Response amplitudes decrease progressively with slower velocity/lower acceleration movements. B: plot of peak amplitudes depicted in A and others recorded from the same location vs. logarithmic values of average stimulus acceleration computed during the 1st 1.5 ms of the deflection ramp. Linear regression analysis indicates that acceleration strongly determines the magnitude of the LFP early component (R2 ⫽ 0.94, P ⬍ 0.00001).
accelerations. Higher velocity deflections evoked larger peak amplitude (and tLFP) responses. Regression statistics were used to identify stimulus parameters that best predicted the size of the early and late components measured as peak amplitude and tLFP. Stimuli were quantified in terms of velocity and acceleration maxima and velocity and acceleration averages. These averages were computed over different durations of the deflection ramp to a maximum of 3.5 ms; after 3.5 ms, values of velocity/acceleration were either 0 (because the ramp had ended) or were small (because the ramp slowly asymptotes to maximum amplitude). LFP response measures were regressed with logarithmic values of velocity and acceleration because preliminary examination of the data indicated that stimulusresponse relationships were nonlinear when velocity/acceleration values were used. Figure 6B presents an example of the analysis described in the preceding text. The peak amplitudes of the LFP responses depicted in Fig. 6A, and others not shown but recorded from the same location, were plotted as a function of average stimulus acceleration computed during the first 1.5 ms of the deflection ramp. The regression coefficient obtained in this case was 0.94 (P ⬍ 0.00001), indicating that acceleration strongly predicts response peak LFP amplitudes. Figure 7A J Neurophysiol • VOL
FIG. 7. Comparison of the effects of velocity and acceleration on peak amplitudes of early and late LFP components. Regression coefficients, averaged from 12 recording locations, were computed for deflection velocity and acceleration values averaged over different time epochs after the onset of the deflection ramp (see text for details). LFP response amplitudes were regressed with logarithmic values of velocity and acceleration, as in Fig. 6. Each data point represents the mean R2 value ⫾ SE. A: early component. B: late component.
89 • APRIL 2003 •
www.jn.org
STIMULUS-DEPENDENT SYNCHRONY IN THALAMIC BARRELOIDS
2143
measuring velocity characterizes the actual whisker movement as well as acceleration does and thus shows the closest correspondence with the biological response. As was the case for maximum versus average acceleration, regression coefficients for maximum velocity (R2 ⫽ 0.7 ⫾ 0.04) were smaller than those obtained for average velocity (paired t-test, P ⬍ 0.0001). The same relationships were observed for measures of the late response component (Fig. 7B), except that the correlation coefficients between stimulus and response parameters were smaller and more variable. The peak amplitude and the tLFP of the late component were weakly correlated with velocity (R2 ⫽ 0.53 ⫾ 0.07, P ⬍ 0.05, n ⫽ 8/12) and acceleration (R2 ⫽ 0.55 ⫾ 0.07, P ⬍ 0.05, n ⫽ 8/12) for some recording locations and not significantly correlated for others (P ⬎ 0.05, n ⫽ 4/12). TIME COURSE. Across recording sites, no consistent relationship was observed between any velocity/acceleration measures and the time to peak or duration of either the early or late response components. For the 1.5-ms epoch and early response component, weak correlations were observed for, at most, half of the recording sites (time-to-peak vs. acceleration, R2 ⫽ 0.48 ⫾ 0.25, P ⬍ 0.05; duration vs. acceleration, R2 ⫽ 0.42 ⫾ 0.13, P ⬍ 0.05). Similar results were obtained for the late component. Effect of deflection amplitude LFPs were insensitive to the final amplitude of the whisker deflection. Figure 8 shows plots of average tLFP as a function of both amplitude and logarithmic values of acceleration. Twoway ANOVAs were computed for five accelerations by the two amplitudes (340 and 610 m) for which accelerations spanned the full acceleration range. For both early (Fig. 8A) and late (Fig. 8B) component tLFP, responses were determined by deflection acceleration (P ⬍ 0.0002 and P ⬍ 0.04, respectively) not amplitude (P ⬎ 0.20). DISCUSSION
In this study, we recorded stimulus-evoked thalamic field potentials in response to principal and adjacent whisker deflections at different velocities/accelerations and amplitudes. We found that the first wave of the LFP, which lasts only 1.2–7.5 ms after response onset, strongly correlates with the velocity and acceleration of whisker deflection as well as with PW versus AW deflections. For each individual recording location, the peak amplitude of this wave and its tLFP (i.e., total magnitude divided by duration) highly predicted high- versus lowvelocity/acceleration deflections and PW versus AW deflections as determined using regression analyses and paired t-test. By contrast, the late, slower component of the response was at best only weakly correlated with deflection velocity and acceleration. Similarly, although the late component did exhibit differences in response magnitudes to PW versus AW deflections for most recording locations, these differences were smaller than those for the early component. LFP responses depended on both velocity and acceleration of the whisker deflection. A number of studies (e.g., Shoykhet et al. 2000; Zucker and Welker 1969) have described the velocity sensitivities of neurons at different levels of the whisker-to-barrel pathway, although none to date have examined the effects of acceleration. We found that, at all recording J Neurophysiol • VOL
FIG. 8. Effects of deflection amplitude on tLFPs of the early and late components. Average time-normalized LFP (mean ⫾ SE) were plotted as a function of both amplitude and logarithmic values of stimulus acceleration computed during the 1st 1.5 ms of the deflection ramp. Both early and late component responses were insensitive to the final amplitude of whisker deflection (see text). A: early component. B: late component.
locations, the size of the early LFP component was better predicted by deflection acceleration than velocity. Acceleration sensitivity appears to have a threshold from rest of 10 –20 m delivered ⬃5 mm from the skin surface. This corresponds closely to previous estimates of amplitude thresholds in primary afferent and cortical neurons (Simons 1978; Zucker and Welker 1969). The present findings indicate that the whisker/ barrel system is highly sensitive to rapid, small changes in the position of a vibrissal hair. Such sensitivity to fine, fast perturbations may underlie the ability of rats to detect subtly different textures with their whiskers (Carvell and Simons 1990; Guic-Robles et al. 1989). We also investigated the directional tuning of the thalamic LFP by recording neuronal responses to whisker deflections at different directions. Here we report that the LFPs are directionally tuned during the first 1.2–7.0 ms of the thalamic response and significantly less tuned during the latter part of the response. Our finding suggests that thalamic barreloid neurons are clustered with respect to their directional tuning properties and that they may encode the direction of whisker movement, like acceleration, by synchronous activity during the first few milliseconds of their response.
89 • APRIL 2003 •
www.jn.org
2144
S. TEMEREANCA AND D. J. SIMONS
Nature of the stimulus-evoked LFP responses The LFP is commonly thought to represent the dendritic and somatic activities of a population of cells within a volume of brain tissue. LFPs have been extensively studied in the cerebral cortex, where pyramidal cells having long apical dendrites running perpendicular to the cortical surface generate a relatively strong field potential due to their dipole-like anatomical and functional geometry. In thalamus, barreloid neurons have ellipsoid-like dendritic arbors, with soma, primary and secondary dendrites located in one barreloid, and thinner, tertiary dendrites sometimes extending into an adjacent barreloid (see Varga et al. 2002). The morphology of VB neurons and their nonlaminar organization would be expected to generate a relatively “closed” field potential (see Leung 1990; Lorente de No 1947), representing the neuronal activity of a smaller population of cells than those giving rise, for example, to LFPs evoked in the cerebral cortex. What, then, is the nature of the thalamic LFP and how local is it? LFPs are thought to be generated principally by postsynaptic potentials (see Purpura 1959). During synchronous firing, action potentials summing as “population spikes” are also likely to contribute. The nearly coincident onset of unit activity and LFPs suggests that the LFP signal is dominated by postsynaptic activity in VPm. This is consistent with the proximal locations of medial lemniscal synapses onto thalamocortical neurons (Spacek and Lieberman 1974; Williams et al. 1994); lemniscal inputs are characterized by fast-rising, large-amplitude excitatory postsynaptic potentials (EPSPs) that can reach firing threshold at short latencies (Brecht and Sakmann 2002; CastroAlamancos 2002a,b). Based on these electrophysiological data, we propose that the early component of the LFP, which lasts only 1.2–7.5 ms, represents initial, afferent excitation of barreloid neurons. EPSPs and, depending on the nature of the stimulus, synchronous action potentials contribute to this stimulus-evoked, fast negative wave. The more complex and variable late component of the LFP most likely corresponds to the combined effects of feedback inhibition from the thalamic reticular nucleus (Rt) and feedback excitation from the cerebral cortex (Mishima 1992). In vivo intracellular recordings have shown that barreloid neurons respond with an EPSP-inhibitory postsynaptic potential (IPSP) sequence or with only a delayed IPSP to afferent stimulation (Brecht and Sakmann 2002; Castro-Alamancos 2002b; Salt and Eaton 1990). Because VPm in the rat is virtually devoid of inhibitory interneurons (Barbaresi et al. 1986; Harris and Hendrickson 1987), the source of inhibition is synaptic input from Rt, which is made on both proximal and distal dendrites of barreloid neurons (see Peschanski et al. 1983). Corticothalamic inputs, which terminate on distal dendrites of thalamocortical cells (see Rouiller and Welker 2000), are excitatory and produce relatively long-lasting EPSPs, often accompanied at longer latency by IPSPs mediated by the thalamic reticular nucleus (Castro-Alamancos and Calcagnotto 2001; Eaton and Salt 1996; Kao and Coulter 1997). Low- and high-threshold Ca2⫹ currents are also likely to contribute to the late component (Jahnsen and Llinas 1984; Sherman 2001). Consistent with the preceding observations, we found that the size of the late component was not proportional to the size of the early component. Unlike the early component, which showed consistent, robust variations with stimulus parameters, the late J Neurophysiol • VOL
component exhibited weaker and more variable stimulus-response relationships. Interestingly, facilitation of corticothalamic activity has been shown to affect the late component of the whisker-evoked thalamic LFP (Temereanca and Simons 2001). During on-going whisker deflections, such influences may modulate thalamic firing synchrony evoked by lemniscal inputs. Our findings suggest that, at least in the case of the early component, the thalamic LFP reflects the activity of a group of neurons smaller than the population of an entire barreloid. LFPs were consistently larger for PW versus AW deflections and also varied with direction of whisker movement. Importantly, all of the LFPs showed a strong positive correlation between the magnitude of the early component and the velocity/acceleration of the stimulus. By contrast, individual single units either increase or decrease their firing rates with stimulus velocity, and strong correlations with deflection velocity are observed only for population measures derived from the combined responses of many barreloid neurons (Pinto et al. 2000). It is therefore unlikely that a few cells alone would generate LFPs that are highly predictive of deflection velocity as observed here. LFP recording may therefore be useful for assessing the conjoint activity of small populations of neurons, e.g., in mapping the representation of directional sensitivity throughout the three-dimensional structure of the barreloid. Firing synchrony as a code for sensory information in thalamus The size of the early component of the LFP increases with deflection velocity/acceleration but is unaffected by final deflection amplitude. These findings are strikingly similar to the relationship between initial thalamic population firing synchrony and whisker deflection velocity reported by Pinto et al. (2000). In their study, the investigators recorded single thalamic units, one at a time, using virtually the same stimuli used here. Thalamic population firing synchrony was inferred from summed PSTHs, and deflection velocity was found to be highly correlated with population firing rates during the first 2–7 ms of the response, a period virtually identical to the time course of the early LFP component. This relationship was found only for the population measure, not for the firing rates of individual neurons, whose stimulus-response relationships varied widely. Barrel circuitry is highly sensitive to population firing synchrony, and therefore barrel neurons fire most vigorously in response to high-velocity deflections of the PW. The present findings show that a similar code exists for distinguishing movement direction and deflection of principal versus adjacent whiskers. A larger magnitude of the LFP early component may reflect an increase in the number and/or amplitude of whisker-evoked lemniscal-mediated EPSPs and/or a decrease in both the onset latency of EPSP/spike generation and its variability. These factors would translate into a higher probability of any given barreloid neuron firing a short-latency, stimulus-locked action potential, thus producing high initial population firing synchrony. In rat and cat VPl, correlated firing over small time intervals (⬍5 ms) is observed among nearby thalamocortical neurons when cutaneous stimuli are applied to common regions of their receptive fields (Alloway et al. 1995), and synchronous thalamic events enhance cortical responsiveness (Roy and Alloway 2001). Similar mechanisms have been
89 • APRIL 2003 •
www.jn.org
STIMULUS-DEPENDENT SYNCHRONY IN THALAMIC BARRELOIDS
shown to operate in the geniculocortical system as well (Alonso et al. 1996; Usrey et al. 2000). The present study provides evidence for synchronous activity in VPm that is generated by neighboring barreloid neurons having overlapping receptive fields (i.e., the same PW). Shoykhet et al. (2000) showed that trigeminal ganglion neurons can encode whisker deflection velocity in their population firing rates during the first 2.0 ms of their response as well as in the distribution of their response latencies. Higher velocities were associated with both a higher response probability and shorter response latency. Our results predict that the same coding strategies are preserved in brain stem. Strong trigeminothalamic synapses (Castro-Alamancos 2002b) would ensure reliable transmission of information to the thalamus even if a single thalamic neuron were contacted by one or only a few afferent fibers (Alloway et al. 1994; Usrey et al. 1999). By contrast, cortical neurons are contacted relatively weakly by many thalamocortical neurons (Alonso et al. 1996; Bruno and Simons 2002; Roy and Alloway 2001; Swadlow 1995). Hence, thalamic firing synchrony is likely to play a critical role in sensory coding in the whisker-to-barrel pathway. We thank A. Myers for histological assistance. This work was supported by National Institutes of Health Grants IBN-19950 and MH-61372. REFERENCES Alloway KD, Johnson JI, and Aaron GB. A comparative analysis of coordinated neuronal activity in the thalamic vetrobasal complex of rats and cats. Brain Res 691: 46 –56, 1995. Alloway KD, Wallace MB, and Johnson MJ. Cross-correlation analysis of cuneothalamic interactions in the rat somatosensory system: influence of receptive field topography and comparisons with thalamocortical interactions. J Neurophysiol 72: 1949 –1972, 1994. Alonso J-M, Usrey WM, and Reid CR. Precisely correlated firing in cells of the lateral geniculate nucleus. Nature 383: 815– 819, 1996. Barbaresi P, Spreafico R, Frassoni C, and Rustioni A. GABAergic neurons are present in the dorsal column nuclei but not in the ventroposterior complex of rats. Brain Res 382: 305–326, 1986. Brecht M and Sakmann B. Whisker maps of neuronal subclasses of the rat ventral posterior medial thalamus, identified by whole cell voltage recording and morphological reconstruction. J Physiol 538: 495–515, 2002. Bruno RM and Simons DJ. Feedforward mechanisms of excitatory and inhibitory cortical receptive fields. J Neurosci 22: 10966 –10975, 2002. Carvell GE and Simons DJ. Biometric analyses of vibrissal tactile discrimination in the rat. J Neurosci 10: 2638 –2648, 1990. Castro-Alamancos MA. Properties of primary sensory (lemniscal) synapses in the ventrobasal thalamus and the relay of high-frequency sensory inputs. J Neurophysiol 87: 946 –953, 2002a. Castro-Alamancos MA. Different temporal processing of sensory inputs in the rat thalamus during quiescent and information processing states in vivo. J Physiol 539: 567–578, 2002b. Castro-Alamancos MA and Calcagnotto ME. High-pass filtering of corticothalamic activity by neuromodulators released in the thalamus during arousal: in vitro and in vivo. J Neurophysiol 85: 1489 –1497, 2001. Eaton SA and Salt TE. Role of N-methyl-D-aspartate and metabotropic glutamate receptors in corticothalamic excitatory postsynaptic potentials in vivo. Neuroscience 73: 1–5, 1996. Guic-Robles E, Valdivieso C, and Guajardo G. Rats can learn a roughness discrimination using only their vibrissal system. Behav Brain Res 31: 285–289, 1989. Harris RM and Hendrickson AE. Local circuit neurons in the rat ventrobasal thalamus—a GABA immunocytochemical study. Neuroscience 21: 229 – 236, 1987. Jahnsen H and Llinas R. Electrophysiological properties of guinea pig thalamic neurons: an in vitro study. J Physiol 349: 205–226, 1984. Kao CQ and Coulter DA. Physiology and pharmacology of corticothalamic stimulation-evoked responses in rat somatosensory thalamic neurons in vitro. J Neurophysiol 77: 2661–2676, 1997. J Neurophysiol • VOL
2145
Leung LWS. Field potentials in the central nervous system. In: Neurophysiological Techniques: Applications to Neural Systems, edited by Boulton AA, Baker GB, and Vanderwolf CH. Clifton, NJ: The Humana Press, 1990, p. 277–312. Lorente de No R. Action potential of the motoneurons of the hypoglossus nucleus. J Cell Comp Physiol 29: 207–287, 1947. Miller KD, Pinto DJ, and Simons DJ. Processing in layer 4 of the neocortical circuit: new insights from visual and somatosensory cortex. Curr Opin Neurobiol 11: 488 – 497, 2001. Mishima K. Facilitatory and inhibitory processes in the thalamic ventrobasal nucleus of the rat. Jpn J Physiol 42: 193–210, 1992. Paxinos G and Watson C. The Rat Brain in Stereotaxic Coordinates. San Diego, CA: Academic, 1998. Peschanski M, Ralston HJ, and Roudier F. Reticularis thalami afferents to the ventrobasal complex of the rat thalamus: an electron microscope study. Brain Res 270: 325–329, 1983. Pinto D, Brumberg JC, and Simons D. Circuit dynamics and coding strategies in rodent somatosensory cortex. J Neurophysiol 83: 1158 –1166, 2000. Pinto DJ, Brumberg JC, Simons DJ, and Ermentrout GB. A quantitative population model of whisker barrels: re-examining the Wilson-Cowan equations. J Comput Neurosci 3: 247–264, 1996. Pinto DJ, Hartings JA, Brumberg JC, and Simons DJ. Cortical damping: analysis of thalamocortical response transformations in the rodent barrel cortex. Cereb Cortex 13: 33– 44, 2003. Purpura DP. Nature of electrocortical potentials and synaptic organizations in cerebral and cerebellar cortex. Int Rev Neurobiol 1: 47–163, 1959. Rouiller EM and Welker E. A comparative analysis of the morphology of corticothalamic projections in mammals. Brain Res Bull 53: 727–741, 2000. Roy SA and Alloway KD. Coincidence detection or temporal integration? What the neurons in somatosensory cortex are doing? J Neurosci 21: 2462–2473, 2001. Salt TE and Eaton SA. Postsynaptic potentials evoked in ventrobasal thalamus neurons by natural sensory stimuli. Neurosci Lett 114: 295–299, 1990. Sherman SM. Tonic and burst firing: dual modes of thalamocortical relay. Trends Neurosci 24: 122–126, 2001. Shoykhet M, Doherty D and Simons DJ. Coding of deflection velocity and amplitude by whisker primary afferent neurons: implications for higher level processing. Somatosens Mot Res 17: 171–180, 2000. Sillito AM, Jones HE, Gerstein GL, and West DC. Feature-linked synchronization of thalamic relay cell firing induced by feedback from the visual cortex. Nature 369: 479 – 482, 1994. Simons DJ. Response properties of vibrissa units in the rat SI somatosensory neocortex. J Neurophysiol 41: 798 – 820, 1978. Simons DJ. Multi-whisker stimulation and its effects on vibrissa units in rat SmI barrel cortex. Brain Res 276: 178 – 82, 1983. Simons DJ and Carvell GE. Thalamocortical response transformation in the rat vibrissa/barrel system. J Neurophysiol 61: 311–330, 1989. Spacek J and Lieberman AR. Ultrastructure and three-dimensional organization of synaptic glomeruli in the rat somatosensory thalamus. J Anat 117: 487–516, 1974. Swadlow HA. Influence of VPm afferents on putative inhibitory interneurons in SI of the awake rabbit: evidence from cross-correlation, microstimulation, and latencies to peripheral sensory stimulation. J Neurophysiol 73: 1584 – 1599, 1995. Temereanca S and Simons DJ. Topographic specificity in the functional effects of corticofugal feedback in the whisker/barrel system. Soc Neurosci Abstr 27: 393.6, 2001. Usrey WM, Alonso JM, and Reid RC. Synaptic interactions between thalamic inputs to simple cells in cat visual cortex. J Neurosci 20: 5461–5467, 2000. Usrey WM and Reid RC. Synchronous activity in the visual system. Annu Rev Physiol 61: 435– 456, 1999. Usrey WM, Reppas JB, and Reid RC. Specificity and strength of retinogeniculate connections. J Neurophysiol 82: 3527–3540, 1999. Varga C, Sik A, Lavallee P, and Deschenes M. Dendroarchitecture of relay cells in thalamic barreloids: a substrate for cross-whisker modulation. J Neurosci 22: 6186 – 6194, 2002. Williams MN, Zahm DS, and Jacquin MF. Differential foci and synaptic organization of the principal and spinal projections to the thalamus in rats. Eur J Neurosci 6: 429 – 453, 1994. Zucker E and Welker WI. Coding of somatic sensory input by vibrissal neurons in the rat’s trigeminal ganglion. Brain Res 12: 138 –156, 1969.
89 • APRIL 2003 •
www.jn.org