Materials Science Forum Vols. 600-603 (2009) pp 163-166 online at http://www.scientific.net © (2009) Trans Tech Publications, Switzerland
Local-loading Effect in Low-temperature Selective Epitaxial Growth of 4H-SiC by Halo-carbon Method Hrishikesh Das1,a, Bharat Krishnan1,b, Galyna Melnychuk1,c, Yaroslav Koshka1,d 1
Mississippi State University, Mississippi State, MS, 39762, USA
a
[email protected],
[email protected],
[email protected], d
[email protected]
Keywords: selective epitaxial growth, SEG, low-temperature epitaxial growth, halo-carbon.
Abstract. In this work, the local-loading effect and its influence on the growth rate enhancement and the growth rate non-homogeneity is investigated during the halo-carbon low-temperature selective epitaxial growth (LTSEG) using an SiO2 mask. The average growth rate during the LTSEG can be more than three-times higher than in blanket epitaxy at the same growth conditions. Both the size of the LTSEG seed windows and the surrounding area covered with the mask determine the growth rate non-homogeneity. A model for predicting the growth rate distribution is suggested. Introduction Due to the high temperatures that are required for homoepitaxial growth of 4H- and 6H-SiC polytypes, the use of high-temperature masking materials was required for selective epitaxial growth (SEG) of 4H- or 6H-SiC [1,2]. SEG with SiO2 mask was attempted only for heteroepitaxial growth of the cubic 3C-SiC polytype on Si substrates conducted at low growth temperatures [3]. The method of low-temperature halo-carbon homoepitaxial growth of 4H-SiC epitaxial layers at temperatures down to and below 1300°C [4] made it possible to achieve low-temperature selective epitaxial growth (LTSEG) with SiO2 mask [5]. Significant enhancement of the growth rate in comparison to the blanket epitaxy was observed and attributed to the local-loading effect. Orientation-dependent degradation of the LTSEG morphology was observed to take place along the mesa edges oriented upstream with respect to the step-flow direction. In this work, the local-loading effect and its influence on the growth rate enhancement and the growth rate non-homogeneity is investigated. Experimental The halo-carbon epitaxial growth was conducted in a low-pressure hot-wall CVD reactor at 150 Torr and 13000C. Epilayers were grown on Si-faces of commercial 4H-SiC wafers. The mask for selective epitaxial growth (SEG) was formed by plasma-enhanced chemical vapor deposition (PECVD) of 1 µm-thick SiO2 layer followed by inductively coupled plasma (ICP) etching of the pattern defined by the standard photolithography. Seed windows shaped as long stripes aligned along different crystallographic directions were used to investigate the orientation dependence of the epitaxial layer growth morphology. In addition, masks with different feature sizes and different ratios of the area covered with the mask to the area of the SiC seed windows were used to investigate the influence of the loading effect. The thickness of the LTSEG mesas and thickness non-homogeneity across each mesa and among different mesas was measured with an optical profilometer. The thickness measurements were corroborated with thickness values extracted from the cross-sectional SEM. Planar-view and cross-sectional SEM techniques were used to evaluate edge defect generation.
All rights reserved. No part of contents of this paper may be reproduced or transmitted in any form or by any means without the written permission of the publisher: Trans Tech Publications Ltd, Switzerland, www.ttp.net. (ID: 130.18.64.89-14/08/08,17:33:46)
164
Silicon Carbide and Related Materials 2007
Results and Discussion
Growth rate, µm/hr
Growth rate, µm/hr
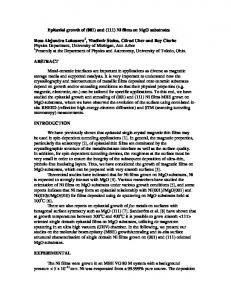
By conducting the low-temperature selective SiO2 epitaxial growth (LTSEG) at the same conditions as the regular blanket (non-selective) growth, a few-times increase of the growth rate (Rg) was Edge facets achieved, as was previously reported [5]. It was established that the growth rate increase was dependent on the LTSEG mask pattern. Specifically, patterns with smaller features of the seed windows 1 µm surrounded with larger areas covered with the mask experienced more significant increase in the value of Rg. mesa Cross-sectional SEM conducted on mesas having Fig. 1 Cross-sectional SEM of 5-µm-wide line grown in SiO2 window at 13000C. No relatively narrow width has not revealed any growth rate non-homogeneity is observed for detectable Rg non-homogeneity (e.g., 5-µm-wide this narrow dimension. However, the growth mesa shown in Fig. 1). Certain Rg non-homogeneity rate for this line is larger than for wider lines. could be detected by SEM in 50-µm-wide mesas, however the cross-sectional SEM characterization was unsuitable for larger mesas and could not provide sufficient statistics for reliable trend extraction. An optical profilometer was used to measure the Rg profile across multiple mesas having different dimensions. The growth rate was found to be non-homogeneous across the mesas. Due to the local loading effect, the highest growth rate was routinely observed at the edges of the mesas, and it gradually decreased away from the edges 3 (Fig. 2). As a result, the thickness in the 2.5 center of the mesas was smaller than at mesa d d d 2 edges for larger mesas. 1.5 It was also established that not only the size of the mesa (i.e., seed window) but also 1 the effective surrounding area covered with w1 w2 w3 0.5 the mask determined the Rg 0 non-homogeneity. Seed window lines 0 50 100 150 200 250 300 having equal width (w), with different Distance, µm spacing (di) between the windows were Fig. 2 Non-homogeneity of the LTSEG growth rate for investigated. The growth rate was found to seed window lines having different widths (wi), with be larger for the windows having larger equal spacing (d) between the windows. distance to the next closest window (Fig. 3). 3.5 Statistically, these trends are illustrated 3 in Fig. 4. Growth rate in the center of a seed 2.5 d1 d2 d4 d3 window is plotted versus a geometrical 2 factor calculated as an integral of the 1.5 distance from the center of the window to the window edges (i.e., combined distance 1 w w w w w to the border of the masking area serving as 0.5 the source of the additional supply of the 0 growth species due to the local-loading 0 100 200 300 400 500 Distance, µm effect). Clearly, the larger the integrated distance from the mesa center to the edges of Fig. 3 Non-homogeneity of the LTSEG growth rate for the mask the lower is the contribution of the seed window lines having equal widths (w), with local-loading effect at this point. However, different spacing (di) between the windows.
Materials Science Forum Vols. 600-603
165
Growth rate, µm/hr
different windows having the same geometrical 0.8 factors may have different magnitude of the local loading effect due to the different 0.7 surrounding area covered with the mask 0.6 (Fig. 4). 0.5 A tool for predicting the growth rate in presence of the local-loading effect for mesas of 0.4 arbitrary size, shape, and surrounding masking 0.3 area is required for employing the LTSEG 0.2 technique for device application. A model for 0.1 simulating the Rg distribution during LTSEG is currently under development. It includes a 0 simplified surface diffusion of ad-atoms, 0 50 100 ad-atom incorporation in the seed windows, as Integrated distance, arb.un. well as ad-atom desorption from the masked area where no nucleation takes place at our Fig. 4 Growth rate in the center of a LTSEG window as a function of an integrated distance to experimental conditions. It was established that for modeling the the window edges. The separate groups of windows shown have different geometry of the complex profiles shown in Fig. 1 and 2, in local SEG mask surrounding (different longeraddition to the shorter-range migration range component of the local-loading effect). component, an additional longer-range migration component of the local loading effect should be included. Speculatively, this component could be coming from the adatoms desorbed from the surface of the mask into the boundary layer, which can then diffuse in the boundary layer, get adsorbed back to the surface, and contribute to the growth at larger distances from the masked areas then in the case of the shorter-range surface migration. Two different types of diffusing species were included in the model. The "slow-diffusing" and "fast-diffusing" species account for shorter-range and longer-range migration components respectively. In its current form, the model is described by a system of differential equations:
d 2 n2 n2 n n = + 2 − 1 D2 * 2 τ g 2 τ des 2 τ conv1 dx
d 2 n1 n n n D1 * = 1 + 1 − 2 −G 2 τ conv1 τ des1 τ conv 2 dx
Mesa thickness, µm
where D1 and D2 are the diffusion constants for the species n1 and n2 respectively; n1 is the concentration of the "slow-diffusing" species, which are responsible for the shorter-range component of the local loading effect; n2 is the 0.5 concentration of the "fast-diffusing" species, 0.4 which are responsible for longer-range component of the local loading effect; τ conv1 is 0.3 the time constant of the reaction converting the 0.2 "slow-diffusing" species into the "fast-diffusing" species; τ des1 is the time 0.1 constant of the desorption of the 0 "slow-diffusing" species from the surface; -0.1 τ conv 2 is the time constant of a reverse reaction 0 100 200 300 converting the "fast-diffusing" species back Distance, µm into the "slow-diffusing" species; τ des 2 is the time constant of the desorption of the Fig. 5 Experimental (markers) and simulated (solid line) Rg line-scans for a portion of a LTSEG sample. "fast-diffusing" species from the surface; τ g 2 is 0 The growth was conducted at 1300 C for 15 min
the time constant of the surface reaction
166
Silicon Carbide and Related Materials 2007
responsible for the incorporation of the "fast-diffusing" species in the growing epitaxial layer; G is the flux supplying the "slow-diffusing" species towards the surface (i.e., in the boundary layer). The preliminary results of applying the new model for Rg simulation in LTSEG are shown in Fig. 5. In this simulation, only the longer-range component of the local loading effect was included. Good correlation between the experimental results and simulation can be observed for the simulated structure. The simulation results also confirmed the importance of the long-range migration from the mask surrounding. Including only the nearest surrounding in the simulation caused significant deviations from the experimental Rg profile. Summary Strong dependence of the growth rate on the ratio of the seed-window area to the surrounding masked area was established in this work. This suggests that the growth rate of the low-temperature halo-carbon growth at 13000C is predominantly mass-transport limited. The growth rate may strongly vary between the mesas of different dimensions as well as across a single (sufficiently large) mesa. By fitting the experimental data with the model for LTSEG, the short-range migration components of the local-loading process (tentatively attributed to the surface diffusion) and the longer-range migration component (tentatively attributed to the diffusion in the boundary layer) can be determined. This analysis will be reported elsewhere. The model is expected to help in predicting the growth rates and the growth rate non-homogeneity for an arbitrary structure, when the growth is conducted at identical processing conditions, which is critical for utilizing LTSEG in device applications. Acknowledgement This work was supported by the National Science Foundation, Grant No. ECS0622184. References [1] Y. Khlebnikov, I. Khlebnikov, M. Parker, T.S. Sudarshan, Journal of Crystal Growth 233 (2001) 112–120. [2] Y. Chen, T. Kimoto, Y. Takeuchi, H. Matsunami, Journal of Crystal Growth 237–239 (2002) 1224–1229. [3] J. H. Edgar, Y. Gao, J. Chaudhuri, S. Sheema, S. A. Casalnuovo, P. W. Yip, M. V. Sidorov, J. Appl. Phys., 84(1) (1998) 201-204. [4] Y. Koshka, H.D. Lin, G. Melnychuk, C. Wood, J. Cryst. Growth 294, 260 (2006). [5] B. Krishnan, H. Das, H.D. Lin, Y. Koshka, Appl. Phys. Let. 89, 262103 (2006).