Mar 4, 2003 ... BIOINFORMATICS. Vol. 19 no. 15 2003, pages 1945–1951. DOI: 10.1093/
bioinformatics/btg264. Local-pooled-error test for identifying.
Vol. 19 no. 15 2003, pages 1945–1951 DOI: 10.1093/bioinformatics/btg264
BIOINFORMATICS
Local-pooled-error test for identifying differentially expressed genes with a small number of replicated microarrays Nitin Jain1 , Jayant Thatte1 , Thomas Braciale1 , Klaus Ley1 , Michael O’Connell2 and Jae K. Lee1, ∗ 1 Hospital
West Complex, Rm. 3181, P.O. Box 800717, University of Virginia School of Medicine, Charlottesville, VA 22908, USA and 2 Insightful Corporation, 2505 Meridian Parkway Suite 175, Durham, NC 27713, USA
Received on October 31, 2002; revised on March 4, 2003; accepted on April 25, 2003
ABSTRACT Motivation: In microarray studies gene discovery based on fold-change values is often misleading because error variability for each gene is heterogeneous under different biological conditions and intensity ranges. Several statistical testing methods for differential gene expression have been suggested, but some of these approaches are underpowered and result in high false positive rates because within-gene variance estimates are based on a small number of replicated arrays. Results: We propose to use local-pooled-error (LPE) estimates and robust statistical tests for evaluating significance of each gene’s differential expression. Our LPE estimation is based on pooling errors within genes and between replicate arrays for genes in which expression values are similar. We have applied our LPE method to compare gene expression in naïve and activated CD8+ T-cells. Our results show that the LPE method effectively identifies significant differentialexpression patterns with a small number of replicated arrays. Availability: The methodology is implemented with S-PLUS and R functions available at http://hesweb1.med.virginia.edu/ bioinformatics Contact:
[email protected]
INTRODUCTION In a microarray study each gene’s differential expression pattern is usually assessed by (typically pairwise) contrasts of mean expression values among experimental conditions. Such comparisons have been routinely assessed as fold changes whereby genes with greater than two or three fold changes are selected for further investigation. However, a gene showing a high fold-change between experimental conditions might also exhibit high variability and hence its differential expression may not be significant. Similarly, a modest change in gene expression may be significant if its differential expression pattern is highly reproducible. ∗ To
whom correspondence should be addressed.
A number of authors have pointed out this fundamental flaw in the fold-change based approach (e.g. Jin et al., 2001). And, in order to assess differential expression in a way that controls both false positives and false negatives, the standard approach is emerging as one based on statistical significance and hypothesis testing, with careful attention paid to reliability of variance estimates and multiple comparison issues. The two-sample t-statistic is often used for testing each gene’s differential expression and the procedures such as the Westfall–Young step-down method have been suggested to control the family-wise error rate (FWER; Dudoit et al., 2002). These t-test and Westfall–Young approaches rely on reasonable estimates of reproducibility or within-gene error to be constructed, requiring a large number of replicated arrays. However, the reality is that since microarrays are expensive, and target RNA sample available is often limited, experiments are typically performed with a limited number of replicates. When a small number of replicates are available per condition, e.g. duplicate or triplicate, the use of naive, within-gene estimates of variability does not provide a reliable hypothesis testing framework. For example, a gene may have very similar differential expression values in duplicate experiments by chance alone. This can lead to inflated signal-to-noise ratios for genes with low but similar expression values. Furthermore, the comparison of means can be misled by outliers with dramatically smaller or bigger expression intensities than other replicates. As such, error estimates constructed solely within genes may result in underpowered tests for differential expression comparisons and also result in large numbers of false positives. A number of approaches to improving estimates of variability and statistical tests of differential expression have thus recently emerged. Several variance function methods have been proposed. Kamb and Ramaswami (2001) suggested a simple regression estimation of local variances; Nadon et al. (2001) used a smoothing-spline fit for standard error estimates on the mean log intensities; and Durbin et al. (2002)
Bioinformatics 19(15) © Oxford University Press 2003; all rights reserved.
Downloaded from https://academic.oup.com/bioinformatics/article-abstract/19/15/1945/231161 by guest on 17 November 2017
1945
N.Jain et al.
estimate a two-parameter variance function of mean expression intensity. Huang and Pan (2002) compared some of these variance estimation methods. Recently, Lin et al. (2003) suggested the use of data-adapted robust estimate of array error based on a smoothing spline and standardized local median absolute deviation (MAD). Their robust error estimation is similar to our local-pooled-error (LPE) estimation described below. The variance function methods described above borrow strength across genes in order to improve reliability of variance estimates in differential expression tests. This is conceptually similar to the SAM method of Tusher et al. (2001) and the empirical Bayes methods of Lönnstedt and Speed (2002) and Baldi and Long (2001). These methods also shrink the within-gene variance estimate towards an estimate including more genes, and construct signal-to-noise ratios using the shrunken variance in a similar fashion to the LPE test described below. We introduce LPE estimation for within-gene expression error, whereby variance estimates for genes are formed by pooling variance estimates for genes with similar expression intensities from replicated arrays within experimental conditions. The LPE approach leverages the observations that genes with similar expression intensity values often show similar array-experimental variability within experimental conditions (Lee, 2001); and that variance of individual gene expression measurements within experimental conditions typically decreases as a (non-linear) function of intensity (Lee, 2002; Lee and O’Connell, 2003). The LPE approach handles the situation where a gene with low expression may have very low variance by chance and the resulting signal-to-noise ratio is unrealistically large. The pooling of errors within local intensities shrinks such variances to the variance of genes with similar intensities.
LOCAL-POOLED-ERROR For oligonucleotide data e.g. Affymetrix® arrays, let xij k be the observed expression intensity at gene j for array k and sample i. As an initial exploratory plot of expression intensities, many analysts prefer to plot the log intensity ratio between arrays and within genes (Yang et al., 2002). For duplicate arrays, k = 1, 2, plots of M = log2 (xij 1 /xij 2 ) versus A = √ log2 xij 1 xij 2 , j = 1, . . . , J , can facilitate the investigation of between-duplicate variability in terms of overall intensity. For different samples or experimental conditions, i = 1, 2, √ plots of M = log2 (x1j k /x2j k ) versus A = log2 x1j k x2j k , j = 1, . . . , J , show differential expression between samples and within genes. The M versus A plot provides a very raw look at the data and is useful in detecting outliers and patterns of intensity variation as a function of mean intensity, whereas the log2 xij 1 versus log2 xij 2 plot sometimes gives the illusion of better reproducibility than is actually present (Yang et al., 2002). Note that expression intensities are frequently transformed as
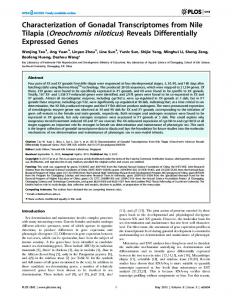
log base 2 in practice, which allows a natural interpretation of differential expression as fold changes and makes the rightskewed intensity distribution symmetric and closer to a normal distribution. While the log transformation enables a convenient interpretation of differential expression as fold changes, it is not a transformation that typically stabilizes variance. Figure 1 shows the log intensity ratio M = log2 (xij 1 /xij 2 ) between triplicate oligonucleotide arrays for each of three different RNA-sample conditions from a mouse immune-response study, which will be described in more detail later. As seen in this figure, the variability of log-intensity measurements in oligonucleotide microarrays decreases non-linearly as that gene’s mean expression intensity increases. This is due to in part common background noise at each spot of the microarray. At high levels of expression intensity this background noise is dominated by the expression intensity, while at low levels the background noise is a larger component of the observed expression intensity. The LPE is derived by first evaluating the baseline error distribution for each of the compared experimental conditions, say X and Y . For example, when duplicated arrays (X1 , X2 ) are used for condition X, the variance of M (= X1 − X2 and X2 −X1 ) on pre-determined quantiles (percentiles by default) of A [= (X1 + X2 )/2] is evaluated. Note that even though the expected value of M is zero, its estimated mean is often different from zero when only one of the differences X1 − X2 or X2 −X1 is used for variance estimation. However, the local mean is guaranteed to be zero if both differences are utilized. The estimated variance of M using both differences is slightly different from that using one of the two differences {by a factor of [(n − 1/2)/(n − 1)]}; we adjust by this factor in our variance estimation. When there are more than duplicates, all pairwise comparisons of (M, A) are pooled together for such estimation. Then a smooth local regression curve is fit to the variance estimates on the quantiles (Fig. 1). The baseline error distribution for condition Y is similarly derived. Thus, each baseline-error distribution is derived in two steps from all the replicated arrays under each condition: (1) estimation of error of M within quantiles of A (containing equal numbers of genes) and (2) non-parametric regression fit to the quantile error estimates. This two-stage error estimation approach is adopted because direct non-parametric estimation often leads to unrealistic (small or large) estimates of error when only a small number of observations are available at a fixed-width intensity range. In Figure 1 we also show the quantile estimates and the smooth-estimated LPE variance functions for the three cases of the mouse immune-response study.
TESTS FOR DIFFERENTIAL EXPRESSION We evaluate the significance of our LPE statistics as follows. First, each gene’s medians under the two compared conditions
1946
Downloaded from https://academic.oup.com/bioinformatics/article-abstract/19/15/1945/231161 by guest on 17 November 2017
LPE test for gene identification
(a)
(b) 2.0
2.0
1.5
1.5
1.5
1.0
1.0
1.0
0.5
0.5
0.5
0.0
0.0 0
5
10
15
0.0 0
5
10
15
6
6
4
4
4
2
2
2
0
M
6
M
M
(c)
2.0
0 -2
-2
-4
-4
-4
-6
-6
-6
5
10
15
0
A
5
10
15
A
5
0
5
10
15
10
15
0
-2
0
0
A
√ Fig. 1. Log intensity ratio log2 (Xij 1 /Xij 2 ) (M) as a function of average gene expression log2 xij 1 xij 2 (A). Top row of panels (a), (b) and (c) represent local pooled error (LPE) for naïve, 48 h activated, and T-cell clone D4, respectively. Variance estimates in percentile intervals are shown as points, and smoothed curve superimposing these points is also shown. Bottom row of panels represent corresponding M versus A graph. The horizontal line represents identical expression between replicates.
are calculated. The approximate normality of medians (or any order statistics) is obtained as: Lemma. If {Y(k) }nk=1 are the order statistics of a random sample {Xi }ni=1 , from a distribution F (or density function f ), then Y(k) is asymptotically distributed as a normal distribution with mean ξ and variance [pξ (1 − pξ )]/[nf 2 (ξ )], where ξ = F −1 (pξ ) and pξ = k/(n + 1) (Mood et al., 1974). This normal approximation can be generally justified with a large number of replicates. However, the normality of our LPE statistics is satisfied with a small number of replicates if the individual log-intensity values within a local intensity range follow a normal distribution. (Refer to our supplemental data at our web site for local normality of array data; http://hesweb1.med.virginia.edu/bioinformatics/.) Note also that the LPE test is different from a non-parametric median test, which typically has a low statistical power in small sample cases (David, 1981). The LPE statistic for the median (log-intensity) difference is then calcuated as: Med1 − Med2 z= , σpooled
where Medi , i = 1, 2, is the median intensity of the ith sample; 2 σpooled =
π 2 [σ (Med1 )/n1 + σ22 (Med2 )/n2 ], 2 1
where n1 and n2 are number of replicates in the two array samples being compared; σi2 (Medi ), i = 1, 2, is the estimate of variance of X (or Y ) from the ith LPE baseline-error distribution at each median log-intensity Medi . The constant π/2 is obtained if ξ and f in the above lemma are replaced by median and the standard normal density function. Note that this constant is a fixed value regardless of array data sets, and is different from the variance stabilizing factor of Tusher et al. (2001), which needs to be calculated for each data set. We evaluate our LPE statistics slightly differently when only duplicated arrays are available because medians are the same as means and our test statistic is not as robust. In this case the LPE test becomes a sample-mean-based z-test, so that the scaling factor π/2 for the pooled variance is not needed. Also, because this significance evaluation can be considerably affected by an outlier, we use an LPE-based test for outlier detection, comparing X1 − Y1 versus X2 − Y2 and X1 − Y2 1947
Downloaded from https://academic.oup.com/bioinformatics/article-abstract/19/15/1945/231161 by guest on 17 November 2017
MICORARRAY STUDY OF T-CELL IMMUNE RESPONSES Cytotoxic T-cells play a central role in the pathophysiology of many inflammatory lung diseases wherein they accumulate in the alveolar space and/or in the interstitium. Especially, Cytotoxic CD8+ T-cells function primarily in the clearance of virus infections (Lukacher et al., 1986). Analysis of migration and
0.8 0.2
0.4
power
0.6
LPE (3 rep) LPE (5 rep) WY (3 rep) WY (5 rep) ttest (3 rep) ttest (5 rep)
0.0
versus X2 − Y1 for their consistency. Genes that show significant differences in any of these comparisons are flagged. Note that if no replicated arrays are available, our LPE and any other statistical tests mentioned above cannot be applied. We make a p-value adjustment for our LPE statistics to control the FWER or false discovery rate (FDR) under a desired level (e.g. Lin et al., 2003). FWER may be controlled using a single-step Bonferroni adjustment or a step-down procedure such as those described in Hochberg (1988) and Westfall and Young (1993). The FDR may be controlled by adjustments described in Benjamini and Hochberg (1995). In order to compare the performance of LPE and other methods, such as the Bonferroni adjusted t-test and Westfall– Young procedure, we conducted a simulation study. In this simulation a random sample of size 50 000 genes was generated from normal distributions using the means and estimated variances of the genes in the immune-response study described below (specifically, CD8+ T-cell clone condition). The second random sample of 50 000 genes was generated similarly, but adding two fold-change expression as compared to the corresponding genes in the first random sample. Three and five replicates of each of these genes were generated for our testing (so, 150 000 or 250 000 random numbers in each of the two comparing conditions). We evaluated the power of our LPE-test (Bonferroni adjusted), two-sample t-test (Bonferroni adjusted), and Westfall– Young permutation procedure (FWER adjusted) for the cases with three and five replicates on varying intensity ranges. As shown in Figure 2, the Westfall–Young and t-tests could identify few significant genes with three replicates, whereas the LPE test’s power rapidly converges to one in the high intensity region. The LPE power curve also shows a significantly better performance than the others with five replicates. Thus, our LPE test achieves a statistical power close to one rapidly in both three- and five-replicate cases. Note that this simulation setting is more favorable to the two-sample t-test than to the LPE test because there are no extreme outliers, which can be eliminated only by the LPE test. We also note that we do not present ROC curves as simulation summaries because a full range of the cutoff criteria of these tests cannot be obtained with a small number of replicates, which is the main goal of our simulation investigation. For example, Westfall–Young’s (permutation-based) p-values of many differentailly expressed genes exceeded and were thresholded at one.
1.0
N.Jain et al.
0
5
10
15
intensity (log base 2)
Fig. 2. Power of LPE-test (Bonferroni-adjusted), two-sample t-test (Bonferroni-adjusted), and Wesfall–Young permutation procedure (FWER adjusted) to detect a two-fold change and p-value ≤ 0.05 based on a simulation study with 50 000 genes with three or five replicates.
retention of CD8+ T-cells in the lungs suggests that the process is dependent on the activation status of the adoptively transferred T-cells (Hafezi-Moghadam and Ley, 1999). In this study, triplicate microarrays of Affymetrix® murine chip, MG-U74vA, containing 12 488 genes were used to investigate each of the three populations of immune exposure: naïve (no exposure), 48 h activated, and CD8+ T-cell clone D4 (longterm mild exposure). Signal intensity values were obtained from the Affymetrix’s MicroArray Suite software (MAS 5.0). Figure 3 shows the genes exhibiting significant differential expression patterns by the LPE test, displaying their fold change values. Many of these genes are well-known for their functions in the literature of mouse immune response [see Hafezi-Moghadam and Ley (1999) and references therein]. The Westfall–Young test and the two-sample t-test were not able to identify many of the differentially expressed genes that were detected by the LPE method. Many interesting and important genes were identified by our LPE test: L-Selectin is known to be down-regulated by activation and was found significantly reduced in D4 clones as well as 48 h activated cells. CD44 and IL-2 were lower in naïve and D4 cells compared to 48 h activated cells (refer to our web site for the list of other interesting targets). Figure 4(a) shows a plot between p-values and fold change for naïve mice sample and CD8+ T-cell D4 clone. The two horizontal lines represent two fold changes in both directions and the vertical line the Bonferroni-adjusted LPE p-value
1948
Downloaded from https://academic.oup.com/bioinformatics/article-abstract/19/15/1945/231161 by guest on 17 November 2017
LPE test for gene identification
(a)
(b)
2
1
(c)
2
1
2
1
f.c. Naive cells -t48 cells
f.c. t48-Naive cells
5
0 L-Selectin CCR2
-5
3
4
-5
0
5
f.c. D4 clones-Naive cells
f.c. Naive cells-D4 clones
CCR7
5
0 CD44
-5
IL-2 3
4
-5
0
5
f.c. D4 clones-t48 cells
5
0 CXCR3
-5
CCR5 3
4
-5
0
5
f.c. t48 cells-D4 clones
Fig. 3. Fold change of gene expression for three different CD8+ T-cells, naïve, 48 h activated, and T-cell clone D4. All the genes were selected with Bonferroni-adjusted p-value ≤ 0.05 and at least 2-fold change. In all the three panels, X and Y axes are log base 2 transformed. The horizontal and vertical dotted lines mark the boundary of 2-fold change. Concordant changes in gene expression are in the first and third quadrant, discordant in second and fourth. Quadrant numbers are marked in the respective quadrants. Differential expression patterns of some well-known genes are marked.
0.05. The numbers of genes in each sector of the left panel are also shown. Note that the two RNA samples—naïve and CD8+ T-cell clone are biologically quite heterogeneous, and a large number of differentially expressed genes were identified both by LPE test and fold change. In this figure a weak correlation is found between significant differential expression and fold changes, which shows differential-expression discovery based on fold-change alone is misleading because a large number of insignificant genes are identified with high fold-changes in the low intensity region as displayed with the blue color in Figure 4(b).
DISCUSSION Gene discovery based solely on fold change is often misleading due to different error variances under different biological conditions and/or on different intensity ranges of microarray expression. Several statistical methods for evaluating differential gene expression have been suggested using within-gene variance estimates from replicated arrays (Kerr and Churchill, 2001; Dudoit et al., 2002). However, these within-gene-error methods have poor statistical properties in low replicate experiments because within-gene variance estimates are unreliable due to the small number of replicate arrays. Our LPE estimation overcomes this limitation by borrowing strength from genes in local intensity regions for estimation of array error variability. Variance estimation is based on a two-step procedure—estimation of local error within quantile ranges of average intensities, and non-parametric smoothing. Note that the LPE variance is estimated accurately within intensity quantiles and that our LPE statistic has an approximate normal distribution within these quantiles.
We investigated the effects of subinterval granularity and found that when the number of intervals was reduced from 100 to 50, only three genes were changed among the top 100 genes identified. However, when the number of subintervals was reduced to 10 or to 1 (the global error estimate), this resulted in quite different lists of significant genes. Note that the number of subintervals is an option that can be freely chosen in our software. Our LPE approach is part of an emerging literature that attempts to improve estimates of variability and statistical tests for differential expression. This literature includes the variance function methods of Kamb and Ramaswami (2001), Nadon et al. (2001), Durbin et al. (2002) and Lin et al. (2003). Also, the methods of Tusher et al. (2001) Lönnstedt and Speed (2002), Baldi and Long (2001), and Newton et al. (2001) which shrink the within-gene variance estimate towards an estimate including more genes, and construct signal-to-noise ratios using the shrunken variance, are similar in spirit to our LPE test. In our simulation study, when there are only three replicates available, the two-sample t-test and the Westfall–Young’s permutation-based test were found to identify few genes with 2-fold changes, while our LPE test showed a dramatically higher power in detecting these differentially expressed genes. Even with five replicates, the other tests failed to identify differentially-expressed genes in most cases. More extensive simulation studies are in progress by using non-Gaussian distributions and/or by adding certain outliers. We currently use median-based LPE statistics, which are effective in eliminating a large proportion of outliers. A more general family of robust statistics, such as M-estimators is worth investigating. In a preliminary investigation we found
1949
Downloaded from https://academic.oup.com/bioinformatics/article-abstract/19/15/1945/231161 by guest on 17 November 2017
N.Jain et al.
(b) 6
6
(a)
757
7755
1768
718
1207
2 0
log2(Fold Change)
-6
-4
-2
0 -6
-4
-2
log2(Fold Change)
2
4
4
283
0
10
20
30
0
-log2(LPE p-value)
5
10
15
A
Fig. 4. Fold change (log2 ) of gene expression and LPE p-values (− log2 ) for naïve mice sample and CD8+ T-cell D4 clone (left panel). The two horizontal lines mark the 2-fold change threshold and the vertical line marks the threshold of cutoff Bonferroni-adjusted p-value = 0.05. Genes shown in green color undergo low fold change but changes are significant—these genes are missed by fold change method alone. Genes shown in blue color have high differential expression but are not significant and would be detected as false positives by a fold change method. Right panel shows the distribution of genes in M versus A format. There is no clear-cut relation between significant and high fold-change genes, and hence LPE is required for such differentiation. Numbers shown in each sector of left panel represent the number of genes in that sector.
that our LPE test performs similarly to several M-estimators, such as Huber, Hampel, and Tukey tests (e.g. Hampel et al., 1986). For convenience we here showed our results based on a Bonferroni-adjusted p-values for controlling the FWER. Such a Bonferroni-adjustment is most valid if all the candidate genes are independent. This is unlikely in microarray data because many genes are believed to be loosely or tightly co-regulated. In extensive simulations we found the actual FWER by the Bonferroni-adjusted t-test to be (0.011–0.023) compared to the desired FWER 0.05 under various compound-symmetry correlation models (Jung and
Lee, submitted). From this and other studies the Bonferroniadjustment has been found to be conservative for discovering differentially expressed genes in microarrays. An adjustment based on ‘false discovery rate (FDR)’ αf , which controls the rate of false observations among all significant observations, may be more appropriate for genome-wide screening of microarray experiments (Storey and Tibshirani, 2003; Benjamini and Hochberg, 1995). This investigation is in progress. We note that even though we did not describe our LPE approach here for two-color-based cDNA microarrays, this method can be similarly applied for cDNA microarray data
1950
Downloaded from https://academic.oup.com/bioinformatics/article-abstract/19/15/1945/231161 by guest on 17 November 2017
LPE test for gene identification
after careful within-array normalization in suitable designed experiments.
ACKNOWLEDGEMENTS We greatly thank for the reviewers’ and the associate editor’s comments, which helped us to improve our manuscript significantly. This study was partially supported by the American Cancer Society grant RSG-02-182-01-MGO.
REFERENCES Baldi,P. and Long,A.D. (2001) A Bayesian framework for the analysis of microarray expression data: regularized t-test and statistical inferences of gene changes. Bioinformatics, 17, 509–519. Benjamini,Y. and Hochberg,Y. (1995) Controlling the false discovery rate: a practical and powerful approach to multiple testing. J. R. Stat. Soc. Ser. B: Methodological, 57, 289–300. David,H.A. (1981) Order Statistics. Wiley, New York. Dudoit,S., Yang,Y.H., Callow,M.J. and Speed,T.P. (2002) Statistical methods for identifying differentially expressed genes in replicated cDNA microarray experiments. Statistica Sinica, 12, 111–139. Durbin,B. Hardin,J., Hawkins,D. and Rocke,D. (2002) A variancestabilizing transformation for gene-expression microarray data. Bioinformatics, 18(Number Supplemental 1), S105–S110. Hafezi-Moghadam,A. and Ley,K. (1999) Relevance of L-selectin shedding for leukocyte rolling in vivo. J. Exp. Med., 189, 939–947. Hampel,F.R., Ronchetti,E.M., Rousseeuw,P.J. and Stahel,W.A. (1986) Robust Statistics: The Approach Based on Influence Functions. Wiley, New York. Hochberg,Y. (1988) A sharper Bonferroni procedure for multiple tests of significance. Biometrika, 75, 800–802. Huang,X. and Pan,W. (2002) Comparing three methods for variance estimation with duplicated high density oligonucleotide arrays. Funct. Integr. Genomics, 2, 126–133. Jin,W., Riley,R.M., Wolfinger,R.D., White,K.P., Passador-Gurgel,G. and Gibson,G. (2001) The contributions of sex, genotype and age to transcriptional variance in Drosophila melanogaster. Nature Genet., 29, 389–395. Kamb,A. and Ramaswami,A. (2001) A simple method for statistical analysis of intensity differences in microarray-derived gene expression data. BMC Biotechnol., 1–8. Kerr,M.K. and Churchill,G.A. (2001) Statistical design and the analysis of gene expression microarray data. Genet. Res., 77, 123–128.
Lee,J.K. (2001) Analysis issues for gene expression array data. Clin. Chem., 47, 1350–1352. Lee,J.K. (2002) Discovery and validation of microarray gene expression patterns. LabMedica Int., 19, 8–10. Lee,J.K. and O’Connell,M. (2003) An S-PLUS library for the analysis of differential expression. In Parmigiani, G., Garrett, E.S., Irizarry, R.A. and Zeger, S.L. (ed.), The Analysis of Gene Expression Data: Methods and Software. chapter 7, Springer, Berlin. Lin,Y., Nadler,S.T., Attie,A.D. and Yandell,B.S. (2003) Adaptive gene picking with microarray data: detecting important low abundance signals. In Parmigiani, G., Garrett, E.S., Irizarry, R.A. and Zeger, S.L. (ed.), The Analysis of Gene Expression Data: Methods and Software. chapter 13, Springer, Berlin. Lönnstedt,I. and Speed,T.P. (2002) Replicated microarray data. Statistica Sinica, 12, 31–46. Lukacher,A.E., Morrison,L.A., Braciale,V.L. and Braciale,T.J. (1986) T Lymphocyte Function in Recovery from Experimental Viral Infection. The Rockefeller University Press, New York, p. 233. Mood,A.M., Graybill,F.A. and Boes,D.C. (1974) Introduction to the Theory of Statistics. 3rd ed. McGraw-Hill, New York. Nadon,R., Shi,P., Skandalis,A., Woody,E., Hubschle,H., Susko,E., Ramm,P. and Rghei,N. (2001) Statistical inference methods for gene expression arrays. Proceedings of SPIE, BIOS 2001, Microarrays, Optical Technologies and Informatics, pp. 46–55. Newton,M.A., Kendziorski,C.M., Richmond,C.S., Blattner,F.R. Tsui,K.W. (2001) On differential variability of expression ratios: improving statistical inference about gene expression changes from microarray data. J. Comput. Biol., 8, 37–52. Storey,J. and Tibshirani,R. (2003) SAM thresholding and false discovery rates for detecting differential gene expression in DNA microarrays. In Parmigiani, G., Garrett, E.S., Irizarry, R.A. and Zeger, S.L. (ed.), The Analysis of Gene Expression Data: Methods and Software. chapter 12, Springer, Berlin. Tusher,V., Tibshirani,R. and Chu,C. (2001) Significance analysis of microarrays applied to transcriptional responses to ionizing radiation. Proc Natl Acad. Sci. USA, 98, 5116–5121. Westfall,P.H. and Young,S.S. (1993) Resampling-Based Multiple Testing: Examples and Methods for P -value Adjustment, Wiley, NY. Yang,Y.H., Buckley,M.J., Dudoit,S. and Speed,T.P. (2002) Comparison of methods for image analysis on cDNA microarray data. J. Comput. Graphical Stat., 11, 108–136.
1951
Downloaded from https://academic.oup.com/bioinformatics/article-abstract/19/15/1945/231161 by guest on 17 November 2017