Local Stereo Matching with 3D Adaptive Cost Aggregation for Slanted Surface Modeling and Sub-pixel Accuracy Yilei Zhang University of Alberta
[email protected]
Minglun Gong Memorial Univ. of Newfoundland
[email protected]
Abstract This paper presents a new local binocular stereo algorithm which takes into consideration plane fitting at the per-pixel level. Two disparity calculation passes are used. The first pass assumes that surfaces in the scene are fronto-parallel and generates an initial disparity map, from which the disparity plane orientations of all pixels are extracted and refined. In the second pass, the cost aggregation for each pixel is conducted along the estimated disparity plane orientations, rather than the fronto-parallel ones. Large window size with adaptive support weights is used to ensure the effectiveness of the slanted surface modeling. The disparity search space is also quantized at sub-pixel level to improve the accuracy of the disparity results. The experimental results demonstrate the validity of our presented approach.
1
Introduction
The binocular stereo matching problem has been extensively studied in the past few decades because of its many applications. As well, the evaluation method popularized by Scharstein and Szeliski [3] has also contributed to the increase in attention to this problem. Optimization techniques used in stereo matching algorithms can be classified into global and local optimization. Although global optimization methods in general give better results than local ones, the speed and parallelism advantage of local techniques keeps research in local techniques thriving. Among all the local stereo algorithms, the ones based on adaptive-weight cost aggregation [5, 7] give the best performance. Conventional adaptive-window cost aggregation techniques focus on varying the size, shape, and position of the support window, whereas the adaptive-weight method [7] uses a large fixed-size support window and assigns a support weight to each pixel in the window. The weight is calculated based on Gestalt Principles, which state that the grouping of pixels should be based on spatial proximity and chromatic similarity. The segment-based adaptiveweight method [5] improves upon the original adaptive-weight approach by first applying color
978-1-4244-2175-6/08/$25.00 ©2008 IEEE
Yee-Hong Yang University of Alberta
[email protected]
segmentation, then assigning full support weights to pixels in the same segment with the pixel of interest. These adaptive-weight techniques are computationally intensive, since the window must be big enough for the aggregation to be effective. Nevertheless, due to parallelism, these methods can be speeded up if ported to programmable graphics hardware [1, 8]. According to the Middlebury stereo evaluation site [9], the best among all stereo algorithms are based on disparity plane fitting [2, 6]. These approaches first over segment the image into small homogeneouslycolored regions, then apply plane-fitting technique to find candidate disparity planes for each segment. The optimal disparity plane assignment is determined using either local [4] or global [2, 6] optimization. Since the fitted disparity planes naturally provide sub-pixel disparity values, the scene can be reconstructed at a much finer level. Inspired by both categories of algorithms, we hereby propose a new local stereo approach, which introduces per-pixel non-fronto-parallel disparity plane modeling and performs adaptive-weight cost aggregation in 3D cost volume along slanted planes.
2
The proposed algorithm
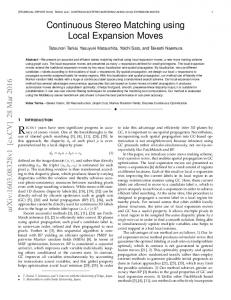
The workflow of the proposed algorithm is described in Figure 1. In the first pass, the algorithm computes an initial disparity map using a GPU-based adaptive-weight stereo matcher [1]. Then, a disparity plane orientation (DPO) image which encodes the gradient of the disparity plane at each pixel is extracted using a simple least squares fitting approach. With estimated per-pixel DPO information, a new 3D adaptive cost aggregation approach is used in the second pass for generating disparity results at sub-pixel accuracy. Finally, to refine the result, the disparity maps obtained for the two views are cross-checked to remove inconsistent disparity values, which are later filled-in using a DPO-based hole-filling approach. Due to space limit, we refer the readers to [1] for the details of the first step. The remaining steps are discussed in the rest of this section. The experimental results are presented and discussed in section 3. Then we conclude the paper in section 4.
When E is the minimum, we have 2
,
,
,
,
,
0 (4)
So
can be calculated as:
, , ∑
,
,
∑
,
∑
,
,
(5)
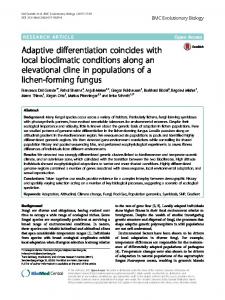
Vertical gradient is computed similarly. , Figure 2 illustrates the generated DPO image, which keeps the horizontal and vertical gradient values in the red and green channels respectively.
Figure 1. Workflow diagram of the proposed algorithm, with the input data, intermediate and final results.
2.1 Disparity plane orientation generation The DPO image is essential to our proposed method since it encodes the gradient of the chosen disparity plane at each pixel location, which is later used in the final disparity computation. To simplify the calculation, here we ignore the foreshortening effect and assume that a plane in 3D world can be modeled by a plane in the 3D disparity space. The orientation of a given disparity plane is specified using the horizontal and vertical gradients , in the disparity space, where ,
,
,
,
,
(1)
and , is the unknown ground truth disparity map. and from inaccurate disparity To estimate map , obtained, a simple least squares fitting , , method is applied. For example to compute we want to find a horizontal line that passes through , and gives the smallest weighted squared error. The weighted squared error between the data and the fitting straight line is defined as: ,
,
,
Figure 2. Left: the raw disparity result with GPU implementation; middle: DPO image generated from the raw disparity result; right: ground truth DPO image.
2.2 3D adaptive cost aggregation with subpixel accuracy The original adaptive-weight cost aggregation approach assumes all surfaces in the scene are frontoparallel and aggregates matching costs within the 2D constant disparity planes. This assumption rarely holds in the real world, especially due to the large support window used — even when the slant is very small, the big neighborhood span can still go through multiple disparity levels. In contrast, our approach performs aggregation in 3D disparity space along the DPO estimated at different pixel locations. Assume that the cost volume holds the initial , , gives the color matching cost, where difference between pixels , in the left image and , in the right image. Also assume that when , , linearly interpolates is non-integer, function , , and , , . The formula for the 3D adaptive-weight aggregation is as follows: , ,
,
∑
,
, ,
,
(2)
where the weight function is used to suppress , outliers. A simple step function is used here: ,
1 0
|
,
,
|
2
∑
∆
(3)
,
where , ,
,
, ,
,
· ,
, ,
, ,
,
, (6)
is the pixel of interest; ∆
,
,
, ,
,
,
neighboring pixel
represents ,
the weight of ; ∆ , , , and
∆ , , , are the color difference and the Euclidean distance between pixels , and , , respectively. and are user defined parameters. , , is the aggregated cost for assigning disparity hypothesis to pixel , , under the pre, , and at pixel. To computed DPO generate disparity maps at sub-pixel accuracy, we step through disparity hypothesis at 0.5 intervals. After the aggregation process, the winner-take-all optimization is used to find the optimal disparity map: ,
argmin
, , (7)
2.3 Cross-checking and hole-filling The above procedure is applied to both the left and right stereo images and the obtained disparity maps are cross-checked to detect inconsistent matches, which we label as holes. One interesting observation is that most of the holes are caused by occlusion. We scan through each horizontal line to find the left and right immediate-neighboring valid pixels for each hole, and the smaller disparity value denotes the occludee while the bigger value represents the occluder. Thus the occludee’s disparity value is chosen. When propagating the chosen disparity, the horizontal gradient from DPO image is used to alter the chosen disparity value at a finer level so that the slanted surface is modeled.
3
Experimental results
The proposed method was evaluated using the Middlebury test bed [9]. Some of the parameters used in the experiments follow the empirical choices in the original paper [7]. In particular, the support window size is set equal to 51×51 and the two parameters for 19.6 and 40. support weight calculation: Figure 3 shows the various results. The original adaptive weight method, our adaptive weight implementation with sub-pixel accuracy, and the proposed approach are all tested. Table 1 gives the statistical analysis on the performance of the algorithm, and table 2 the statistical analysis information when sub-pixel error threshold is adopted. From all the presented disparity results and statistical analysis, the following observations can be made: • For the Venus, Teddy and Cones datasets, where slanted surfaces are everywhere, the proposed slanted surface modeling approach effectively improves the results upon the original adaptiveweight stereo matcher. The improvement upon the Tsukuba dataset is minimal, since the presence of slanted planes appears very limited.
• Direct incorporation of sub-pixel accuracy with the original adaptive weight stereo matcher does not provide any noticeable improvement. • Combining sub-pixel accuracy with slanted plane modeling gives convincing results. When evaluated with a stricter error threshold, as shown in Table 2, our proposed algorithm ranks the 3rd overall among all local and global optimization based approaches. Compared to the first two approaches, our approach is faster and much easier to implement.
4
Conclusion
A new local stereo matching algorithm is presented in this paper, which combines adaptive-weight cost aggregation with slanted surface modeling. The least squares fitting method is used for robustly estimating per-pixel DPO information, which is later used to guide cost aggregation along slanted surfaces in 3D cost volume. The experiment results show that our proposed approach produces better disparity maps than existing adaptive-weight algorithms [5, 7]. Compared to existing plane fitting based algorithms [2, 4, 6], our approach does not require a priori image segmentation and is easier to implement in parallel. In the future, we plan to implement the proposed method on GPUs for real-time performance. We will also investigate the effects of different weight functions used in disparity plane fitting process, as well as the possibility of performing more passes to iteratively refine both DPO image and disparity map.
Acknowledgments The authors would like to thank financial supports from NSERC, the University of Alberta, and the Memorial University of Newfoundland.
References [1] M. L. Gong, R. Yang, L. Wang, and M. W. Gong, “A performance study on different cost aggregation approaches used in real-time stereo matching”, IJCV, vol.75, no.2, pp.283-296, 2007. [2] A. Klaus, M. Sormann, and K. Karner, “Segment-based stereo matching using belief propagation and a selfadapting dissimilarity measure”, ICPR, pp.15-18, 2006 [3] D. Scharstein and R. Szeliski, “A taxonomy and evaluation of dense two-frame stereo correspondence algorithms”, IJCV, vol.47, no.1-3, pp.7-42, 2002 [4] H. Tao, H. S. Sawhney, and R. Kumar, “A global matching framework for stereo computation”, ICCV, pp. 532-539, 2001 [5] T. Tomabari, S. Mattoccia, and L. Di. Stefano, “Segmentation-based adaptive support for accurate stereo correspondence”, PSIVT, pp.427-438, 2007 [6] Q. Yang, L. Wang, R. Yang, H. Stewenius, and D. Nister, “Stereo matching with color-weighted
correlaation, hierarch hical belief propagation p a and occlusiion handling”, CVPR C 2006. [7] K. J. Yoon Y and I. S. Kweon, K “Adaptiive support-weigght approaach for correspo ondence searchh”, PAMI, vol.228, no.4, pp.650-656, p 2005 5.
Adap ptive-weight (A AW)
[8] Y. Zhang, M. Gonng, and Y.H. Yaang, “Real-timee multivieew stereo usingg adaptive-weighht parzen-windoow and loccal winner-take-all optimization”, CRV 2008. [9] htttp://vision.middllebury.edu/stereoo/
AW W w/ sub-pixell
P Proposed
Grou und Truth
Figure 3: The T experime ental results with w the datase ets from the Middlebury M we ebsite [9]. The e 1st column shows s nd the results s from the orriginal adaptiv ve-weight pap per [7]. The 2 column sh hows the resu ults using our own adaptive support s weigh ht implementa ation with sub b-pixel accura acy. The 3rd column c has th he results from m our proposed approach. The last column n depicts the ground g true disparity maps.. Table 1: The T error rate es evaluated from f the Midd dlebury vision n website, witth error thresh hold = 1. The e italic numbers are a the ranks. Alg. AW [7] AW.Subpixel Proposed
Avg. Rank 17.0 20 23.8 24 15.2 15
Tsukuba no onocc all disc 1.3 38 17 1.85 15 6.90 17 1.8 85 23 2.31 21 9.06 25 1.7 79 23 2.30 21 8.79 24
nonocc 0.71 18 0.82 21 0.30 14
Venus all 1.19 19 1.02 18 0.54 10
discc 6.13 19 6.11 19 3.63 17
nonocc 7.88 19 10.3 29 7.11 14
Teeddy all 13.3 19 15.6 27 8.45 5
disc 18.6 23 22.5 31 17.5 17
Cones nonocc all 3.97 18 9.79 14 5.20 26 11.2 23 3.72 12 9.27 11
disc 8.26 6 11.6 22 9.70 14
Table 2: The T error rates s evaluated frrom the Middllebury vision website, with h error thresho old = 0.5. The e italic numbers are a the ranks. Alg. AW [7] AW.Subpixel Proposed
Avg. Rank 20.3 21 21.6 25 7.4 3
Tsukuba non nocc all disc 18.1 1 19 18.8 18 1 18.6 19 9.60 0 10 10.2 10 14.8 5 8.8 86 9 9.52 7 15.0 6
nonocc 7.77 18 8.31 21 2.99 4
Venus all 8.40 20 8.65 21 3.29 3
disc 15.8 1 19 17.8 2 24 8.17 4 4
nonocc 17.6 19 21.1 28 13.3 10
Teddy a all 23.9 19 27.3 28 15 5.0 2
disc 34.0 27 37.4 33 27.0 10
Cones nonocc n all 1 14.0 24 19.7 23 1 14.8 27 21.1 26 8 8.81 10 15.1 12
disc 20.6 19 23.4 26 17.5 12