with digital graphical information and user interface com- ponents. These augmentations complement the properties of the printed information in that they are ...
Localisation and Interaction for Augmented Maps Gerhard Reitmayr, Ethan Eade, Tom Drummond Department of Engineering University of Cambridge Cambridge CB1 2PZ, UK {gr281|ee231|twd20}@cam.ac.uk
Abstract Paper-based cartographic maps provide highly detailed information visualisation with unrivalled fidelity and information density. Moreover, the physical properties of paper afford simple interactions for browsing a map or focusing on individual details, managing concurrent access for multiple users and general malleability. However, printed maps are static displays and while computer-based map displays can support dynamic information, they lack the nice properties of real maps identified above. We address these shortcomings by presenting a system to augment printed maps with digital graphical information and user interface components. These augmentations complement the properties of the printed information in that they are dynamic, permit layer selection and provide complex computer mediated interactions with geographically embedded information and user interface controls. Two methods are presented which exploit the benefits of using tangible artifacts for such interactions. Keywords: Spatially Augmented Reality, Projection displays, Tangible User Interfaces, Optical Tracking
1. Introduction Cartographic maps are great examples of complex visualisations. The high resolution of printed maps permits the display of a large amount of information. Various layers, such as contour lines describing topography or abstract symbols representing artifacts such as settlements, convey different properties of the presented area. The resulting wealth of information allows quick browsing of a map to arrive at an overview picture but also close inspection of sub-parts to retrieve more detailed data. Being physical artifacts, maps afford natural interaction by direct manipulation. They can be freely arranged on a table surface, quickly moved around for closer inspection of an area of interest and easily annotated with marks or post-
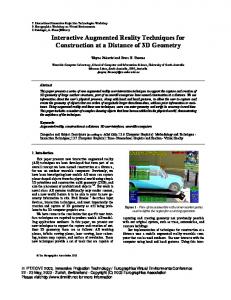
Figure 1. A user interacting with augmented maps using a PDA device to pick up a control user interface.
it notes. A map also creates a common reference frame for multiple users in which gestures and verbal communication are interpreted. Nevertheless, maps are static artifacts: the displayed information does not change. Computer driven displays allow arbitrary graphics and visualisations to be presented to the user. However, they lack the high resolution of maps and do not lend themselves to such simple manipulation. In this work, the physical and tangible qualities of maps are combined with the possibilities of dynamic and selective visualisation of digital media. Our system makes three contributions. First, it performs interactive tracking of maps on a table top environment and projection of information (see sections 4 and 5). Second, it tracks tangible user interface devices which can be placed on the maps and which enable intuitive access to information that is linked to locations on them (see Figure 2 and section 6). For example, an image
Figure 2. An augmented map showing the flooded River Cam. The image browser to the right shows views corresponding to locations and different stages of the flood, while the PDA to the left controls a helicopter unit.
browser interface presents images that are related to places such as pictures taken with mobile devices by collaborators roaming the environment. Third, the system includes a method for pushing distributed user interfaces onto remote devices such as a PDA which, when combined with the tangible UI tracking facility, lets the user interact with real and virtual assets on the map (see section 3.2). Both types of user interface devices can be manipulated by one or more users in the same way as the maps themselves. Hence, we provide an interactive way to browse and change additional digital information referenced by the map within the same tangible user interface paradigm.
2. Related work A number of research projects have developed augmented paper-based artifacts. The DigitalDesk [15, 24] first demonstrated how a computer based interface could augment a plain piece of paper. Optical character recognition served as input to the computer and projection of information on the paper as output. Similarly, Mackay et al. investigated augmenting various paper-based interfaces including video editing [11], engineering drawings and air traffic control systems [10]. Discussing these systems, Mackay and Fayard point out that users have very practical reasons for using paper-based artifacts in their daily work [9]. Typically, pure computer-based systems either increase the users’ workload because they have to be kept up-to-date along with existing paper-based materials, or they cannot support certain tasks. The metaDESK[22] work demonstrated a variety of tangible tools in a digital tabletop environment. Later work on Urp[23, 6] created a city planner application where
physical models representing a city scape were augmented with projected graphical information. Again, tangible tools were used to set parameters of simulations of shadows, sun light reflections or wind effects. The application was validated with a class of architecture students in a real course setting. Similarly, the work on spatially augmented reality[18, 17] showed that augmenting physical objects with projector based information is a valid alternative to more immersive systems using HMDs. In contrast to that, the MagicMeeting[19, 20] system demonstrates tangible user interfaces in a tabletop setting, but uses HMDs to create overlays of virtual objects. The Rasa project [13, 12] describes a prototype environment to support work and decision making in military command posts. The authors note that while sophisticated equipment was available, paper maps and post-its with hand written symbols were preferred by the personnel. Therefore the authors tried to augment the established work practices and artifacts with computer supported interaction based on speech and character recognition, and simple localisations using Smartboard technology. In recent work they also investigate vision based tracking methods [14]. Bobrich and Otto [3] present 3D overlays of digital elevation models over real maps with a video see-through augmented reality setup using fiducial based optical tracking. The interaction is limited to selecting different rendering modes. Moreover, the described approach replaces the original map image with a virtual model, instead of explicitly adding to it. Marking-up maps with electronic information was investigated by Reilly [21]. Locations on maps were identified with RFID tags which are read by a handheld device. Then corresponding information was presented on the device. Similarly, ART+COM [1] combined a real large scale map with projected digital annotation in a museum setting using a touch sensitive surface to capture user interaction. The Pebbles project [16] deals with automatically generating and presenting user interfaces on a handheld device to control appliances in the user’s environment. Their idea of a personal universal controller (PUC) influenced our use of the PDA as an interface to control abstract entities. However, we rely on a more low level approach of running dedicated clients on the handheld device to gain more flexibility.
3. System overview The overall system centres around a table top environment where users work with maps (see Figure 3). One or more maps are spread out on a table or any other planar surface. A camera mounted above the table tracks the maps’ locations on the surface and registers interaction devices placed on them. A projector augments the maps with projected information from overhead.
projector
camera
PC map table top
pda
wlan
Figure 3. Schematic overview of the system.
3.1. Software Video images captured at 640 × 480 × 8bpp at 30Hz are processed by three components in parallel. The calibration component is active only during the startup phase or when recalibration is manually selected. Two localisation components deal with localising the maps and the interaction devices on the table surface. They require input from the calibration component regarding the distortion of the camera’s view of the table surface. The system computes the location, orientation and depth ordering of any maps and user interface devices on the table top. This information is passed to the rendering and interaction component which is based on Open Inventor. The rendering component also uses the projector calibration to correctly align the graphical augmentations with the maps. Events containing the location of tracked devices on the tabletop are propagated through the scene graph to allow different nodes to react to them. As all transformations of maps and devices are mapped to the scene graph, nodes have full access to all the required geometric information. They can react to devices being close to them and set the state of devices.
3.2. Remote user interfaces with PAWS Besides static or animated graphics, the system also supports active entities that embody complex behaviour or interface to outside controls. Such entities present a dedicated graphical user interface on a PDA device to allow the user control over their state. The PDA is equipped with wireless networking functionality and communicates with the main system. The device runs an instance of our Python Activated Windows System (PAWS), a CORBA service implemented in Python that accepts and executes Python scripts send to it by other processes. PAWS provides three basic functions either via a simple socket based interface or as CORBA services: upload of Python code modules as zip files, execution of Python scripts and execution of single
Python commands. The latter allows interactive debugging of scripts running on the PDA using basic tools such as telnet. Typically, an application creates a CORBA object providing services that represent the state and possible actions of an entity. This object is registered with the CORBA Naming service for simple lookup. When notified that the PDA is close, the entity sends the required code modules to it and executes a Python script that instantiates the user interface objects on the PDA. Such scripts create user interface elements and further CORBA clients and services (for registering callbacks) to communicate with the service provided by the application. Because the PDA provides a single small screen, it is feasible to show the GUI for only one entity at a time. Thus, if the PDA is moved quickly over several entities, the application requires some contention management to avoid unexpected changes to the displayed GUI. Currently individual entities create only one user interface instance at a time and upload it to the PDA only when no other interface is present. As a result of the remote user interface architecture of PAWS, the PDA acts as a completely general GUI frontend for any entity. It can be a very thin client only presenting some image information or a thick client that implements a complex user interface with control logic. Moreover, the approach applies not only to PDA devices, but also to any platform supporting Python. For the sake of convenience, most of the development described in this paper took place on a desktop workstation.
4. Localisation To project annotations correctly and respond to user interaction, the system must know the configuration of maps and interaction devices in the current view. We determine the geometric configuration of objects on the table without any tracking assumption, fully localising all objects. This makes the localisation robust to sudden configuration changes, such as maps moving in and out of view or pointing devices being dropped into place. See Figure 4 for an overview of the processing pipeline.
4.1. Calibration The function from table coordinates (x, y) to image coordinates (px , py ) is given by � � x px = Camera H y py 1 where Camera is the known, nonlinear projection function of the camera, and H is the 3 × 3 homography from table
space to the camera frame. We find H by tracking a known planar edge model on the table (typically a grid with known scale) and using Gauss-Newton nonlinear optimisation to find the parameters of the homography [4]. The calibration parameters are saved from use to use, and remain valid as long as the camera parameters and relative placement of the camera and working area remain static. The projector-to-table homography can be calibrated manually (by indicating the corners of a real rectangle with the projected mouse cursor) or automatically (by sequentially detecting projected corners of a rectangle). Because the mapping from projector to table is a simple projective homography, one measurement of a projected known rectangle is sufficient to determine the homography.
4.2. Rectification We construct an undistorted, or rectified, image from the camera image. The distortion of the camera projection and the projective homography from tabletop to camera frame are inverted so that the rectified image displays an orthographic overhead view of the working area, with canonical scale. We compute the undistortion function without explicitly computing inverses by applying the distortion model D(x, y) to the coordinates (x, y) of an image and storing the preimage (x, y) in a lookup table L at D(x, y). Image rectification proceeds by replacing the intensity at (x0 , y 0 ) with the intensity at L(x0 , y 0 ), with bilinear interpolation.
4.3. Map Detection and Localisation Given a set of preprocessed template images (described below), we detect and localise the templates within a single given camera image by • • • •
selecting features at multiple scales, generating feature descriptors, finding nearest-neighbour correspondences, eliminating incorrect correspondences in a multi-stage process, • and fitting the remaining correspondences.
Feature Selection We compute an image pyramid by repeatedly smoothing and subsampling by a factor of two. At each scale of the pyramid, Harris corners[4] are extracted. The window size remains constant as the scale changes, so that corners are a function of increasingly large image patches. Corners are then sorted by corner strength according to the Harris detector and the strongest points are retained at each scale.
Feature Descriptors We choose a feature descriptor that possesses only the invariants we require for feature matching. Because we know the scale of our environment, and we have an orthographic projection of the working area, we need only planar rotation invariance and basic lighting invariance in our descriptor (translation invariance comes for free by using local descriptors). The obvious descriptor, a local patch of the image around a feature point, is not rotation invariant, because a planar rotation of the image results in an entirely different descriptor. Instead, we use a gradient histogram similar to the SIFT feature descriptor [7]: Let the h bins of a histogram divide up the unit circle uniformly. Then each point of the gradient in a region around the feature point contributes to the bin corresponding to its direction angle, and the contribution is proportional to the gradient magnitude multiplied by a gaussian envelope centred on the feature point. The gaussian envelope makes the histogram approximately isotropic as well as weighting locations closer to the centre more heavily. The overall magnitude of the histogram reflects local lighting, so normalising it to unit Euclidean magnitude yields linear lighting invariance. To achieve rotation invariance, the histogram bins are shifted so that the maximal bin is first. This shift corresponds to the angle θ by which the descriptor has been ”rotated” from its natural orientation. If multiple bins have values close to the maximum (within 0.8 of the maximum, for instance), then multiple feature descriptors are generated, each with the histogram starting with the corresponding near-maximal bin. The distance between two feature descriptors is the Euclidean distance between their histograms in the h-dimensional histogram space. We use h = 32, with each bin magnitude represented by a floating-point value. We also store the angle by which the histogram is shifted for use in matching. Feature-based Detection The map localisation system preprocesses the template images at initialisation by selecting features at multiple scales. Features are selected from a grayscale template image using the selection method described above with window size of w pixels. For each additional scale the image is scaled down by a factor of two (by smoothing and sampling) and the selection process is repeated with the same w, so that in each successive scale, feature descriptors represent larger patches of the image. For each scale, all features of that scale across all template images are stored in an approximate-nearest-neighbors (ANN) data structure, so that template features resembling a feature detected at runtime can be quickly retrieved [2]. Features selected from the template images are referred to as template features.
rectified image
feature extraction
match library
projection
video source
treshold image
lines & rectangles
Figure 4. Processing steps of the localisation pipeline for map detection and tracking interaction devices.
When a camera frame is processed at runtime, it is first rectified as described above. Features selection at multiple scales operates on the rectified image just as it does on template images at initialisation time. For each such runtime feature, the k approximate nearest neighbors are chosen from all template features of the same scale. Note that the k similar features may come from any combination of the template images. This creates kns candidate correspondences for scale s, where ns is the number of runtime features of scale s. Each correspondence is assigned a confidence value in the match given by d21+� , where d is the Euclidean distance between the feature descriptors in the correspondence, and � is a small value employed to keep the confidence well-defined when the descriptors match exactly. The known structure of the problem is now exploited to eliminate incorrect correspondences. Because maps undergo rigid planar transformations (transformations in SE(2)), all correspondences for a single map must have the same rotation angle: For correspondences between features ai and bi (in the runtime image and a given template image, respectively), we know that θ(ai ) − θ(bi ) should be the same for all i if the correspondences are correct. Thus, for all correspondences to a given template image (across all scales) incorrect correspondences can be eliminated by finding the dominant angle of rotation and eliminating all correspondences with sufficiently different rotations. To avoid choosing the wrong dominant angle (because the modal one in a set of correspondences may not always be the correct one), correspondences are eliminated only if their rotation is not close to any strong angle, where a strong angle is one whose presence in the set is close to that of the strongest one. This rotation inlier detection is performed by build-
ing a rotation histogram over correspondences with a given map, where the contributions of each correspondence’s rotation to the histogram are weighted by the confidence of the correspondence. The magnitude of each bin is the presence of that rotation in the set of correspondences, and any correspondences with rotation not sufficiently close to a highmagnitude bin are culled. Having eliminated many incorrect correspondences based on rotation, one of the remaining degrees of freedom of SE(2) (the translation parameters) can be employed to eliminate more outliers. To ensure correct computation of translation, the correspondences must be accurate to the pixel level or below. Because corresponding features selected from two different images may be centred on slightly different places (but still have very close feature descriptors) the two features of a correspondence must be aligned. Image patches are rotated around the feature locations of a correspondence so that they have the same orientation, normalise them around their means by their standard deviations, and slide one over the other, minimising the sum squared difference (SSD) of intensity over small translations. The runtime feature location is then adjusted by the translation yielding the minimal SSD so that the correspondence is well-aligned. This alignment step is postponed for efficiency’s sake until after rotation-based outlier detection because it is unnecessary for rotation comparison, and thus need not be computed for correspondences discarded in that first stage. The confidence of a correspondence is updated with the alignment minimal SSD. With a set of well-aligned correspondences, further outlier detection is employed that depends on translation. Given the rotation component of the transformation, the transformation between the maps rotated to a common ori-
entation should be a simple translation. Thus, correct correspondences should all have the same translation magnitude after being rotated around some common origin. The dominant rotations calculated in the first stage are applied to the set of features of one of the maps, rotating them about the centroid of the set, and the translation magnitudes in the rotated correspondences are binned. Outliers are rejected using the same method as described above for dominant rotations. Just as with rotation inlier detection, because the translation magnitude is a scalar quantity, a full sample consensus search using the histogram is feasible. The (reduced) set of inlier correspondences after this second stage of outlier elimination is used as the input to a homography search based on inlier detection using RANSAC[8]: two correspondences are chosen at random, the transformation determined by the pairs is computed, correspondences that are consistent with that transformation are counted. This vote-counting is repeated many times, resulting in the maximum vote-getter being taken as a starting point for a robust least-squares fit of its voters (the inliers). After outlier elimination is complete, a homography is robustly fit to the remaining correspondences using reweighed least squares. If there are too few remaining correspondences to fit a homography, or the orthogonality of the resulting homography is too low, the image match is rejected. Otherwise, the runtime-to-template match, and its homography and correspondence set, is recorded for use by the application. When all map matches have been determined, the depthordering of the maps in the runtime image is determined. We assume that a partial ordering exists (that no map is both above and below another map at different locations in the image). Counting the number of detected correspondences to map A that fall inside the outline of map B gives a score cover(A, B). Map A is above map B if cover(A, B) > cover(B, A). This imposes an ordering on the maps. Note that we do not further consult the images in regions of overlap to determine cover(A, B); only correspondences that have already passed through the stages of outlier elimination are counted. Time spent performing feature selection and descriptor generation constitutes roughly 75% of the total time spent performing map localisation; the other portion is spent removing the outliers and fitting the results. The system currently runs at 4-5 fps on a 3.2Ghz Pentium IV, with three template images, each preprocessed to yield about 1000 features, and about 600 features selected from each runtime image.
Here the image is searched for rectangular shapes using a Hough transform [5] based approach. Pixels with strong gradient information are transformed into curves in Hough space representing the possible lines containing the pixel. Instead of incrementing the bins for the whole curve, we use the gradient direction to select a point in Hough space corresponding to lines containing the point and being orthogonal to the gradient direction. Then a Gaussian is added to the existing Hough image at the resulting point. The Hough image is then searched for local maxima which represent strong lines in the original image. These lines are searched to find rectangles of a known size. Because rectangles in the image can appear as arbitrary convex quadrilaterals due to perspective distortion, the lines are first transformed into the plane of the table using the calibrated homography between the camera image and the table. Then the following geometric reasoning is applied. First, parallel lines separated by a distance corresponding to a side of one of the rectangles are found. Then these pairs are tested amongst each other to identify orthogonal quadrilaterals with dimensions matching one of the rectangles. Given such a quadrilateral, its corners are projected back into the video image. Then the support set for each side is found in the gradient image. Only edge pixels with gradient direction nearly orthogonal to the line direction are added to the support set. Finally, the sides are refitted to the support sets using least-squares to produce a close fit to the rectangle in the image. Both devices have a peak mounted on one side to allow pixel-accurate positioning of the hot spot on the map. For any candidate rectangle, the possible peak regions are searched in the image to estimate the location of the peak. Altogether, the following information is returned for each device: the rectangle bounding the device, the peak location, and the orientation on the table.
4.4. Interaction tracking
Symbols denote the location of various entities not already present on the map. Symbols change their appearance over time to notify the user of changes to their state or to draw attention to a particular position on the map. They
Localisation of interaction devices employs a technique distinct from those used for calibration and map detection.
5. Augmenting maps Tracking the location of maps on the table, we project augmentations on the maps to provide additional and dynamic information to the users. Augmentations best complement the static nature of printed maps, when they represent state which changes over time. Therefore, we implemented a set of annotations which change their appearance, shape and location over time.
5.1. Annotations
Figure 5. Three maps are occluding each other. Each map is highlighted with a different colour to show the correct overlay. The contrast for this image was enhanced.
also move to correctly present the location of non-stationary objects. For example, vehicles or pedestrians can be visualised in the context of the map. Curves present paths of moving entities, borders of areas of interest such as flood areas, or path networks. They move and change their location as well to inform the user of time dependent behaviour. Areas change their shape and borders to reflect changing phenomena. Animated textures or colours may highlight areas of interest.
5.2. Occlusion The depth-ordering information computed by the map localisation step is used to improve the overlays by rendering correct occlusion with other maps and interaction tools (see Figure 5). Maps are ordered in z direction according to the depth-ordering output and are rendered with a black quadrilateral as background. Any information overlaid on a map is in front of the black quad but still behind the next map in the ordering. The result is correct occlusion of dynamic information corresponding to invisible areas of the real maps. Similarly, the rectangles describing interaction devices are rendered above all maps under the assumption that they are always reside on top. If no information is displayed on them, they are simply rendered as black quadrilaterals as well.
Figure 6. A simple physical prop becomes a selection tool and projection surface at the same time. Images referenced by the location pointed at are displayed in the white rectangle.
6. Interaction In addition to the basic augmentation of the maps, we support a set of devices to interact with information referenced by locations on the maps. These devices afford direct manipulation of physical props on the maps to access and display the information.
6.1. Image browsing The first interaction device lets the user quickly browse images that are associated with locations on the map. A rectangular image browser prop consisting of a white piece of cardboard with a black border is placed on the map. A pointer in the middle of one side of the rectangle is used to denote a specific location and orientation on the map. The white area on the prop itself is used to project the retrieved image (see Figure 6). Its design is similar to the passive lenses used with the metaDESK[22] in that it is a passive physical prop providing a magic lens metaphor. Contrary to the metaDESK work, it operates with real paper artifacts. The device provides a simple and direct way to browse images or other information registered with locations on the maps. Both location and direction of the pointer influence the displayed image. A hysteresis function avoids flickering of images at locations which are close to two or more reference points. The direct display of the images enables seamless operation because both the query and the result are visible to the user within the same area. Users do not need
Figure 7. Proximity to an active entity (depicted as a helicopter) brings up the control user interface on the PDA device.
to look to other screens beyond the table surface to see the hidden information. The physical properties of the cardboard rectangle also match its intended use. While several users may interact with the table and also use the image browser, only one location can be selected because the selection is subject to the location of the physical prop. Thus, either only one user can interact with it at a time or several users have to cooperate to use it successfully.
6.2. Entity control A second interaction device provides control over entities referenced to map locations. A Windows CE based PDA device is located using the screen rectangle which appears almost black in the video image. Again a pointer is present on the top of the device to accurately determine a location. An active entity referenced to a location presents a dedicated user interface on the PDA using the mechanism described in section 3.2. Typically the user interface is persistent on the PDA until it is replaced by a new one. Therefore users can pick up the PDA from the table surface again and operate it in a more comfortable handheld manner.
7. Application We have implemented a flood control application for the city of Cambridge (UK) to demonstrate possible features of augmented maps. The River Cam running close to the town
Figure 8. Details images from the Cambridge flood scenario. The left column shows the normal state, while the right column shows the extension during a flood. The image browser shows images associated with the state of the river and the location. centre of Cambridge regularly floods the surrounding areas, which are lower than the water level of the river in a number of cases. In the event of real flood, the water line needs to be monitored, threatened areas identified and response units managed. Information provided by local personnel helps to assess the situation. An augmented map provides the ideal frame for presenting and controlling all the relevant information in one place. A map of the interesting area is augmented with an overlaid area representing the flooded land at a certain water level. Figure 8 shows details of a map of Cambridge overlaid with the current expansion of the River Cam. The overlay changes dynamically with the water level which is controlled by an operator on the PDA device. Certain endangered compounds are highlighted in red with an animated texture when the water level reaches a critical level. Other information sources include images provided by ground personnel at various locations. Green icons represent the locations and directions of these images. Using the image browsing prop an operator can see the image and assess the local situation immediately. An emergency unit represented as a helicopter is visible on the map as well. By placing the PDA next to it, a corresponding graphical user interface appears on it to present more status information and give orders to the unit. Here its direction and speed can be controlled. Another function of the PDA interface accesses web pages of relevant places on the map. Purple circles represent corresponding locations and placing the PDA next to them presents the associated web page on it.
Figure 9. (left) Overlay of the map raster over the real map. (right) The model of the river aligns accurately with the printed shape, the green symbol centres on the street. The contrast was enhanced for both images.
8. Results The system described in section 7, including rectangle localisation and rendering, runs at 20-25 fps on a desktop machine using a 3.2Ghz Pentium IV. Map localisation runs in a parallel thread at 2-3 fps per second, even with the additional processing tasks. CPU usage is typically at 95%. While the camera image provides only a resolution of 640×480 covering more than the projected area (with a resolution of 1024×768), the sub pixel accurate tracking of the map images results in an error of the overlay to within one pixel of the projector image (see Figure 9(left)). To produce this image, the map raster was extracted from the template image used for locating the real map and reprojected onto it. The white line is about 1 pixel wide in the projection and should align with the black cross underneath it. In our setup, this translated into an absolute error of about 1-2mm. The achieved accuracy does not permit interaction with details of the printed maps beyond the resolution of the overlays. Nevertheless, due to sub pixel accurate positioning, it is high enough to work with the annotations themselves. The higher detail of the printed map is valuable because it can provide background information without wasting valuable pixels. For example, street labels are typically printed at a small scale which could not be used for a digital display covering the same area. Both map and interaction device localisation are robust against occlusions and change in lighting conditions. Occlusions of maps up to 50% are handled accurately. As feature intensities are normalised for each feature individually, the system can handle local changes to lightning like incident sunlight as well as global changes. Large changes in feature descriptions (for example, due to pixel saturation) can contribute to outlier matches which are removed in the outlier detection step. Interaction devices may be partially occluded as long as a subset of each side of the border rectangle is still visible. Figure 10 shows some situations that are handled well by the system.
Figure 10. The first row compares no occlusion of a map to large occlusion. The circles denote successfully matched features at different scales. The second row shows various stages of occlusion for an interaction tool. In the last image, the nob is not visible anymore and localised incorrectly.
Contrary to most former work in augmented paper interfaces, the presented system does not enforce modifications to the paper artifacts to operate. Because any image can be used as input to the localisation, the system is very flexible in the possible artifacts and not limited to maps alone. Similarly, the interaction props themselves are localised based on their respective shapes alone.
9. Conclusions and future work Our work combines ideas from different user interfaces areas into a single coherent system. Augmenting paperbased artifacts offers the advantages of high-resolution printing, familiarity to users, and tangible qualities with the flexibility of digital information. It represents an instance of spatially augmented reality [18] avoiding the use of uncomfortable HMDs and generating large displays to increase immersion and at the same distance as the real objects supporting eye accommodation. Applying tangible user interface techniques to interact with the augmentation and the system offers a seamless experience for users because they integrate with the affordances of the maps themselves. Finally, the deployment of feature based computer vision methods yields a robust system without the need for markers or other changes to the used artifacts. Although the system has not yet been evaluated in a user study, we believe that the capabilities offered provide a natural and intuitive way of interacting with geographical information. Further, the system described comprises a number of enabling technologies which support many other
kinds of applications. The existing application serves as a demonstration of the system’s functionality and does not try to improve existing work practices. We feel that a valid evaluation can be based only on an application grounded in the input of end users. The value of tangible user interfaces has been demonstrated before and our contribution lies in the creation of a robust localisation system and novel combination of user interface paradigms, while the underlying interaction techniques have been validated before. For future work, we will further automate the calibration of the setup to make it readily deployable and mobile. The creation of library images currently depends on the calibrated system and should become a one-time step together with the creation of correctly registered content. As a result we will require a calibration step to measure the scale of the rectified image versus the library images. We are currently improving the efficiency and robustness of localisation. In the long run, the table top system will become one part of a larger computing environment combining diverse input and output methods to support command & control situations.
Acknowledgements This research is supported by the Boeing Company. Images of the Cambridge flood of October 2001 are copyright cambridge2000.com and used with permission. We would like to thank Edward Rosten for his continuous support during construction of the system.
References [1] ART+COM. Tutanchamun. http://www.artcom.de/, visited July 1st 2005, 2004. [2] S. Arya, D. M. Mount, N. S. Netanyahu, R. Silverman, and A. Y. Wu. An optimal algorithm for approximate nearest neighbor searching fixed dimensions. Journal of the ACM, 45(6):891–923, 1998. [3] J. Bobrich and S. Otto. Augmented maps. In Geospatial Theory, Processing and Applications, volume IAPRS 34 of 4, Ottawa, Canada, 2002. [4] T. W. Drummond and R. Cipolla. Visual tracking and control using lie algebras. In Proc. IEEE Conf. on Computer Vision and Pattern Recognition 1999, Ft. Collins, CO, USA, June 23–25 1999. IEEE. [5] P. Hough. Machine analysis of bubble chamber pictures. In International Conference on High Energy Accelerators and Instrumentation. CERN, 1959. [6] H. Ishii, J. Underkoffler, D. Chak, B. Piper, E. Ben-Joseph, L. Yeung, and Z. Kanji. Augmented urban planning workbench: Overlaying drawings, physical models and digital simulation. In Proc. ISMAR 2002, pages 203–212, Darmstadt, Germany, September 30 – October 01 2002. IEEE. [7] D. Lowe. Distinctive image features from scale-invariant keypoints. International Journal of Computer Vision, 2004. [8] R. C. B. M. A. Fischler. Random sample consensus: A paradigm for model fitting with applications to image analysis and automated cartography. Communications of the ACM, 24:381–395, 1981.
[9] W. E. Mackay and A.-L. Fayard. Designing interactive paper: lessons from three augmented reality projects. In Proc. IWAR’98, pages 81–90, Bellevue, Washington, US, Nov 1 1998. ACM. [10] W. E. Mackay, A.-L. Fayard, L. Frobert, and L. Medini. Reinventing the familiar: exploring an augmented reality design space for air traffic control. In Proc. CHI’98, pages 558–565, Los Angeles, CA, USA, April 1998. ACM, ACM Press/Addison-Wesley Publishing Co. [11] W. E. Mackay and D. S. Pagani. Video mosaic: Laying out time in a physical space. In Proc. Multimedia’94, San Francisco, CA, USA, October 1994. ACM. [12] D. R. McGee and P. R. Cohen. Creating tangible interfaces by augmenting physical objects with multimodal language. In Proc. IUI’01, pages 113–119, Santa Fe, New Mexico, United States, 2001. ACM Press. [13] D. R. McGee, P. R. Cohen, and L. Wu. Something from nothing: Augmenting a paperbased work practice via multimodal interaction. In Proc. DARE 2000, pages 71–80, Helsinor, Denmark, April 12–14 2000. ACM. [14] D. R. McGee, M. Pavel, A. Adami, G. Wang, and P. R. Cohen. A visual modality for the augmentation of paper. In Proc. PUI 2001, Orlando, Florida, USA, Nov. 15–16 2001. ACM. [15] W. Newman and P. Wellner. A desk supporting computerbased interaction with paper documents. In Proc. CHI’92, Monterey, CA, USA, May 3–7 1992. ACM. [16] J. Nichols, B. A. Myers, M. Higgins, J. Hughes, T. K. Harris, R. Rosenfeld, and M. Pignol. Generating remote control interfaces for complex appliances. In Proc. UIST 2002, pages 161–170, Paris, France, October 27–30 2002. ACM. [17] R. Raskar, G. Welch, and W.-C. Chen. Table-top spatiallyaugmented reality: Bringing physical models to life with projected imagery. In Proc. IWAR’99, San Francisco, CA, USA, October 20–21 1999. IEEE. [18] R. Raskar, G. Welch, and H. Fuchs. Spatially augmented reality. In Proc. IWAR’98, San Francisco, CA, USA, November 1st 1998. IEEE. [19] H. Regenbrecht, G. Baratoff, and M. Wagner. A tangible AR desktop environment. Computer & Graphics, 25(25):755– 763, 2001. [20] H. T. Regenbrecht, M. T. Wagner, and G. Baratoff. Magicmeeting - a collaborative tangible augmented reality system. Virtual Reality - Systems, Development and Applications, 6(3), 2002. [21] D. Reilly. Marked-up maps: exploring mixed media for group navigation and information gathering. In Proc. MUIA’04, Glasgow, Scotland, Sep. 13 2004. [22] B. Ullmer and H. Ishii. The metaDESK: Models and prototypes for tangible user interfaces. In Proc. UIST ’97, pages 223–232, Banff, Alberta, Canada, October 1997. ACM Press. [23] J. Underkoffler and H. Ishii. Urp: A luminous-tangible workbench for urban planning and design. In Proc. CHI’99, pages 386–393, Pittsburgh, Pennsylvania, USA, May 15–20 1999. ACM. [24] P. Wellner. Interacting with paper on the DigitalDesk. Comm. of the ACM, 36(7):86–97, 1993.