JOURNAL OF INTERFERON & CYTOKINE RESEARCH 23:621–630 (2003) © Mary Ann Liebert, Inc.
Localization of IFN-g-Activated Stat1 and IFN Regulatory Factors 1 and 2 in Breast Cancer Cells JUDITH M. CONNETT,1 STEVEN R. HUNT,2 SUZANNE M. HICKERSON,2 SUSAN J. WU,2 and GERARD M. DOHERTY1
ABSTRACT The aim of the present work was to evaluate the induction and localization of Stat1, interferon (IFN) regulatory factor-1 (IRF-1), and IRF-2 after IFN-g exposure of human breast cancer cell lines, SKBR3, MDA468, MCF7, and BT20. Results from growth assays, Western staining, electrophoretic mobility shift assay (EMSA), and immunohistochemical staining were collated to test our hypothesis that immunohistochemical analysis of Stat1, IRF-1, and IRF-2 would provide additional information about the functionality of the IFN-g signaling pathway in human tumor lines. EMSA results showed that in each of four cell lines, Stat1 expression was increased and demonstrated functional activity after IFN-g stimulation. Western and EMSA analysis showed upregulation of IRF-1 but not IRF-2 in each cell line. Confocal microscopy of cells stained for Stat1, IRF-1, and IRF-2 confirmed the results and also provided novel information about the intracellular localization of proteins and intercellular variations in responses. The proportion of cells with IRF-1 stimulation and translocation was positively correlated with the IFN-g growth suppression in vitro. In conclusion, using four independent assays, we have demonstrated that heterogeneity in IFN-g-mediated upregulation of signal transduction proteins can be detected in vitro and that these differences can explain distinct cellular growth effects.
INTRODUCTION
I
NTERFERON -g
(IFN-g) IS A PLEIOTROPIC CYTOKIN E that is produced by T lymphocytes and natural killer (NK) cells and is known to have important roles in the systemic immune response.(1) IFN-g is involved in upregulating MHC class I expression and inducing MHC class II expression for antigen presentation. IFN-g also affects the monocyte/macrophage component of the immune system by inducing differentiation, promoting antigen presentation, and increasing expression of cell surface proteins that augment antigen presentation.(1) Additionally, IFN-g has significant effects on some tumors, including tumor growth inhibition and stimulation of the immune response to tumors.(2) Our laboratory has shown that endogenous IFN-g limits the in vivo growth of tumors in syngeneic mice and that blocking the endogenous IFN-g response using anti-IFN-g antibodies leads to an increase in the growth rate of the tumor.(3) This antitumor effect has been confirmed in syngeneic IFN-g knockout (IFN-g 2 /2 ) mice using B16-F10 murine melanoma.(4) These tumors grew significantly faster in the animals that lacked
1Department 2Department
the ability to produce IFN-g than in wild-type (IFN-g 1 /1) mice. The tumor growth-inhibiting effects of IFN-g have also been demonstrated in other models.(2,5,6) The IFN-g signal is mediated through a pathway (Fig. 1) that includes the IFN-g receptor (IFNGR) complex, the Jak1 and Jak2 kinases, and the signal transducer and activator of transcription (Stat) protein.(1,7) Stat1 is phosphorylated, dimerizes, and translocates to the nucleus, where the complex binds to the promoter region of the IFN regulatory factor-1 (IRF-1) gene. IRF-1, after transcription and translation, returns to the nucleus, where it binds to a specific sequence in the promoter region of IFN-g-inducible genes. These genes include CIITA, TAP1, LMP2, b2-microglobulin, lysyl oxidase, and p21.(8) Interestingly, there is an interaction of IRF-1 with IRF-2, a protein that also can be induced by IFN-g and that also binds the same DNA sequence as IRF-1.(9–12) Unlike IRF-1, IRF-2 downregulates or blocks upregulation of gene transcription. IRF-2 is induced later than IRF-1 but seems to have greater protein stability. IRF-2, therefore, may play a role in the feedback inhibition of the effects of IFN-g mediated by IRF-1. Additionally, the ratio of IRF-1/IRF-2 may be critical for determining some effects of
of Surgery, University of Michigan, Ann Arbor, MI 48109. of Surgery, Washington University School of Medicine, St. Louis, MO 63110.
621
622
CONNETT ET AL.
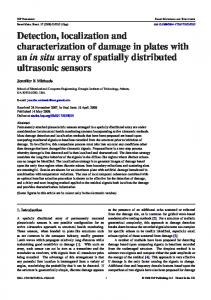
FIG. 1. IFN-g signal transduction pathway. IFN-g binds the IFN-g receptor proteins (IFNGR-1 and IFNGR-2), causing dimerization of the receptor. This activates Jak1 and Jak2 kinases that are associated with the cytoplasmic binding sites of the receptor proteins. These kinases phosphorylate Stat1, which dimerizes (possibly including IRF-9 in the complex) and translocates to the nucleus. There, activated Stat1 complexes bind to the IFN-g-activated sequence (GAS), also called the IFN-g response region (GRR), in the promoter region of the IRF-1 gene, leading to transcription of the IRF-1 gene. After translation, IRF-1 migrates to the nucleus and binds to the IRF-binding element (IRF-E), promoting transcription of IFN-g-responsive genes. Although IRF-2 also has GAS regions in its promoter, it is less significantly induced by activated Stat1 binding. It also has a longer half-life in the cytoplasm than IRF-1. Constitutive rather than induced IRF-2 activity thus seems to account for most expressed IRF-2. IRF-2 also binds to the IRF-E but does not promote transcription and thus acts as a competitive inhibitor of IRF-1-induced transcription.
IFN-g, analogous to the bcl2/bax ratio, which affects apoptosis in some circumstances.(4,13,14) IRF-1 has been shown to slow cell growth and act as a tumor suppressor in some models, and IRF-2 seems to have oncogenic properties.(4) The specific aim of the present work was to evaluate the responses of Stat1, IRF-1, and IRF-2 to IFN-g in human breast cancer cell lines using both biochemical and immunohistochemical techniques. Our hypothesis is that immunohistochemistry and confocal microscopic analysis of Stat1, IRF-1, and IRF2 is an accurate way to assess the functionality of the IFN-g signaling pathway in human tumor cell lines and that these techniques may prove applicable to the human tumor specimens to assess the intactness of this pathway in clinical breast cancer.
Cell culture Human SKBR3, MDA468, MCF7, and BT20 breast cancer cell lines were used in these experiments. All media were supplemented with 50 IU/ml penicillin and 50 mg/ml streptomycin. Fetal bovine serum (FBS) was from JRH Biosciences (Lenexa, KS). SKBR3 cells were routinely maintained in McCoy’s 5A medium plus 10% FBS. MDA468 cells were maintained in Dulbecco’s modified Eagle’s medium (DMEM)/Ham’s F12 (1:1) plus 10% FBS. MCF7 cells were maintained in modified Eagle’s medium (MEM) plus 10% FBS plus 1 mM sodium pyruvate plus 10 mg/ml bovine insulin. BT20 cells were maintained in MEM plus 10% FBS.
MTT cell proliferation assay MATERIALS AND METHODS Materials Rabbit antihuman Stat1, IRF-1, or IRF-2 antibodies (Santa Cruz Biotechnology, Sant Cruz, CA) were used for detection in histologic studies, Western analysis, and electrophoretic mobility shift assay (EMSA) studies. For histologic detection, rhodamine red-X goat antirabbit secondary antibody was used. All other materials were from Sigma Chemical (St. Louis, MO) unless otherwise noted.
The MTT cell proliferation assay was described previously.(4) Briefly, 2 3 103 cells were plated in 200 ml appropriate medium into the wells of 96-well plates, in the presence or absence of 100 U/ml of recombinant human IFN-g (rHuIFN-g) (PharMingen, San Diego,CA) and incubated at 37°C. MTT (20 ml/well) (5 mg/ml) (Sigma) was added to triplicate wells at various times (0–9 days). After 24 h of incubation with MTT, the medium was removed, and the formazan crystals were allowed to air dry before being dissolved in mineral oil (50 ml/well) (Schnucks Markets, Bridgeton, MO). Absorbance was measured at 595 nm on a microplate reader (Bio-Rad, Richmond, CA).
IFN-g SIGNAL TRANSDUCTION IN BREAST CANCER CELLS
Cell extracts Whole cell extracts were obtained from trypsinized subconfluent monolayers of cells and prepared as described by Harada et al.(15) Briefly, pelleted cells were suspended in 4 3 volume of lysis buffer (20 mM HEPES, pH 7.9,1 50 mM NaCl, 10 mM EDTA, 2 mM EGTA, 10 mM molybdate, 10 mM vanadate, 100 mM NaF, 0.1% NP40, 0.5 mM PMSF, 100 mg/ml leupeptin), sonicated for 2 min, then centrifuged at 10,000 rpm for 10 min. The supernatant was used as cell extract.
Western immunoblotting Subconfluent cells were stimulated for various times with IFN-g (100 U/ml), and whole cell protein was isolated as described. The protein concentration was determined by a Brad-
623
ford-based colorimetric assay (Bio-Rad). Equal amounts of protein from the various treatment groups were separated by electrophoresis within an SDS polyacrylamide gel, blotted on nitrocellulose, and then probed with specific antibodies for human Stat1, IRF-1, and IRF-2 (Santa Cruz Biotechnology). The blot was then probed with specific horseradish peroxidase (HRP)linked secondary antibodies and developed using the ECL Developer kit (Amersham Life Science, Arlington Heights, IL).
EMSA Whole cell extracts (15 mg/sample) were mixed with 32P-labeled oligomer (C13 for IRF-1 and IRF-2(16), GRR for Stat1(17); ,1.5 pmol/sample, 50,000–200,000 cpm/sample), 1 mg herring sperm DNA, and 2 mg poly(dI:dC) and incubated at 25°C for 60
FIG. 2. MTT cell proliferation assay. Breast cancer cells (2 3 103) were plated in 96-well plates with or without IFN-g. At various times (0–9 days), 20 ml/well of MTT was added to triplicate wells, stopping further growth. MTT reduction is proportional to the viable cell number. At the end of the experiment, the resulting formazan crystals were dissolved in mineral oil, and the density was measured at 595 nm. Where standard error bars are not visible, they fall within the symbol.
624
CONNETT ET AL.
FIG. 3. Western blots show that IRF-1 but not IRF-2 was increased in IFN-g-stimulated cell lines. Western blots of SKBR3, MDA468, MCF7, and BT20 whole cell lysates after cells were or were not stimulated with IFN-g (100 U/ml for 6 h). After electrophoresis on 12% polyacrylamide/SDS gels and transfer to nitrocellulose membranes, proteins were probed with anti-IRF-1 antibody (top) or with anti-IRF-2 antibody (bottom). Detection was done using ECL and exposure to ECL Hyperfilm. For optimal detection, 10 mg total protein was loaded at top, and 50 mg total protein was loaded at bottom.
min in a final volume of 10 ml buffer containing 10 mM TrisHCl, pH 7.5, 50 mM NaCl, 1 mM DTT, 1 mM EDTA, and 5% glycerol. Some extracts were preincubated with 1 ml antibody (anti-IRF-1 or anti-IRF-2, 1 mg/ml) at 0°C for 60 min before mixing with oligomer. The IRF-1 antibody is an affinity-purified rabbit polyclonal antibody raised against a peptide representing amino acids 306–325 of the carboxyl-terminus. This antiserum is not cross-reactive with IRF-2 or IFN-stimulated gene factor
3a (ISGF-3a). The IRF-2 antibody is an affinity-purified rabbit polyclonal antibody raised against a peptide corresponding to amino acids 331–348 mapping at the carboxyl-terminus that does not cross-react with IRF-1 or ISGF3a. Because these antibodies are specific for the carboxyl-terminus, they do not interfere with DNA binding and thus can create supershifted complexes on autoradiographs. The samples were run on preelectrophoresed nondenaturing 4% polyacrylamide gels and autoradiographed.
FIG. 4. Stat1 activity is upregulated after IFN-g stimulation. EMSA of SKBR3 (A) and MDA468 (B) whole cell lysates. Extracts were probed with a Stat1-specific 32P-labeled GRR oligomer (A, B, C, D) after stimulation (or not) with IFN-g (100 U/ml) for the indicated times. Some IFN-g-stimulated samples were preincubated with 1 ml anti-Stat1 antibody (lane ss, supershift).
625
IFN-g SIGNAL TRANSDUCTION IN BREAST CANCER CELLS
FIG. 5. EMSA analysis of IRF-1 and IRF-2 response to IFN-g stimulation. Cells were probed for IRF-1 and IRF-2 (A, B, C, D) expression with or without IFN-g (100 U/ml) incubation for 6 h. Whole cell extracts were probed with a 32P-labeled C13 oligomer (part of the DNA binding domain in the promoter region of genes to which IRF-1 and IRF-2 competitively bind). Thus, under conditions of excess 32P-labeled C13 oligomer, both IRF-1 and IRF-2 will bind to the probe. In this experiment, lanes are identified by the band remaining after supershift (ss) with antibody specific to either IRF-1 or IRF-2. Lane 1 in all cell lines is the band remaining after sample has been preincubated with anti-IRF-2. Therefore, the band is IRF-1, as labeled.
Immunohistochemistry (IHC) Cells were grown overnight on chamber slides (Nunc, Inc., Naperville, IL) in appropriate medium for 24 h in a 37°C, sterile incubator. Cells were incubated with or without IFN-g (100 U/ml, 1 h for Stat1, 6 h for IRF-1 and IRF-2), then fixed (10 min) using freshly made 2% paraformaldehyde, and permeabilized (0.3% Triton-X 100, 3 min). Tissues were incubated with a blocking buffer (5% goat serum in 1% bovine serum albumin [BSA] in phosphate-buffered saline [PBS] for 1 h at ambient temperature) to inhibit nonspecific protein binding. Next, tissues were incubated with antibody (overnight at 4°C for Stat1 and for 1 h at ambient temperature for IRF-1 and IRF-2), and the concentration of primary antibody was determined in titration studies. Fluorescent-labeled secondary antibody was routinely added for 30 min at a dilution determined in titration studies. Excess secondary antibody was rinsed off, and a slow-fade mounting medium, Vectashield (Vector Labs, Burlingame, CA), was added. The cells were covered with glass coverslips. Control slides received no primary antibody. Stained cells were viewed, and images were recorded using a Bio-Rad Radiance-
Plus/Nikon E800 Confocal Microscope (excitation 514 nm, emission 570 nm) with LaserSharp 2000 software. Image analysis was made on recorded images by qualitative assessment of random fields to give data on a minimum of 100 cells per slide.
RESULTS Figure 2 shows growth curves for the four breast cancer cell lines focused on in this study, each grown in the presence and absence of IFN-g. IFN-g had no effect on cell growth in SKBR3 and MCF7 cells. BT20 cells showed a maximum of 30% growth inhibition when IFN-g was present. Growth of MDA468 cells was dramatically and rapidly inhibited by IFN-g (8% and 19% inhibition on days 2 and 3, respectively, and 80% inhibition by day 9). To evaluate the integrity of the IFN-g signaling pathway in each of these breast cancer cell lines, we examined Stat1, IRF1, and IRF-2 by Western analysis, EMSA, and confocal microscopy. Figure 3 demonstrates by Western blots that IRF-1 but not IRF-2 protein expression is increased in IFN-g-stimu-
626
CONNETT ET AL. Small amounts of baseline IRF-1 are demonstrated in SKBR3, MDA468, and BT20 cells but not in MCF7 cells, and there is a marked increase in IRF-1 binding to the C13 probe after IFNg stimulation. Faint IRF-2 bands are seen in unstimulated cells. In contrast to IRF-1, IFN-g stimulation does not substantially increase the amount of IRF-2 binding to the probe for any cell line. In these EMSA experiments, an equal amount of cell lysate was loaded in each lane. In all confocal experiments, control slides were run that received no primary antibody. In each experiment, these control slides showed no background binding (results not shown). Confocal micrographs revealed baseline Stat1 expression localized in the cytoplasm in each of the four cell lines (Figs. 6A, 7A, 8A, and 9A). On stimulation with IFN-g, Stat1 relocated in the nucleus in each of the four cell lines (Figs. 6B, 7B, 8B, and 9B), implying phosphorylation and dimerization. This is in agreement with the EMSA results demonstrating binding function (Fig. 4). Although the EMSA results showed that Stat1 can bind to its nuclear consensus sequence, the combination of EMSA and the confocal images showed both Stat1 transport into the nucleus and DNA binding, confirming the func-
FIG. 6. Immunohistochemistry of SKBR3 breast cancer cells in vitro. (A, C, E) Unstimulated cells. (B, D, F) Cells stimulated with IFN-g (100 U/ml for 6 h at 37°C). (A and B ) AntiStat1 antibody. (C and D) Anti-IRF-1 antibody. (E and F) AntiIRF-2 antibody. (A, B, C, D, E, F) Rhodamine red X goat antirabbit IgG secondary antibody. Stimulation of SKBR3 cells with IFN-g caused upregulation and transport to the nucleus of Stat1 in all cells, a mixed nuclear response of IRF-1, and no nuclear IRF-2 detection.
lated cells. IRF-2 appears to be constitutively expressed in all four cell lines at levels less than those for IRF-1 in IFN-g-stimulated cells, or the IRF-2 Western blot is substantially less sensitive than the IRF-1 blot. In fact, in order to detect IRF-2 in Western blots, it was necessary to load 5 times the total protein per lane that was loaded for IRF-1 detection (50 mg vs. 10 mg, respectively). Western results for cells stimulated for 15 and 24 h with IFN-g were similar to the results at 6 h for each respective cell line (data not shown). EMSA analysis of the four cell lines confirms and extends the Western results. Stat1 expression is increased after IFN-g stimulation, and further, this protein has functional activity (implying phosphorylation and dimerization), recognizing and binding to the GRR oligomer, which is part of the consensus promoter sequence recognized by Stat1 (Fig. 4). The specificity of the DNA probe binding is confirmed by the decrease in the Stat1 band when lysates from IFN-g-stimulated cells were preincubated with anti-Stat1 antibody (Fig. 4, supershift [ss] lane). EMSA results are concordant with Western results for IRF-1, demonstrating significant upregulation of IRF-1 expression after IFN-g stimulation in all four cell lines (Fig. 5).
FIG. 7. Immunohistochemistry of MDA468 breast cancer cells in vitro. (A, C, E) Unstimulated cells. (B, D, F) Cells stimulated with IFN-g (100 U/ml for 6 h at 37°C). (A and B) Anti-Stat1 antibody (C and D) Anti-IRF-1 antibody. (E and F) Anti-IRF-2 antibody. (A, B, C, D, E, F) Rhodamine red X goat antirabbit IgG secondary antibody. Stimulation of MDA468 cells with IFN-g caused upregulation and transport to the nucleus of Stat1 and IRF-1 in all cells but no nuclear IRF-2 detection.
IFN-g SIGNAL TRANSDUCTION IN BREAST CANCER CELLS
627
DNA binding but that this IRF-2 did not get transported to the nucleus. Alternatively, the amount of IRF-2 in the nucleus could be below the detection threshold of immunohistochemistry and confocal microscopy. Table 1 summarizes our quantitative analysis of the entire population of cells observed with confocal microscopy for each cell line as a function of stimulation time with IFN-g. BT20 cells were the most enigmatic, showing both Stat1 and IRF-1 staining in the nucleus without IFN-g stimulation. MDA468, SKBR3, and MCF7 did not show any nuclear staining without IFN-g. With IFN-g stimulation, MDA468 cells showed that .80% of the cells had strong nuclear staining for IRF-1, and this pattern did not vary as a function of IFN-g incubation time. Whereas BT20 cells showed 94% of the population to have IRF-1 nuclear staining after 6 h of IFN-g stimulation, these numbers decreased to 60% and 82% after 15 and 24 h, respectively, of IFN-g stimulation. For all the confocal experiments described, control cells with no primary antibody added showed only minimal background staining by secondary antibody (data not shown). In summary, three independent assays detected IFN-g-mediated upregulation of signal transduction proteins in vitro. Fur-
FIG. 8. Immunohistochemistry of MCF7 breast cancer cells in vitro. (A, C, E) Unstimulated cells. (B, D, F) Cells stimulated with IFN-g (100 U/ml for 6 h at 37°C). (A and B) AntiStat1 antibody. (C and D) Anti-IRF-1 antibody. (E and F) AntiIRF-2 antibody. (A, B, C, D, E, F) Rhodamine red X goat anti-rabbit IgG secondary antibody. Stimulation of MCF7 cells with IFN-g caused upregulation and transport to the nucleus of Stat1, a heterogeneous nuclear accumulation of IRF-1, and no nuclear IRF-2 response.
tionality of Stat1 after IFN-g stimulation for each of the four cell lines. IRF-1 was expressed in each of the four cell lines before IFNg stimulation (Figs. 6C, 7C, 8C, and 9C) and was primarily localized diffusely in the cytoplasm. BT20 cells were the exception, with a subpopulation of cells showing nuclear as well as cytoplasmic staining. After IFN-g stimulation, IRF-1 expression was increased in SKBR3 and MDA468 cells and activated in each of the four cell lines, as shown by nuclear translocation (Figs. 6D, 7D, 8D, and 9D). However, there were degrees of expression and translocation, with MDA468 and BT20 demonstrating uniform nuclear staining compared with SKBR3 and MCF7 cells (Table 1). MCF7 cells appeared quite heterogeneous in their IRF-1 expression patterns, with subsets of cells showing little baseline IRF-1 and no nuclear localization (Fig. 8C, D). IRF-2 was present in the cytoplasm of all four cell lines before IFN-g stimulation (Figs. 6E, 7E, 8E, and 9E). No nuclear translocation of IRF-2 was seen in any of the cell lines with IFN-g treatment (Figs. 6F, 7F, 8F, and 9F), suggesting that the IRF-2 by EMSA represented cytoplasmic IRF-2 capable of
FIG. 9. Immunohistochemistry of BT20 breast cancer cells grown in vitro. (A, C, E) Unstimulated control cells. (B, D, F) Cells stimulated with IFN-g (100 U/ml for 6 h at 37°C). (A and B) Anti-Stat1 antibody. (C and D) Anti-IRF-1 antibody. (E and F) Anti-IRF-2 antibody. (A, B, C, D, E, F) Rhodamine red X goat antirabbit IgG secondary antibody. Stimulation of BT20 cells with IFN-g caused upregulation and transport to the nucleus of Stat1 and IRF-1 but not IRF-2.
628
CONNETT ET AL. TABLE 1.
SUMMARY
OF
CONFOCAL MICROSCOPY EXPERIMENTSa,b Time points
0
1h
Cyto 100% cyto
Nucleus NA
IRF-2 MDA468 Stat 1 IRF-1
100% cyto
NA
Cyto 100% cyto
Nucleus NA
IRF-2 MCF7 Stat 1 IRF-1
100% cyto
NA
Cyto 100% cyto
Nucleus NA
IRF-2
100% cyto
NA
30% nuclear 34% cyto 166% nuclear 110% nuclear 100% cyto
100% nuclear NA
SKBR3 Stat 1 IRF-1
BT20c Stat 1 IRF-1 IRF-2
NA
6h
15 h
24 h
35% cyto 65% nuclear 100% cyto
72% cyto 28% nuclear 100% cyto
55% cyto 45% nuclear 100% cyto
19% cyto 81% nuclear 100% cyto
16% cyto 84% nuclear 100% cyto
16% cyto 84% nuclear 100% cyto
64% cyto 36% nuclear 100% cyto
70% cyto 30% nuclear 50% cyto 50% nuclear
61% cyto 39% nuclear 100% cyto
6% cyto
114% nuclear 1180% nuclear 100% cyto
40% cyto
139% nuclear 1121% nuclear 100% cyto
18% cyto
149% nuclear 1133% nuclear 100% cyto
a Summary of the data shown in Figures 6, 7, 8, 9. Staining as described in Materials and Methods. All experiments were performed in duplicate. b The percent of cells reported as cytoplasmic (cyto) staining had no nuclear staining. The percent reported as nuclear had both nuclear and cytoplasmic staining. c In BT20 cells, nuclear staining was not uniform as in the other cell lines, and this heterogeneity is reflected by assigning 1 or 11 to the subpopulations.
ther, confocal microscopy studies have enabled us to document the translocation of specific proteins from the cytoplasm to the nucleus and to obtain an overview of the heterogeneity of responses to IFN-g in cancer cell populations. The heterogeneity of nuclear expression of IRF-1 at 6 h in these cell lines correlated with the in vitro growth sensitivity to IFN-g.
DISCUSSION In addition to its antiviral properties, IFN-g appears to be a pivotal part of the endogenous immune response to tumors. In tumors that become clinically evident, the tumor cells have developed ways to evade the immune response, and among these may be changes in the way that the tumor processes endogenous IFN-g signals. Shankaran et al.(2) demonstrated that carcinogen-induced sarcomas differed between those induced in immunologically intact mice and those induced in mice without either T cells (RAG2 mice) or IFN-g (IFN-g 2 /2 mice) signaling. Not only did the mice that were immunologically impaired develop tumors with greater frequency, but they also developed tumors that lacked resistance to IFN-g-based immunity when transplanted into normal mice. These authors proposed that immunoediting of the tumors induced in the im-
munologically intact mice had made the tumors that did grow resistant to the effects of IFN-g.(2) In contrast, the tumors induced in the RAG2 knockout mice were susceptible to this antitumor immune response in normal mice, presumably because they had never been exposed to the immunologic pressure. We have proposed previously that this immunoediting effect must exist in human tumors, as they generally arise in individuals with intact immune systems and somehow must escape the endogenous immune system, including IFN-g signals, to become clinically evident.(3,18,19) To investigate this, we studied archival human breast tumor specimens to look for evidence of IFN-g signal transduction by evaluating IRF-1 expression. We compared immunohistochemical expression of IRF-1 protein in normal breast tissue, preinvasive breast cancer, and invasive breast cancer(19) and demonstrated by IHC that nearly all normal breast epithelial tissue expressed IRF-1. In contrast, such expression was less frequent in preinvasive cancers and correlated with tumor grade. Invasive cancers expressed IRF-1 even less frequently, as did cancers with lymph node metastases. Based on these findings, we sought in the present study to investigate the signal transduction response to IFN-g in vitro in human breast cancer cell lines, anticipating differences in the way distinct tumor cell lines would process the IFN-g signal. We have evaluated the downstream components of the IFN-g
629
IFN-g SIGNAL TRANSDUCTION IN BREAST CANCER CELLS pathway, starting at Stat1 and working distally to IRF-1 and IRF-2. Stat1 expression and activity appeared to be similar in each of the cell lines. Each of the four tumor lines showed basal cytoplasmic expression of Stat1, with no Stat1 in the nucleus and no binding activity for the GAS consensus sequence. However, each cell line showed a dramatic induction of GAS sequence binding activity within 5 min of IFN-g exposure (EMSA) and translocation of the Stat1 activity to the nucleus (microscopy). These results indicate to us that all these cell lines have intact cell surface receptor complexes and Jak1 and Jak2 kinases that are capable of transducing the IFN-g signal. IRF-1 is the main transcription factor responsible for the promotion of gene transcription by IFN-g. We have shown previously that IRF-1 overexpression in tumor cells has dramatic effects on tumor cell growth both in vitro and in vivo.(20) Overexpression of IRF-1 suppresses the malignant phenotype, dramatically slows cell growth, and can make nonimmunogenic tumors immunogenic, conferring resistance not only to subsequent challenge to the IRF-1-overexpressing tumor but also to the more aggressive and nonimmunogenic parent cell line. For these reasons, we have hypothesized that expression and localization of IRF-1 would be a particularly likely locus for alteration in tumor cells, as diminishing the effects of IRF-1 could produce substantial survival benefits for the tumor. In this study, in general, we found IRF-1 staining at baseline in resting tumor cells but, except for BT20, only in the cytoplasm, and EMSA evaluation showed very little binding activity. Within 6 h of IFN-g stimulation, IRF-1 protein was markedly induced (Western) and located in the nucleus (microscopy), with dramatic increases in the IRF-E binding activity in all cell lines (EMSA). However, there were some significant differences in the uniformity of expression. The techniques that pool tumor cells to demonstrate their responses (Western and EMSA) showed no differences between the cell lines whose growth was affected by IFN-g and those that were not affected. Microscopy revealed, however, that the IRF-1 response to IFNg is heterogeneous in some cell lines. In SKBR3 and MCF7 cell lines, some cells showed dramatic nuclear staining, whereas other cells had little or no IRF-1 in the nucleus. This was in marked contrast to the more homogeneous nuclear staining of MDA468 and BT20 cells. These differences correlated with the growth-inhibitory effects of IFN-g, as the cell lines that responded to IFN-g with dramatic growth slowing (Table 1) had intense and uniform IRF-1 nuclear staining, whereas the cell lines that did not respond had heterogeneous nuclear staining. Only the technique of IHC staining with confocal microscopy was able to delineate these physiologic and population differences. IRF-2 is a protein that has sequence and structural similarities to IRF-1 and binds the same DNA sequence, a segment of the IRF-E. (8–11,15) We have demonstrated previously the in vivo and in vitro tumor-promoting effects of IRF-2 in a murine model, where overexpression of IRF-2 made tumors insensitive to IFN-g growth suppression in vitro and increased tumor growth rate in vivo.(4) This is consistent with other studies that have identified an oncogenic effect of IRF-2.(21) In studies of archival human breast cancer specimens, we found that IRF-2 is infrequently expressed in normal breast tissue (2 of 31 specimens) and that expression increases in frequency in low-grade ductal carcinoma in situ (DCIS) (3 of 11 specimens), high-grade
DCIS (14 of 22 specimens), and invasive carcinoma (28 of 49 specimens),(19) implying that IRF-2 might be involved in the transformation of normal breast epithelium to cancer. We hypothesized that IRF-2 protein levels in the tumor cell lines might be involved in the resistance of cell lines to the effects of induced IRF-1. We did not find convincing evidence of differences in IRF-2 basal expression, induced expression, or localization in these studies. Each cell line has basal IRF-2 expression, and there was not convincing induction of further IRF-2 expression for any of the four cell lines. Confocal microscopy revealed the expression to be mainly cytoplasmic, although there was some nuclear staining as well. Although these investigations did not reveal any differences between the cell lines regarding IRF-2 expression that could explain the spectrum of IFN-g growth effects, the expression of IRF-2 in each tumor line was consistent with our previous studies. In summary, these studies demonstrated the heterogeneity of breast cancer tumor cell responses to IFN-g, both in antiproliferative effects and in the induction of IRF-1. The intactness of the proximal signaling cascade in these cell lines was clear from their robust and uniform activation of Stat1. The differences between the cell lines appeared distal to Stat1, at the level of IRF-1 expression and nuclear translocation, which is heterogeneous in the unresponsive cell lines. IRF-2, although expressed by each of the four cell lines, did not respond significantly in either expression or localization. The root of this heterogeneity of IRF-1 stimulation by IFN-g remains to be explored.
ACKNOWLEDGEMENTS This work was supported by NIH/National Cancer Institute grants CA 73846 (G.M.D.) and CA 09621 (S.R.H.), the Susan Komen Foundation (J.M.C.), the Frank Fund (J.M.C.), and the Breast Health Center Research Fund at Barnes-Jewish Hospital (G.M.D.).
REFERENCES 1. STARK, G. R., KERR, I. M., WILLIAMS, B. R. G., SILVERMAN, R. H., and SCHREIBER, R. D. (1998). How cells respond to interferons. Annu. Rev. Biochem. 67, 227–264. 2. SHANKARAN, V., IKEDA, H., BRUCE, A. T., WHITE, J. M., SWANSON, P. M., OLD, L. J., and SCHREIBER, R. D. (2001). IFN-g and lymphocytes prevent primary tumour development and shape tumour immunogenicity. Nature 410, 1107–1111. 3. DOHERTY, G. M., TSUNG, K., MC CLUSKEY, B., and NORTON, J. A. (1996). Endogenous interferon gamma acts directly on tumor cells in vivo to suppress growth. J. Surg. Res. 64, 68–74. 4. YIM, J. H., WU, S. J., LOWNEY, J. K., VANDER VELDE, T. L., and DOHERTY, G. M. (1999). Enhancing in vivo tumorigenicity of B16 melanoma by overexpressing interferon regulatory factor-2: resistance to endogenous interferon–g. J. Interferon Cytokine Res. 19, 723–729. 5. DIGHE, A. S., RICHARDS, E., OLD, L. J., and SCHREIBER, R. D. (1994). Enhanced in vivo growth and resistance to rejection of tumor cells expressing dominant negative IFN gamma receptors. Immunity 1, 447–456. 6. KAPLAN, D. H., SHANKARAN, V., DIGHE, A., STOCKERT, E., AGUET, M., OLD, L. J., and SCHREIBER, R. D. (1998).
630
7. 8.
9.
10.
11.
12.
13.
14.
15.
CONNETT ET AL. Demonstration of an interferon-g-dependent tumor surveillance system in immunocompetent mice. Proc. Natl. Acad. Sci. USA 95, 7556–7561. TANAKA, N., and TANIGUCHI, T. (2000). The interferon regulatory factors and oncogenesis. Semin. Cancer Biol. 10, 73–81. TANIGUCHI, T., OGASAWARA, K., TAKAOKA, A., and TANAKA, N. (2001). IRF family of transcription factors as regulators of host defense. Annu. Rev. Immunol. 19, 623–655. HARADA, H., FUJITA, T., MIYAMOTO, M., KIMURA, Y., MURAYAMA, M., FURIA, A., MIYATA, T., and TANIGUCHI, T. (1989). Structurally similar but functionally distinct factors, IRF-1 and IRF-2, bind to the same regulatory elements of IFN and IFNinducible genes. Cell 58, 729–739. TANAKA, N., KAWAKAMI, T., and TANIGUCHI, T. (1993). Recognition DNA sequences of interferon regulatory factor 1 (IRF-1) and IRF-2, regulators of cell growth and the interferon system. Mol. Cell. Biol. 13, 4531–4538. HARADA, H., KITAGAWA, M., TANAKA, N., YAMAMOTO, H., HARADA, K., ISHIHARA, M., and TANIGUCHI, T. (1993). Anti-oncogenic and oncogenic potentials of interferon regulatory factors-1 and -2. Science 259, 971–974. HARADA, H., TAKAHASHI, E.-I., ITOH, S., HARADA, K., HORI, T.-A., and TANIGUCHI, T. (1994). Structure and regulation of the human interferon regulatory factor 1 (IRF-1) and IRF-2 genes: implications for a gene network in the interferon system. Mol. Cell. Biol. 14, 1500–1509. MACKEY, T.J., BORKOWSKI, A., AMIN, P., JACOBS, S.C., and KYPRIANOU, N. (1998). Bcl-2/Bax ratio as a predicive marker for therapeutic response to radiotherapy in patients with prostate cancer. Urology 52, 1085–1090. DOHERTY, G. M., McCLUSKEY, B., TSUNG, K., and NORTON, J. A. (1995). Correlation of interferon regulatory factors 1 and 2 (IRF-1 and -2): expression and murine tumor growth in the presence of interferon-gamma. Surg. Forum 46, 544–546. HARADA, H., WILLISON, K., SAKAKIBARA, J., MIYAMOTO, M., FUJITA, T., and TANIGUCHI, T. (1990). Absence of the type 1 IFN system in EC cells: transcriptional activator (IRF-1) and repressor (IRF-2) genes are developmentally regulated. Cell 63, 303–312.
16. FUJITA, T., SHIBUYA, H., HOTTA, H., YAMANISHI, K., and TANIGUCHI, T. (1987). Interferon-beta gene regulation: tandemly repeated sequences of a synthetic 6 bp oligomer function as a virusinducible enhancer. Cell 49, 357–367. 17. BOYOLENTA, C., GASPERINI, S., McDONALD, P. P., and CASSATELLA, M. A. (1998). High affinity receptor for IgG (Fc gamma RI/CD64) gene and Stat protein binding to the IFN-gamma response region (GRR) are regulated differentially in human neutrophils and monocytes by IL-10. J. Immunol. 160, 911–919. 18. LOWNEY, J. K., BOUCHER, L. D., SWANSON, P. E., and DOHERTY, G. M. (1999). Interferon regulatory factor 1 and 2 expression in human melanoma specimens. Ann. Surg. Oncol. 6, 604–608. 19. DOHERTY, G. M., BOUCHER, L., SORENSON, K., and LOWNEY, J. (2001). Interferon regulatory factor expression in human breast cancer. Ann. Surg. 233, 623–629. 20. YIM, J. H., WU, S. J., CASEY, M. J., NORTON, J. A., and DOHERTY, G. M. (1997). Interferon regulatory factor-1 gene transfer into an aggressive, nonimmunogenic sarcoma suppresses the malignant phenotype and enhances immunogenicity in syngeneic mice. J. Immunol. 158, 1284–1292. 21. VAUGHAN, P. S., AZIZ, F., VAN WIJNEN, A. J., WU, S., HARADA, H., TANIGUCHI, T., SOPRANO, K. J., STEIN, J. L., and STEIN, G. S. (1995). Activation of a cell cycle-regulated histone gene by the oncogenic transcription factor IRF-2. Nature 377, 362–365.
Address reprint requests or correspondence to: Dr. Gerard M. Doherty University of Michigan 2920 Taubman Center 1500 East Medical Center Drive Ann Arbor, MI 48109 Tel: (734) 936-5818 Fax: (734) 936-5830 E-mail:
[email protected] Received 4 May 2003/Accepted 9 July 2003
This article has been cited by: 1. Judith M. Connett , Linda Badri , Thomas J. Giordano , William C. Connett , Dr. Gerard M. Doherty . 2005. Interferon Regulatory Factor 1 (IRF-1) and IRF-2 Expression in Breast Cancer Tissue MicroarraysInterferon Regulatory Factor 1 (IRF-1) and IRF-2 Expression in Breast Cancer Tissue Microarrays. Journal of Interferon Cytokine Research 25:10, 587-594. [Abstract] [PDF] [PDF Plus]