Localizing Defects in Multithreaded Programs by Mining Dynamic Call Graphs Frank Eichinger1 , Victor Pankratius1 , Philipp W. L. Große2 , and Klemens B¨ohm1 1
Karlsruhe Institute of Technology (KIT), Germany, {eichinger, victor.pankratius, klemens.boehm}@kit.edu 2 SAP AG, Walldorf, Germany,
[email protected]
Abstract. Writing multithreaded software for multicore computers confronts many developers with the difficulty of finding parallel programming errors. In the past, most parallel debugging techniques have concentrated on finding race conditions due to wrong usage of synchronization constructs. A widely unexplored issue, however, is that a wrong usage of non-parallel programming constructs may also cause wrong parallel application behavior. This paper presents a novel defect-localization technique for multithreaded shared-memory programs that is based on analyzing execution anomalies. Compared to race detectors that report just on wrong synchronization, this method can detect a wider range of defects affecting parallel execution. It works on a condensed representation of the call graphs of multithreaded applications and employs data-mining techniques to locate a method containing a defect. Our results from controlled application experiments show that we found race conditions, but also other programming errors leading to incorrect parallel program behavior. On average, our approach reduced in our benchmark the amount of code to be inspected to just 7.1% of all methods.
1
Introduction
Present-day computers with several cores on a single chip require developers to write multithreaded applications in order to exploit the full performance potential. Compared to sequential software development, programmers are now additionally confronted with nondeterminism and parallel-programming failures, such as race conditions or deadlocks [15, 19]. Today, static and dynamic debugging aids for parallel shared-memory programs are widely available [10, 13, 20, 22, 23, 25, 26]. They focus on identifying atomicity violations, race conditions or deadlocks due to wrong or inconsistent locking. However, these tools are usually heavily specialized on a particular class of parallel programming errors. Little attention has been paid so far to other causes (e.g., originating from non-parallel constructs) that might be incorrectly used to produce wrong parallel program behavior. For example, suppose that a programmer forgets or incorrectly specifies a condition when creating threads in a thread pool. This might lead to an unbounded creation of threads, uncontrolled program behavior and wrong program outputs. Clearly, there is a need
for more general defect localization techniques to fill such gaps. Advances in this area are of great importance for industrial practice. This paper addresses this problem and proposes a novel defect localization technique for multithreaded shared-memory programs. It is designed to detect a wider range of defects that affect parallel execution rather than just race conditions. Our approach is based on analyzing anomalies in program behavior. To this end, we employ a data-mining technique building on call graphs of multithreaded applications. This extends our previous work addressing sequential programs [12]. In particular, we compare the structure of the call graphs and the call frequencies from correct and incorrect program executions to isolate the methods containing defects. We also discuss different call-graph representations for multithreaded programs and develop a solution with edge annotations that is more robust with respect to varying thread schedules and more compact in situations in which different threads execute replicated tasks. Contrary to race detectors that produce many warnings (most of which are false positives) in some arbitrary order, our technique produces a ranking of methods ordered by the likelihood of containing a defect. Our controlled experiments with typical applications show that an upper bound of several hundred program executions is enough to pinpoint the actual defects. In addition, our approach was able to localize a previously unknown (and undocumented) error in an open-source download tool. Paper organization: Section 2 explains the principles of call-graph-based defect localization. Section 3 discusses appropriate extensions for representations of call graphs for multithreaded programs. Section 4 introduces our novel approach to mine these graphs and use the results for defect localization. Section 5 evaluates the approach, and Section 6 gives a detailed illustrative example. Section 7 contrasts our approach to related work, while Section 8 compares our technique to selected alternative approaches. Section 9 provides a conclusion.
2
Dynamic-Call-Graph-Based Defect Localization in Sequential Programs
We distinguish between defects, infections and failures, according to [28]: Defects are the positions in the source code which cause a problem, an infection is an incorrect program state (usually triggered by a defect), and failures are an observable incorrect program behavior (e.g., a user obtains wrong results). For sequential software, Liu et al. [18] and Di Fatta et al. [9] have proposed graph-mining techniques for defect localization, working on call graphs that represent program execution traces. The techniques assume that a collection of test cases is available and that it is possible to decide if a program is executed correctly or not. Both approaches deal with occasional bugs, i.e., defects that lead to both correct and failing executions. In these works, this behavior depends on the input data, but it could be caused by varying thread interleavings, too. Furthermore, they focus on non-crashing bugs.
A detailed survey of call-graph-mining-based defect localization is presented in [11]. The basic idea of most approaches is to mine for patterns in the call graph that are characteristic for incorrect executions. Thereafter, they calculate for each method its likelihood of being defective. The call graphs may become huge, so it is necessary to work on a compact representation. In [12] we observe that the representations in [6, 9, 18] lose the information how many method calls an edge reprsents in the call-graph. We therefore extend the graphs with edge weights representing call frequencies in [12]. We also demonstrate that datamining analyses based on such graphs increase the defect-localization precision and detect defects that other approaches cannot deal with. Other recent approaches introduce call graphs with several granularity levels, instead of one at the level of methods, such as the the basic-block level in [6]. It facilitates more detailed defect localizations. The mentioned sequential techniques cannot be applied to multithreaded software right away, as they do not define call graphs of multithreaded programs. Thus, two extensions are necessary: (1) Find an appropriate graph representation for multithreaded programs, and (2) adapt the mining scheme. We address both issues in the following sections.
3
Dynamic Call Graphs for Multithreaded Programs
We now present the call-graph representation we employ for our technique and contrast it with other possible choices. We also sketch how to generate the call graphs for a multithreaded application.
3.1
Representation of Call Graphs in our Approach
Unreduced call graphs. Call graphs are based on program executions and therefore need to be derived at runtime. Our approach uses call graphs at the granularity level of methods, i.e., nodes refer to methods and edges to method calls. Furthermore, in the multithreaded case, every method can be executed several times in more than one thread. Therefore, in unreduced call graphs, we initially label the nodes with the thread ID as a prefix and with the method name. Figure 1(a) contains an example call graph. This example represents the method calls of a program execution, without any reductions. Reduced call graphs. In our approach, we use a more concise “totally reduced” graph representation without thread IDs. Each method is uniquely represented by exactly one node that does not depend on a thread. We introduce edge weights as in [12] for call frequencies: Every edge weight captures the total number of calls between the methods, represented by two connected nodes. Figure 1(b) shows an example for this representation; it is the reduced version of the call graph in Figure 1(a).
m
T0:m
2 T1:a
T2:a
T0:c
T0:c
a
c 4
T1:b
T1:b
T2:b
T2:b
T0:b
T0:b
2
T1:a
T2:a
T0:c
2
2
T1:b
T2:b
(c)
(b) reduction used T0:m
1 1
2
b
(a) unreduced T0:m
2
m
1 1
2
T1:a
T2:a
T0:c
2
3
1
2
T0:b
T1:b
T2:b
T0:b
(d)
1 1 a
a 2
b
2 c
2 b
2 b
(e)
Fig. 1. Example graphs illustrating alternative choices for call-graph representations.
3.2
Discussion and Comparison of Alternative Representations
Including temporal relationships may cause too much overhead. For the localization of defects in multithreaded software, it seems to be natural to encode temporal information in call graphs, e.g., to tackle race conditions. The call graphs as the one in Figure 1(a) do not encode any order of execution of the different threads and methods. One straight-forward approach to include such information could use temporal edges as in [18]. The problem with this idea, however, is that the overhead to obtain such information is large and requires sophisticated tracing techniques. Furthermore, it may significantly influence program behavior – possibly making a failure disappear. We therefore employ a more lightweight approach without temporal information encoded in the graphs. Uncompressed graphs become too large. Call graphs directly derived from program execution – such as the one in Figure 1(a) – become very large in practice. Even for a small program, the number of method calls can become so large that mining algorithms would not scale. Therefore, a compression is necessary. Figure 1(c) represents the “total reduction” of Figure 1(a), merging all nodes having the same node label. This reduction encodes in the edge weights a part of the information that was previously contained in the graph structure. Thread IDs differ between program runs. Figure 1(c) illustrates a call-graph representation that contains the thread IDs in the node labels. This is awkward, as threads are allocated dynamically by the runtime environment or the operating system; various correct executions could lead to threads with different IDs for
the same method call, even for a program using the same parameters and input data. We therefore would not be able to compare several program executions based on the node labels. Omitting this information would result in the graph shown in Figure 1(e), which is directly derived from the one in Figure 1(c). The effects of replicated tasks and varying thread interleavings must be addressed. Graphs such as the ones in Figure 1(e), (c), and (d) can lead to two problems: (1) They might contain a high degree of redundancy that does not help finding defects. For example, a program using thread pools could have a large number of threads with similar calls due to the execution of replicated tasks (and therefore similar method calls). This typically produces a call graph with several identical and large subtrees, which contain no meaningful information for defect localization. (2) The call frequencies (i.e., the edge weights) might not be useful for defect localization, too. Different execution schedules of the same program can lead to graphs with widely differing edge weights. This can disturb data-mining analyses, as such differences are not related to infections. As an example, think of method a in Figure 1(c) as the run() method, calling the worker task method b, which takes work from a task pool. Sometimes, thread 1 and thread 2 would both call method b twice, as in Figure 1(c). In other cases as in Figure 1(d), depending on the scheduling, thread 1 could call method b three times, while thread 2 would only call it once or vice versa. Based on the observations discussed so far, we decided to use a graph representation that avoids repeated substructures. Furthermore, our representation is robust with respect to thread scheduling. In addition, for graphs such as the one in Figure 1(e), we merge all nodes referring to the same method to a single node. This leads to the representation introduced in Figure 1(b). This representation is robust in the sense that different schedules do not influence the graph structure. The downside of this representation is that graph structures from different executions rarely differ. This makes a structural analysis of the call graphs as in other approaches (e.g., [12]) less promising. To compensate this effect, we encode additional information in the edge weights, which has turned out to be helpful for discovering defective behavior. 3.3
Obtaining the Call Graphs
To generate call graphs for multithreaded applications, we employ AspectJ [17] and use it to weave in tracing functionality into a program. AspectJ has been shown in earlier work to be well-suited for program-trace generation and infection detection in multithreaded programs [7]. AspectJ introduces additional overhead and execution slowdowns; we observed a typical increase in execution time between 50% and 100% for the programs used in our evaluation (see Section 5).
4
Defect Localization in Multithreaded Programs
We first present an overview of the defect-localization procedure and then more details on our data-mining-based technique.
4.1
Overview
Algorithm 1 works with a set T of traces obtained from program executions. A trace is an unreduced call graph where every individual method invocation leads to a new edge and a new node (see Figure 1(a)). Using a test oracle, our algorithm assigns a class (correct or failing) to every trace tj ∈ T . Then, the algorithm reduces every tj to obtain a new call graph, which is assigned to a class of either correct or failing executions. Based on these graphs, the last step calculates for every method mi its likelihood of being defective. The likelihood is used to rank the order of potentially defective methods shown to the software developer.
Algorithm 1 Overview of call-graph-based defect localization. Input: a set of program traces tj ∈ T Output: a method ranking based on each method’s likelihood of being defective P (mi ) 1: G = ∅ // initialize a set of reduced graphs 2: for all traces tj ∈ T do 3: check if tj was a correct execution and assign a class ∈ {correct, failing} to tj 4: G = G ∪ {reduce(t)} 5: end for 6: calculate P (mi ) for all methods mi in G
We employ a test oracle to decide whether a program execution is correct or not (Line 3 in Algorithm 1). Such oracles are specific for the examined program, and their purpose is to decide if a certain execution manifests any observable problems (i.e., a failure). An observable problem can be a wrong output or other erroneous behavior such as a race condition. In this paper, we assume that some kind of test oracle is available. 4.2
Data-Mining-Based Defectiveness-Likelihood Calculation
We now focus on the calculation of the likelihoods of a method being defective (Line 6 in Algorithm 1). The goal is to find out which methods in program’s call graph discriminate best between correct and failing executions. We analyze the edge weights of the call graphs to derive such probabilities and create a feature table containing all edges as columns and all program executions (represented by their reduced call graphs) as rows (see Table 1). For illustration, the first column in Table 1 corresponds to the edge from method a to method b, the second column to the edge from b to c, and the third column represents an edge from a to d. The last column contains the class (correct or failing). The rows correspond to reduced call graphs g1 , ..., gn ∈ G, which are derived from program executions. If a certain edge is not contained in a call graph, the respective cell is 0. For example, graph g2 does not possess edge a → d.
a→b g1 445 g2 128 ··· ···
b→ca→d 445 7 256 0 ··· ···
· · · Class · · · failing · · · correct ··· ···
Table 1. Example of a feature table.
Using this table, we analyze the edge weights. We employ a standard featureselection algorithm to calculate the discriminativeness of the columns of the table and thus of the different edges. In particular, we use the information-gain-ratio measure (GainRatio, see Definition 1) from the Weka machine-learning suite [27]. This measure is frequently used in data analysis, in particular in decision-tree induction [24, 27]. GainRatio reaches 1, its highest value, when an attribute discriminates perfectly between classes; at 0, its lowest value, an attribute does not contribute at all to the discrimination of classes. Definition 1. The information-gain ratio (GainRatio) [24] is a measure based on information gain (InfoGain) [24] and ultimately on entropy (Info): |DC |
Info(D) := −
X |Di | |Di | · log2 ( ) |D| |D| i=1 |DA |
InfoGain(A, D) := Info(D) −
X |Dj | · Info(Dj ) |D| j=1
|DA |
SplitInfo(A, D) := − GainRatio(A, D) :=
X |Dj | |Dj | · log2 ( ) |D| |D| j=1
InfoGain(A, D) SplitInfo(A, D)
where D is a dataset, C is the class of tuples in D, A is an attribute in D, and DC and DA denote the sets of values reached by C and A, respectively. Besides GainRatio, we could choose from a number of different featureselection algorithms, but we know from our previous work (see Section 2) that those based on entropy are well suited for defect localization. Compared to InfoGain, which could be used as well, GainRatio is robust regarding imbalanced class distributions because it normalizes the InfoGain by its SplitInfo [24]. So far, we have derived defect likelihoods for every column in the table, i.e., for edges. However, we are interested in likelihoods for methods mi . As a method can call several other methods, we assign every column to the calling method. We then calculate the method likelihood P (mi ) as the maximum of the gain-ratio values of the columns assigned to method mi . We use the maximum because it refers to a method’s most suspicious invocation. Other invocations are less
important, as they might not be related to a defect. However, the information which specific invocation within method mi is most suspicious (the column with the highest likelihood) can be important for a software developer to find and fix the defect. We therefore report this additional information to the user.
5
Experimental Evaluation
We now present the experimental results to validate our approach. At first, we describe the benchmark programs and their defects, the experimental setting, and the metrics used to interpret the results. Section 8 presents some comparisons to related techniques. 5.1
Benchmark Programs and Defects
Our benchmark contains a range of different multithreaded programs. The benchmark covers a broad range of tasks, from basic sorting algorithms and various client-server settings to memory allocators, which are fundamental constructs in many programs [5]. As our prototype is implemented in AspectJ, all benchmark programs are in Java. Most of these programs have been used in previous studies and were developed in student assignments [14]. We slightly modified some of the programs; for example, in the GarageManager application, we replaced different println() statements with methods containing code simulating the assignment of work to different tasks. Furthermore, we included two typical client-server open-source applications in our benchmark. These programs are larger and represent an important class of real applications. Table 2 lists all programs along with their size in terms of methods and normalized lines of code (LOC)3 .
#M LOC #T Source Description Program AllocationVector (Test) 6 133 2 [14] Allocation of memory 30 475 4 [14] Simulation of a garage GarageManager Liveness (BugGen) 8 120 100 [14] Client-server simulation MergeSort 11 201 4 [14] Recursive sorting implementation ThreadTest 12 101 50 [14] CPU benchmark (random divisions) 122 632 100 [1] HTTP Server Tornado Weblech 88 802 10 [2] Website download/mirror tool Table 2. Programs considered (#M/#T is the number of methods/threads).
The benchmark programs are seeded with known defects to provide examples for different defect patterns. In the two open-source programs, we manually inserted typical synchronization defects. All defects are representative for common multithreaded programming errors (e.g., forgotten synchronization for some 3
We always use the sum of non-blank and non-comment LOC inside method bodies.
variable) and are occasional. The defects cover a broad range of error patterns, such as atomicity violations/race conditions (on one or several correlated variables), deadlocks, but also other kinds of programming errors (e.g., originating from non-parallel constructs) that can influence parallel program behavior. We categorize the defect patterns in the programs of our evaluation as follows (according to the classification in [15]): 1. AllocationVector; defect pattern: “two-stage access”. Two steps of finding and allocating blocks for memory access are not executed atomically, even though the individual steps are synchronized. Thus, two threads might allocate the same memory and cause incorrect interference. 2. GarageManager; defect pattern: “blocking critical section”. The defect itself is a combination of an incorrectly calculated value in some rare cases due to a forgotten switch case. When this situation occurs, no task is assigned to a particular thread, while a global variable is treated as if work had been assigned. Thus, fewer than the maximum number of threads are active. This makes the program deadlock. We illustrate this program in more detail in Section 6. 3. Liveness; defect pattern: similar to the “orphaned thread” pattern. When the maximum number of clients is reached, the next requesting client is added to a stack. Although this data structure and a global counter are synchronized, it can happen that the server becomes available while the client is added to the stack. In this case, the client will never resume and will not finish its task. 4. MergeSort; defect pattern: “two-stage access”. Although methods working on global thread counters are synchronized, the variables themselves are not, which might lead to atomicity violations. In particular, threads ask how many subthreads they are allowed to generate. When two threads apply at the same time, more threads than allowed are generated. This can lead to situations in which parts of the data are not sorted. 5. ThreadTest; defect pattern: “blocking critical section”. The generation of new threads and checking a global variable for the maximum number of currently available threads is not done correctly in case of exceptions, which occur randomly due to divisions by zero. This leads to a deadlock when all threads encounter this situation. We consider an execution as failing when at least one thread encounters this problem, due to lowered performance. 6. Tornado; defect pattern: “no lock”. Synchronization statements are removed in one method. This leads to a race condition and ultimately to unanswered HTTP requests. 7. Weblech; defect pattern: “no lock”. Removed synchronization statements as in Tornado, resulting in Web pages that are not downloaded. For the Weblech program, we have two versions: Weblech.orig and Weblech.inj. In Weblech.inj, we introduced a defect in method run() by removing all synchronized statements (Listing 1 shows an excerpt of this method with one such statement), aiming to simulate a typical programming error. During our
experiments, we realized that the original non-injected version (Weblech.orig) led to failures in very rare cases, too (the failure occurred in only 5 out of 5,000 executions; we used a sample of the correct executions in the experiments). Thus, Weblech.inj contains the original defect besides the injected defects. With our tool, we were able to localize the real defect by investigating two methods only. The result is that two global unsynchronized variables (downloadsInProgress and running) are modified in run(), occasionally causing race conditions. To fix the defect in order to produce a defect-free reference, we added the volatile keyword to the variable declaration in the class header. while ( q u e u e S i z e ( ) > 0 | | d o w n l o a d s I n P r o g r e s s > 0 ) { synchronized ( queue ) { nextURL = queue . getNextInQueue ( ) ; d o w n l o a d s I n P r o g r e s s ++; } } running −−; Listing 1. Method void weblech.spider.run() (shortened to a minimum).
5.2
Experimental Setting
Number of executions. Our defect-localization technique requires that we execute every program several times and that we ensure that there is a sufficiently high number of examples for correct and failing executions. This is necessary since we focus on occasional bugs (see Section 2), i.e., failures whose occurrence depends on input data, random components or non-deterministic thread interleavings. Furthermore, we tried to achieve stable results, i.e., analyzing more executions would not lead to significant changes. We used this criterion to determine the number of required executions, in addition to obtaining enough correct and failing cases. Table 3 lists the number of correct and failing executions for each benchmark program. Varying execution traces. In order to obtain different execution traces from the same program, we rely on the original test cases that are provided in the benchmark suite (e.g., MergeSort comes with a generator creating random arrays as input data). Some programs have an internal random component as part of the program logic, i.e., they automatically lead to varying executions (e.g., GarageManager simulates varying processes in a garage). Other programs produce different executions due to different thread interleavings that can occasionally lead to observable failures. For the two open-source programs, we constructed typical test cases ourselves; for the Tornado web server, we start a number of scripts simultaneously downloading files from the server. For Weblech, we download a number of files from a (defect-free) web server. Test oracles. We use individual test oracles that come with every benchmark program. For the two open-source programs, we compose test oracles that automatically compare the actual output of a program with the expected one. For example, we compare the files downloaded with Weblech with the original ones in the pre-configured list.
Testing environment. We run all experiments on a standard HP workstation with an AMD Athlon 64 X2 dual-core processor 4800+. We employed a standard Sun Java 6 virtual machine on Microsoft Windows XP. 5.3
Accuracy Measures for Defect-Localization Results
First of all, the locations of the actual defects are known, so the report of a method containing a defect can be directly compared to see if this is true or not. If there is more than one location which can be altered to fix a defect, we refer to the position of the first of such methods in the ranking. For cases as in Weblech.orig where the defect can be fixed outside a method body (e.g., in the class header), one can still identify methods that can be altered to fix the erroneous behavior. Our experiments produce ordered lists of methods. In order to evaluate the accuracy of the results, we report the position of the defective method in such a list. This ranking position corresponds to the number of methods a software developer has to review in order to find the defect. If two or more methods have the same likelihood, we use a second static ranking criterion: We sort the methods with the same likelihood by decreasing LOC size. Previous research has shown that the LOC size frequently positively correlates with the likelihood of a method being defective [21]. In order to estimate the effort to find a defect, we compare the ranking position with the total number of methods in a program. In addition to the ranking, we also provide more fine-grained information, such as the suspected call within a method. Another quality criterion is the comparison of our method with the expected value for manual defect localization; in the manual approach, one would expect to find the defect after reviewing about half of the program methods. As method sizes can vary significantly, it is sometimes more appropriate to consider the LOC rather than only the number of involved methods. We therefore provide the percentage of LOC to review as an addition to the ranking position. This is calculated as the ratio of methods that has to be considered in the program, i.e., the sum of LOC of all methods having a ranking position smaller than or equal to the position reported in the table, divided by the total LOC (see Table 2). 5.4
Results
Table 3 shows encouraging results: In all five benchmark programs, the defective method is ranked first. The ranking position is lower only in the two large programs. However, taking the size of these programs into account, the quality of defect localizations is within the same range (see column “LOC to Review”). Overall, the average ranking position for methods containing the defects is 3.3. Nevertheless, as Table 2 shows, a developer only has to review just 7.1% of all methods to find the defects or 23.6% of the normalized source code, which is low. In other words, a developer has to consider in the worst case less than a quarter of the source code of our programs in order to find a defect. This
Executions Defect Localization #correct #failing Ranking Pos. %LOC to Review AllocationVector 383 117 1 17.3% GarageManager 74 26 1 14.2% Liveness 149 53 1 44.2% MergeSort 668 332 1 25.9% ThreadTest 207 193 1 18.8% Tornado 362 8 14 23.3% Weblech.orig 494 5 2 23.3% Weblech.inj 985 15 5 21.8% Program
Table 3. Defect-localization results.
reduces the percentage of methods (code) to review by a factor of seven (code: more than by half) when compared to an average expected amount of 50% of methods (code) to review. Note that these are maximum values: (1) The methods ranked highest are frequently good hints for the defect, even if the defective method itself is ranked lower; (2) usually not all lines of a method need to be reviewed, in particular due to our report which call within a method is most suspicious.
6
A Detailed Example
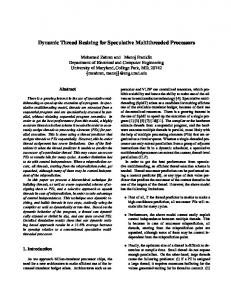
We now illustrate a typical defect and the process of its localization with our approach using excerpts form the GarageManager program [14]: The defect. In our example, the calculation of the taskNumber variable can produce a negative value, which is read in method GoToWork() (see Listing 2) to calculate its modulo-8 value, which is then fed into a switch-case block. This block, however, expects values between 0 and 7. Negative values can result when Java calculates the modulo operation on a negative number. There are two alternative positions where a developer can modify the code to fix the bug: (1) The switch-case block, by adding negative cases or a default case; (2) The parts of the source code where taskNumber is calculated (method SetTaskToWorker()). switch ( taskNumber % 8 ) { case 0 : WorkingOn ( ” f i x g e a r s ” , 2 0 0 0 ) ; break ; case 1 : WorkingOn ( ” change t i r e s ” , 1 4 0 0 ) ; break ; // s i m i l a r f o r c a s e 2 t o 6 . . . case 7 : WorkingOn ( ” work on b r e a k s ” , 2 2 0 0 ) ; break ; } Listing 2. Method void GoToWork() (shortened). From the defect to an infection. We now look at the call graph from a failing execution in more detail, shown in Figure 2. The call of run() generates five threads: Four “worker” threads calling methods WaitForManager(), GoToWork() and PrintCard() and one “manager” thread calling the remaining methods. In WorkingOn() (a defective method), the program state becomes
main 1 GetParametersFromUser 1
1 GiveTasksToWorkers
1
AdjustBugProbability
1 TakeWorkersFromAgency
4
OpenOutputFile
5
1
SetTaskToWorker
GetWorkersNames 1
run 4 WaitForManager
GoToWork
41
4
PrintCard
1
3574
ManagerArrived
3574 PrintOutput
AllWorkersFinished
3
IsManagerArrived
WorkingOn 1
fixGears
4
PrintWorkersNames
changingTires
1
1 workOnBreaks
3 WorkerFinishedTask
Fig. 2. Call graph from a failing GarageManager execution.
infected: Three threads evaluate their switch statement to 0, 1 and 7, but the fourth thread has a negative value, thus causing the thread not to call any further methods. From an infection to a failure. The aforementioned infection causes the fourth thread not to call WorkerFinishedTask(). This method decreases a variable of the global status object. This object is queried by AllWorkersFinished() in method run() (see Listing 3). AllWorkersFinished() will never be true, as status will always indicate that only three out of four “worker” threads have finished their tasks. This causes an infinite loop in run() (we manually stopped the loop after 3,574 iterations). In other words, the infection has caused a deadlock, an observable program behavior, which we consider a failure. s t a t u s . ManagerArrived ( ) ; boolean t a s k s N o t F i n i s h e d = true , p r i n t e d O u t p u t = f a l s e ; while ( t a s k s N o t F i n i s h e d ) { p r i n t e d O u t p u t = PrintOutput ( p r i n t e d O u t p u t ) ; synchronized ( s t a t u s ) { i f ( status . AllWorkersFinished ( ) ) tasksNotFinished = false ; else yield (); } } Listing 3. Method void run() (shortened cutout). Localizing the defect. In our experiments, our approach found the three methods GoToWork(), WorkingOn() and run() (ordered by increasing ranking position) to be most likely defective. Thus, the defect was pinpointed directly.
The high likelihood for WorkingOn() is due to a follow-up infection, as it is always called from GoToWork(). The run() method has a high likelihood as well, caused by the huge number of method calls in the infinite loop (compared to correct executions). Both methods are inherently connected to the defect.
7
Related Work
Defect localization techniques and race detectors are typically classified into static and dynamic techniques. Dynamic race detectors instrument programs and analyze run-time behavior of every thread access to memory. They introduce significant overhead, possibly influencing the program under test in a way that a race condition disappears. Static race detectors investigate the source code only but produce typically large numbers of false-positive warnings. Hybrid approaches [22] and implementations such as the IBM MulticoreSDK [23] try to combine the best of both worlds. FindBugs [4] is a static code-analysis tool. It statically checks Java code for certain patterns of defect-prone artifacts. Although it supports a limited number of defect-prone multithreading-related behaviors, it was not designed for detecting multithreading defects. However, FindBugs complements our approach. Tarantula [16] is a dynamic technique using tracing and visualization. To localize defects, it utilizes a ranking of basic blocks which are executed more often in failing program executions. Though this technique is rather simple, it produces good defect-localization results in the single-threaded case. However, it was not designed for multithreaded programs and causes significant overhead due to its fine-grained tracing. Spectrum-based fault localization techniques as employed in this tool are presented more generally in [3], though with a focus on sequential programs. The approach of [8] is similar to ours, but instead compares method sequence sets (not call graphs) to avoid the thread interleaving problem, however, it produces a more coarse-grain class ranking instead of a method ranking. ConTest [15] executes a multithreaded Java program several times and influences thread schedules by inserting different statements (e.g., sleep()) into a program. Chess [20] works for C# and has a modified scheduler to exhaustively try out different thread interleavings. Given such a technique, a delta-debugging strategy [28] might be used to automatically localize a defect. However, [26] has shown that approaches building on varying thread interleavings and delta debugging do not scale for large software projects. Instead, [26] proposes a featureselection strategy which builds on an approach such as ConTest or Chess and identifies problematic program locations, to avoid scalability problems. In contrast to our approach, the aforementioned tools focus on finding synchronization errors due to wrong usage of parallel constructs, which is a subset of the errors that are detectable by our approach.
8
Result Comparisons with Related Work
Our experiments with the MulticoreSDK applied to all program versions from our evaluation (see Section 5.1) reveal that it is not able find any of the defects. From the eight versions, the MulticoreSDK incorrectly classified seven versions as defect-free, while producing a false-positive warning for the eighth version. We also applied FindBugs to all program versions. The result is that it does not directly pinpoint any of the defects. At the same time, FindBugs produces a number of false-positive warnings: On average, there are 5.4 warnings per program version, distributed over 4.3 different methods. Although the warnings do not pinpoint the defective lines and might therefore be misleading, the defective methods from six out of eight versions are included in the warnings. To find these six defects, a developer would have to consider the source code of all methods that are affected by warnings, which in our case amounts to 35.3% of the code.
9
Conclusions
Debugging multithreaded software is difficult and time-consuming, so any progress in tool support will help reduce costs. Most of the existing parallel debugging tools have concentrated on parallel programming errors such race conditions, but there are several defect patterns that are not in the focus of these tools. In this paper, we have presented a novel defect-localization technique for multithreaded programs to address this problem. We have shown that mining call graphs is an effective approach to detect a wider range of errors with the same tool, including race conditions, deadlocks and errors originating from the wrong usage of non-parallel language constructs. Our case study with different multithreaded programs shows that the defective method can be pinpointed straight away in five of the eight cases, and that on average only 7.1% of all program methods have to be investigated to find a defect. This promises significant reductions in the time developers need for debugging. Acknowledgments We thank Alexander Bieleˇs who helped us with the implementation and the experiments and Shmuel Ur who provided us with the defect benchmark [14].
References 1. Tornado HTTP Server, available at http://tornado.sourceforge.net/. 2. WebLech URL Spider, available at http://weblech.sourceforge.net/. 3. R. Abreu, P. Zoeteweij, and A. J. van Gemund. Spectrum-Based Multiple Fault Localization. In Proc. ASE, 2009. 4. N. Ayewah, D. Hovemeyer, J. D. Morgenthaler, J. Penix, and W. Pugh. Using Static Analysis to Find Bugs. IEEE Softw., 25(5):22–29, 2008. 5. E. D. Berger, K. S. McKinley, R. D. Blumofe, and R. P. Wilson. Hoard: A Scalable Memory Allocator for Multithreaded Applications. SIGPLAN Not., 35(11):117– 128, 2000.
6. H. Cheng, D. Lo, Y. Zhou, X. Wang, and X. Yan. Identifying Bug Signatures Using Discriminative Graph Mining. In Proc. ISSTA, 2009. 7. S. Copty and S. Ur. Multi-threaded Testing with AOP Is Easy, and It Finds Bugs! In Proc. Int. Euro-Par Conf., 2005. 8. V. Dallmeier, C. Lindig, and A. Zeller. Lightweight Defect Localization for Java. In Proc. ECOOP, 2005. 9. G. Di Fatta, S. Leue, and E. Stegantova. Discriminative Pattern Mining in Software Fault Detection. In Proc. Int. Workshop on Software Quality Assurance, 2006. 10. O. Edelstein, E. Farchi, Y. Nir, G. Ratsaby, and S. Ur. Multithreaded Java Program Test Generation. IBM Syst. J., 41(1):111–125, 2002. 11. F. Eichinger and K. B¨ ohm. Software-Bug Localization with Graph Mining. In C. C. Aggarwal and H. Wang, editors, Managing and Mining Graph Data. Springer, 2010. 12. F. Eichinger, K. B¨ ohm, and M. Huber. Mining Edge-Weighted Call Graphs to Localise Software Bugs. In Proc. European Conf. on Machine Learning and Principles and Practice of Knowledge Discovery in Databases (ECML PKDD), 2008. 13. D. Engler and K. Ashcraft. RacerX: Effective, Static Detection of Race Conditions and Deadlocks. In Proc. Symposium on Operating Systems Principles (SOSP), 2003. 14. Y. Eytani and S. Ur. Compiling a Benchmark of Documented Multi-Threaded Bugs. In Proc. Int. Parallel and Distributed Processing Symposium (IPDPS), 2004. 15. E. Farchi, Y. Nir, and S. Ur. Concurrent Bug Patterns and How to Test Them. In Proc. Int. Parallel and Distributed Processing Symposium (IPDPS), 2003. 16. J. A. Jones, M. J. Harrold, and J. Stasko. Visualization of Test Information to Assist Fault Localization. In Proc. ICSE, 2002. 17. G. Kiczales, E. Hilsdale, J. Hugunin, M. Kersten, J. Palm, and W. G. Griswold. An Overview of AspectJ. In Proc. ECOOP, 2001. 18. C. Liu, X. Yan, H. Yu, J. Han, and P. S. Yu. Mining Behavior Graphs for “Backtrace” of Noncrashing Bugs. In Proc. Int. Conf. on Data Mining (SDM), 2005. 19. S. Lu, S. Park, E. Seo, and Y. Zhou. Learning from Mistakes – A Comprehensive Study on Real World Concurrency Bug Characteristics. SIGARCH Comput. Archit. News, 36(1):329–339, 2008. 20. M. Musuvathi, S. Qadeer, and T. Ball. CHESS: A Systematic Testing Tool for Concurrent Software. Technical Report MSR-TR-2007-149, Microsoft Research. 21. N. Nagappan, T. Ball, and A. Zeller. Mining Metrics to Predict Component Failures. In Proc. ICSE, 2006. 22. R. O’Callahan and J.-D. Choi. Hybrid Dynamic Data Race Detection. SIGPLAN Not., 38(10):167–178, 2003. 23. Y. Qi, R. Das, Z. D. Luo, and M. Trotter. MulticoreSDK: A Practical and Efficient Data Race Detector for Real-World Applications. In Proc. Workshop on Parallel and Distributed Systems, 2009. 24. J. R. Quinlan. C4.5: Programs for Machine Learning. Morgan Kaufmann, 1993. 25. S. Savage, M. Burrows, G. Nelson, P. Sobalvarro, and T. Anderson. Eraser: A Dynamic Data Race Detector for Multi-Threaded Programs. In Proc. Symposium on Operating systems principles (SOSP), 1997. 26. R. Tzoref, S. Ur, and E. Yom-Tov. Instrumenting Where it Hurts – An Automatic Concurrent Debugging Technique. In Proc. ISSTA, 2007. 27. I. H. Witten and E. Frank. Data Mining: Practical Machine Learning Tools and Techniques with Java Implementations. Morgan Kaufmann, 2005. 28. A. Zeller. Why Programs Fail: A Guide to Systematic Debugging. Morgan Kaufmann, 2009.