Locating Key Views for Image Indexing of Spaces Hongyuan Cai
Jiang Yu Zheng
Indiana University Purdue University Indianapolis 723 W. Michigan Street Indianapolis, IN 46202-5132 01-317-469-6872
Indiana University Purdue University Indianapolis 723 W. Michigan Street Indianapolis, IN 46202-5132 01-317-278-2365
[email protected]
[email protected] recent years for increased number of digital cameras, image quality, capacity of storage, and speed for transmission and display. Uploaded community images in many photo service sites have been tagged in maps for exploration of spaces [4,20]. Where to take images is empirical and relies on scenes of interest and artistic sense of users. Taking images pervasively in a space is not always possible for the infinite number of viewpoints and is sometimes unnecessary for redundant scene coverage.
ABSTRACT Image is a dominant medium for visualizing spatial environment and creating virtual access on the Internet. Where to capture images is however subjective and relies on artistic sense of photographers so far. In this paper, we will not only visualize areas with images, but also determine where the most distinct viewpoints should be located. Starting from elevation data of an area, we present spatial and content information in ground based images such that (1) a given number of images can have maximum coverage on informative scenes; (2) a sequence of views can be concatenated with minimum continuity along mostexposed-paths. According to scene visibility, continuity, and data redundancy we evaluate viewpoints numerically with an objectemitting illumination model. Our view exploration may eventually reduce data to archive and transmit, facilitate image acquisition, indexing and interaction, and enhance human perception of spaces. Real images are captured based on our planned key positions to form a visual network to index the area.
On the other hand, efforts to archive large spaces systematically and completely with images have been made [24,26]. Visual spaces can thus be retrieved pervasively, which has a great value for disaster management, virtual navigation, geo-reference, etc. View selection problem becomes critical in such a system for image acquisition, indexing, and retrieval. We investigate the viewpoint allocation problem in a large area either for archiving scenes or for setting surveillance cameras. Key views that can present similar scenes in surrounding regions are effective for new visitors to access the area. Moreover, clickable image regions can be generated for indexing detailed information [22], and dynamic events can be monitored remotely via wireless transmission [27].
Categories and Subject Descriptors H.2.4 [Database Management]: Systems - multimedia database. H.2.8 [Database Management]: Database Applications - Image databases, spatial databases and GIS. H.4.3 [Information Systems Applications]: Communications Applications Information browsers. I.3.7 [Computer Graphics]: ThreeDimensional Graphics and Realism- Virtual Reality. I.4.1 [Image Processing and Computer Vision]: Digitization and Image Capture – Imaging, geometry, sampling.
Because millions of images can be taken at infinitively dense positions and fine orientations in a high frequency, one has to assess the redundancy of pixels for indexing a space. Images can have similarity and difference in (a) color and signal level, (b) orientation and frame level, (c) position, motion, disparity, and 3D level, (d) visibility, occlusion, and scene coverage level, (e) dynamic object and event level, (f) time, day and night, season level, and (g) semantic, symbolic, and artistic level. Related works include a sea of images proposed by Aliaga et. al. [10] in an indoor environment and data compressed at a signal level; Panoramas [1,2], omni-directional image [8,13], and spherical views [3,16] removed the view difference at orientation and trim level. Along transitional spaces, parallel-perspective route panoramas [18,26], X-slit images [23], and multi-perspective views [19] provide continuous scenes. Snavely et. al. [20] has associated a collection of sightseeing images and recovered the 3D structures for photo tour, which is at position and disparity level. Google Street View has recorded panoramas in major US cities [24], organized at semantic and symbolic level.
General Terms Algorithms, Management, Measurement, Documentation, Performance, Design, Experimentation, Human Factors.
Keywords Spatial visualization, key view, panorama, image indexing, virtual environments, camera placement, visibility
1. INTRODUCTION Although numerous 3D approaches have been developed for spatial visualization, huge numbers of 2D images have been taken
This work analyzes the relation of images at visibility level. The key views will be planned to guide camera work so as to achieve a proper data size of image-base and continuity in virtual tour design. For a limited number of images, they should include as many scenes as possible to emphasize spatial layouts for viewer’s spatial perception, and facilitate image indexing for flexible interaction as well. We first estimate view significance in a large area for key view selection or capturing images at evaluated locations. Such planned views can deliver spatial information
Permission to make digital or hard copies of all or part of this work for personal or classroom use is granted without fee provided that copies are not made or distributed for profit or commercial advantage and that copies bear this notice and the full citation on the first page. To copy otherwise, or republish, to post on servers or to redistribute to lists, requires prior specific permission and/or a fee. MIR’08, October 30–31, 2008, Vancouver, British Columbia, Canada. Copyright 2008 ACM 978-1-60558-312-9/08/10...$5.00.
31
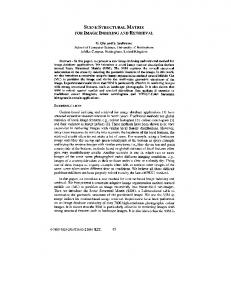
many 3D surfaces as possible such that viewers can understand his/her location by referring to the captured scene layout; (ii) consecutive points along walkthrough paths should share appropriate portions of scenes in order to enhance the perception of spaces in a virtual environment; (iii) the key view selection should reflect spots of interest to facilitate visual indexing and retrieval via clickable regions and embedded links in a multimedia system. We start from a coarse elevation map [25] obtained from LiDAR data or map services (Figure. 1), and compute a view significance measure at all reachable positions. This measure also takes semantic information into account after specifying weights of importance on 3D surfaces. Based on this local measure, we further investigate global relations of viewpoints to guarantee the novelty of an added viewpoint. Moreover, for any two given positions, we find a path connecting them with the optimal view significance and, then, find viewpoints satisfying a minimum scene overlap requirement. Further, to verify the planned viewpoints, we capture real panoramas to form a virtual traversing system on the web.
Figure 1. Elevation maps of an urban area from LiDAR data effectively with less redundant data. Our key views are not evenly distributed in spaces for two observations: (1) different viewpoints have different scopes of scene coverage; (2) a shift of viewpoint yields varied motion parallax and scene overlaps due to scene depths. These effects allow us to select less redundant yet more representative views, while keeping a certain degree of continuity among images for navigation.
In the following, we discuss the view significance measure in Section 2 and propose an illumination model from planar light sources. Section 3 discusses the key view selection obtaining representative views, which produces discrete viewpoints from infinitely dense field. Section 4 shows the selection of a view
Different from previous works, our key view planning may answer questions such as where the most distinct viewpoints are and how the most exposed paths can be connected in an area. The criteria for selecting key views are: (i) each view should cover as
(a)
(b)
(d)
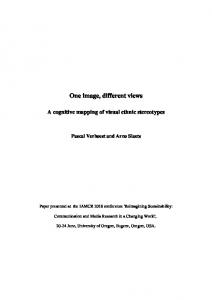
(c) (e) Figure 2. Depth maps of viewpoints generated from LiDAR Data. (a) Satellite image of an area about 700×600m2. (b) LiDAR elevation map of 360×300 pixels: intensity represents building height. (c) A hemisphere view at a point. (d,e) Depth of panoramas generated from viewpoints at a street corner and a parking lot. The intensity represents the depth from viewpoint.
32
path while keeping a minimum sharing of scenes at consecutive viewpoints. Section 5 introduces a trial to capture real panorama images and the experimental results.
σ (P ) =
2 π π /2
∫ π∫
0 - /2
λ (φ , ϕ )
D( φ , ϕ ) dφdϕ D (φ , ϕ ) + D 0
where D0 is a large constant (e.g., 100m) and the denominator counts for the degradation of image contrast on distant scenes due to atmospheric haze. It discounts a close-to-infinity scene to be integrated into σ(P).
2. VIEW EVALUATION 2.1 Panorama Images for Scene Archiving There are many parameters such as location, viewing angle, focal length, and resolution that can be taken into consideration in shooting photographs. Modeling all these parameters and optimizing them have a big order of complexity. In fact, the parameter selection is not only related to the Field of View (FOV) of a camera, but also related to targets of interest. For a particular scene, direction of a photo is more important than shooting distance and position, because distance can be compensated with a zoom lens or high resolution images. Although an aspect view of an object can record shape and color, and highlight details, it usually does not show the real object size and spatial location in its environment, which are important in navigation and virtual tour.
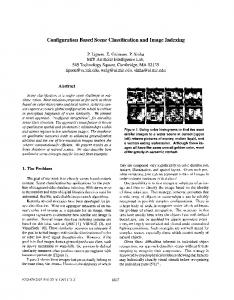
Figure 3 shows the view significance maps evaluated for structures in the urban area of Figure 2. One can notice the influence from streets, high rises and open spaces. In general, σ(P) is high at a wide site surrounded with rich scenes. The calculation here treats all visible surfaces equally; the result of σ(P) is purely based on shapes and layouts of scenes. Although a spherical view covers entire of high rise even it is placed at bottom of building, the captured view can be severely distorted for its steep viewing angle.
2.3 A Lighting Model for View Significances In presenting a real space, images are usually chosen to cover landmarks, cultural and historic sites, beautiful architecture, decorations, etc. To take these factors into account, we assign different weights to surfaces for the view significance evaluation, in addition to the visibility evaluation. The weights can be assigned manually in the map. As shown in Table 1, monuments, museums, and stations can receive higher weights than storage houses or office buildings. The weight is assigned building-wise in the space, unless some important facades or landmarks need to be emphasized particularly. Alternatively, we can assign high weights on trees and lawns if we are capturing images of green areas or ecology trails. Further, we can assign a river with a high value for setting surveillance cameras to monitor flood. The weight of importance thus incorporates functions and semantic information into the view evaluation and selection framework.
In this paper, we reduce those factors to basic ones – the viewpoint and FOV. We take high resolution panoramas at evaluated locations since (a) the scene continuity in orientations is greatly improved from normal discrete images; (b) images facing various directions can be generated from panoramas; (c) final images with a fixed resolution on the web or a multimedia window can be scaled from panoramas. To obtain panoramas, a fish-eye camera capturing hemispherical images can be used [14]. The images can be converted to cylindrical panoramas or discrete images easily. Other sensors such as omni-directional sensors [13] and LadyBug camera [11] are also good choices for obtaining spherical and cylindrical images.
2.2 View Significance from Scene Coverage The criteria for evaluating a viewpoint at a reachable place at eyelevel are to cover large 3D surfaces roughly, and take importance of scenes into consideration. Compared to an overhead image, ground-based-images capture more vertical surfaces and details in an area. Intuitively, a view with large portions at horizon is not as visually significant as a view with full of objects in conveying location information. Similarly, a view with a large sight from an overlook is more significant than a view from a narrow street in telling global location.
We propose a computing model to modify the view significance measure. Scenes have different irradiances illuminating reachable ground viewpoints. Each building plane is a planar light source with the intensity corresponding to its weight of importance. View significance σ(P) at viewpoint P is the accumulation of light from all visible points on the scene surfaces.
Our view significance is based on how large 3D surfaces an image can cover, which is measured in an area (for example, in Figure 2a) using its elevation data (Figure 2b). We compute the area of 3D surfaces covered by a panorama for the view significance. Let P(X, Y, Z) donate a position in a space and H(P)=Y is its height in the elevation map. We obtain ground reachable positions. Denoting 3D surfaces visible from P as Si, i=1, 2, 3 ...m, and Si ∉ sky, we calculate the visible point set from P as the union of Si
S (P ) =
U
m i =1
Si (P )
(2)
(1)
Denote a ray from P by r(φ, φ) stretching in orientation φ∈[0, 2π] and azimuth angle φ∈[-π/2, π/2] (also see Figure 2c). If r hits a surface at distance D(φ,φ), a sign function, λ(φ,φ), takes value 1 and otherwise 0. A viewpoint can have a depth map as in Figure 2de. The small area covered by a ray is then D(φ,φ)dφdφ. We define view significance σ(P) to be the area of S accumulated by
Figure 3. View significance at all positions in an area is displayed in leveled intensity.
33
(a) (b) Figure 4. View significances from weighted scenes. Cyan intensity shows σ distribution and red intensity indicates the weight of importance. (a) Several landmarks weighted high and σ distribution is dominated by these strong light sources; (b) Leveled σ distribution from landmarks, public facilities, and a commercial street. Table 1. An example of assigning weights to scene units. Type of scenes
σ (P) = ∫∫
S(P)
Weight
Landmarks (monument, highest building in town, etc.)
200
Cultural / sightseeing spots (museum, concert hall, etc.)
150
Commercial buildings (hotel, store, restaurant, etc.)
100
Office buildings
50
Park, green area
30
Ground, road, parking lot
1
w λ (φ , ϕ )
= ∑ i=1 ∫∫ w i λ (φ , ϕ ) n
Si
D(φ , ϕ ) d φd ϕ D (φ , ϕ ) + D0
(3)
n D(φ , ϕ ) dφdϕ = ∑ i =1 σ i (P) D (φ , ϕ ) + D0
As shown in Figure 4a, important landmarks with high weights emit strong light to their surroundings. The ground regions in the view significance map are illuminated by such strong “light sources” and even produce “shadows” behind low buildings and trees. Figure 4b shows another example that assigns weights on buildings along a commercial street and sightseeing attractions. The view significance is changed in the resulting distribution.
Assume building i, i=1 ... n, has intensity wi on all of its surfaces. The computation of σ(P) is then
The computation of σ(P) from different buildings is additive; changing wi on building i only varies σi(P), which can be generated locally and then added to σ(P) distribution. This allows the update of σ(P) field in an inexpensive way.
3. KEY VIEW BASED INDEXING 3.1 Selecting Representative Views For visual access of spaces on the web, two approaches are normally employed. One is traversing spaces across neighbors in a network of images with the same resolution (e.g., map access), and another is in-depth exploration in coarse-to-fine resolution. Different from a spatial map with a fixed resolution and street views with constant intervals [24], our view network is constructed with non-uniformed intervals according to the coverage of views. Our hierarchy of viewpoints is ranked according to the view importance. The view significance measure can lead to proper allocation of key views for distinct scenes, which can yield an efficient image index. Besides the view significance, another important parameter is the scene overlap between neighboring viewpoints. It can control viewpoint intervals and density view network. Although the motion parallax or disparity is an even finer property between images, we only measure the scene overlap briefly because our static views are largely separated and acquired images are not redundant as a video. A proper amount of scene overlap can
Figure 5. Relation of viewpoints. Selected key views are marked with circles and their radii are proportional to the view significances. Blue points (at ends of red lines) are peak candidates, but not selected as key views because of their large scene overlaps with the selected ones. The amount of overlap is illustrated in red intensity of line connecting peak candidates.
34
maintain the continuity in traveling the view network and avoid spending data on nearly identical scenes as well. We select viewpoints V={P1,P2,…, Pk , …, Pm) for key views as follows. To avoid examining vast number of the candidates and ensure a good visibility, we extract peaks in σ(P) in order of view significance, starting from the maximum σ(P). As a level δ lowers down, more peaks emerge and some nearby peaks may share a large portion of scenes. Therefore, we enforce a new viewpoint to have a scene overlap less than threshold α with selected ones. Peak Pk+1 is selected as a viewpoint if it has more than (1-α)% new scenes. Assuming the projected area of S in panorama at P is A(S), the condition for scene overlapping is then E (P) =
U
k j =1
A ( S ( P j ) ∩ S ( P )) A ( S ( P ))
Figure 6. One possible framework of visual retrieval β , if P ∈ R β ( Pj )
(6)
(a) (b) Figure 8. Viewpoints that have scene overlaps Figure 7. Optimal paths from a starting position (lower left corner) to three more than β% with designated positions (red destinations, respectively. (a) The most exposed paths. (b) The most hidden dots) are collected as regions. paths. As shown in Figure 8, such regions with minimum scene overlaps model, the irradiance is deducted by 1/D2 in quadric manner as the are associated to two designated viewpoints. Yellow regions have distance increases. The image sharpness has a larger decay with more than 50% scene overlaps with red positions. The additional respect to the viewing distance. Thus, key views may be planned green regions guarantee 30%. It is obvious that a shift of at close ranges to scenes in order to gain resolution, depending on viewpoint in an open area has less view changes than in a narrow whether images are for location guidance or for arts and street. architecture appreciation. To assign a small number of viewpoints along a path while maintaining the continuity between images, we combine the most exposed path and the scene overlap condition. From each selected viewpoint, the algorithm searches along the path and picks the farthest location that satisfies the overlapping constraint as next viewpoint. These selected viewpoints lead to minimum number of images on the path with non-uniformed intervals.
Real key views are taken as panoramas at the planned positions to constructing a visual network of the area as shown in Figure 9. The panoramic images are consistent with the predicted depth images from H(X,Z) except on trees and vehicles, while the real images have much higher resolutions than depth images. The key views are selected from ranked peaks in the view significance distribution. The scene overlap of each key view with previously selected ones are calculated and displayed in red. Because of the large coverage of scenes in the key panoramas, many regions can be embedded into them for clicking and linking. A visual index can be established from a key panorama to detailed spaces and neighboring spaces.
5. EXPERIMENTS The cost computation of the methods is in estimating depth and view overlaps by stretching rays. However, the total time is about ten several minutes with current PC. Although modeling buildings with patches may reduce the ray computation, no depth is provided in such method so that the overlap computation will be difficult. On the other hand, the illuminating model with planar light sources on buildings can help the view significance computation with graphics hardware.
As shown in Table 2, the change of overlap threshold does not affect the number of images dramatically in our results; meaning that the distinct views are stable and a significant reduction of images have been achieved. Users can cut off the number of key views accordingly.
Because the algorithms work on close-to-raw sensor data, there is no surface patch needed to be formed. We calculate a continuous σ(P) field using elevation map H(X,Z). LiDAR data are reduced in resolution to such a map first. At each small grid region (e.g., 5m2), non-zero elevation points are median-filtered to yield an integer value in metrics H(X,Z). Second, all reachable points at eye-level are marked, if Y>0. Third, we compute rays in all orientations from P(X,Y,Z), until they hit obstacles. The front tip P1(X1,Y1,Z1) of the ray satisfies Y1