Logging Kernel Events on Clusters J urgen Reuter and Walter F. Tichy
Institut f ur Programmstrukturen und Datenorganisation Fakult at f ur Informatik Universit at Karlsruhe, 76128 Karlsruhe, Germany
freuter,
[email protected] http://www.ipd.uka.de/~freuter,tichyg/
Abstract. We present tools for recording and analysing kernel events on Linux clusters. The tools provide cluster-wide event logging at system clock accuracy. We demonstrate the usefulness of our tools by verifying an implementation of a simple remote scheduling feature and present interesting results regarding schedule responsiveness. With our GUI-based Java application, data recorded on multiple hosts is integrated for visualization. These tools can be used for analysis of cluster schedulers such as gang schedulers, cooperative cacheing, network RAM drivers, or parallel ÿle systems.
1
Introduction
Tracking and analysing events on computer clusters is essential for understanding and improving crucial aspects of cluster operating systems, such as gang scheduling, synchronization, parallel ÿle access, managing network RAM, or cooperative cacheing. We provide a set of tools that collect and display kernel events on clusters of Linux computers. The events are logged by kernel modiÿcations on each node individually and integrated in a cluster-wide view for analysis. Our current implementation captures scheduling events and is intended to help understand gang scheduling strategies. Other events can also be captured, such as block lookup and eviction requests in cacheing policies of network RAM systems on globally coordinated cluster caches. Similarly, collecting and analysing information regarding parallel access to ÿles may help choose proper policies for I/O scheduling, cacheing and prefetching. Our event recording approach achieves system clock resolution.
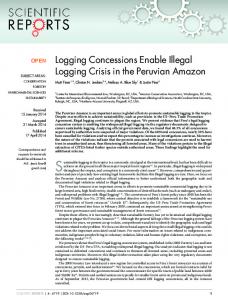
Data Collection
Trace File
Data Analysis
Analysed File
Fig. 1. General Performance Analysis Approach
P.M.A. Sloot et al. (Eds.): ICCS 2003, LNCS 2660, pp. 63−72, 2003. Springer-Verlag Berlin Heidelberg 2003
Display
64
J. Reuter and W.F. Tichy Traditionally, post-mortem performance analysis follows a pattern as shown
in Figure 1. The ÿrst step is to collect data, which can be done in manifold ways. For example, user applications can be instrumented, i.e. additional code may be inserted at selected locations in the application such that when execution comes across such location, timestamp and program status information is recorded and appended to a logÿle. This way, the logÿle subsumes a trace of selectively recorded events in the course of program execution. Rather than inserting code for instrumentation into a user application, one can also insert such code at relevant locations of underlying libraries. For example, by instrumenting a communication library such as PVM[10] or MPI[5], one can track the communication pattern of a user application that uses the library, but may not be able to ÿnd bottlenecks in the communication itself. Our approach is to instrument selected locations of the OS kernel, gaining a better understanding of speciÿc performance issues in the cooperation between the kernel and user applications.
Hostname, Processor ID
Task Switch
Zoom
Time Lines Fig. 2.
Data Visualization Tool
The second step in the course of post-mortem performance analysis, the data analysis, consists in ÿltering events, as well as computing some statistics. The third step is to display the results of the analysis. We integrated these ÿnal two steps into a single Java application with a graphical user interface. Data display is based on showing events on per-processor time lines, as shown in Figure 2. The remainder of this paper is organized as follows: Section 2 gives an overview of the kernel modiÿcations and a companian user level application to record event data. In Section 3, we present the visualization tool for analysing and displaying the data. As an example of usage, in Section 4 we show how we evaluated the performance of a remote scheduling feature with our tools. Section 5 discusses some limitations of our current design and presents possible solutions that we envision for the future. In Section 6, we compare our work with related approaches. Section 7 summarizes the results of this work.
Logging Kernel Events on Clusters
65
2 Data Collection The data collection process is realized by recording local time and type of kernel events through instrumentation of the kernel. Our work focuses on instrumenting selected locations in the kernel code rather than instrumenting user level applications. With this approach, we can eÆciently log data that is gathered in the kernel without suÿering from the additional overhead of switching between kernel and user mode. The possibly most important type of event and relevant motivation for this work is the point of time when the kernel, while executing the
schedule() function,
decides to switch from one task to another one. Similarly,
we may want for example to observe when an ICMP message arrives from the network, or how much time the kernel spends in a particular servicing routine, e.g. by recording when the kernel enters and leaves bottom halves1 as part of the
do softirq() kernel function.
For this purpose, we provide a framework consisting of kernel code (based on modiþcations of a SuSE 8.0 Linux 2.4.18 kernel) that allows for recording such events, and a user level application that is responsible for saving the data to disk. This framework follows the producer-consumer paradigm, but is relaxed in the sense that the producer can not block, but will rather discard data when its buÿer overýows. From the perspective of the kernel code to be instrumented, we simply
evtlog put(struct evtlog entry t *entry, int/*bool*/ fill in time), where struct evtlog entry t entry consists of
provide a new kernel function
an event id, a timestamp and 8 bytes of event speciþc data. Depending on the boolean ýag, the timestamp is either provided by the caller or automatically þlled in by calling
do gettimeofday().
Upon calling
evtlog put(),
a copy of
the struct is saved in a kernel memory buÿer. The function is designed to return quickly, such that the overhead of recording does not aÿect the collected data too much. Therefore, when the buÿer is about to overýow, it does not try to save the data to disk by itself. Instead, the kernel function wakes up a dedicated user level process that is responsible for fetching the data from the kernel and saving it to disk. Figure 3 illustrates the interactions between the kernel logger code and the user level logging process. It shows an SMP machine with two processors. The left side represents the kernel logger code, the right side the dedicated user level
logger process. The user level logging process sleeps by invoking pause(), waiting to be notiþed by the kernel upon arrival of log data. For each processor, the kernel logger code provides memory for two buÿers. Upon invocation, the kernel logging function writes any event data into the þrst buÿer of the currently executing processor. When this buÿer is full, it swaps the two buÿers by exchanging pointer references, then makes the user level logging process runnable by calling the kernel function 1
wake up process(), and þnally returns to the caller. Eventually,
Under Linux, a
bottom half
designates the non-critical part of an interrupt handler
that is not executed immediately when the interrupt occurs, but is delayed until all time critical code has been executed.
66
J. Reuter and W.F. Tichy
Kernel
User Level
Swap Buffers
/proc/sys/evtlog/cpu0
CPU 0
wake_up_process()
schedule() do_softirq() icmp_sched_pin() buffer size, buffer seq id, start/stop seq id
Logger Swap Buffers CPU 1
HDD
schedule() do_softirq() icmp_sched_pin()
/proc/sys/evtlog/cpu1
Fig. 3. Interactions between kernel logging code and user level logging process
the kernel scheduler will switch to the user level logging process, since it is now runnable. The user level logging process then looks for any data available for any processor from the kernel logger, fetches it, writes it to disk, and puts itself back to sleep by invoking
pause()
once again. In the current implementation,
the data is transferred from kernel to user space by copying it in the course of reading from a dedicated ÿle in the
/proc2
ÿlesystem, such that user level
applications can initiate read or write access ÿlesystem. When reading from this ÿle, a boolean þag is reset in the kernel, telling it that the buýers may be swapped once again. A future implementation may avoid the extra copy through the
/proc
ÿlesystem by the kernel directly writing the log data into user space
memory that has been allocated by the user level logging process. The user level logging process has to announce itself to the kernel such that the kernel logger code knows which process to wake up upon a full buýer. This is done during startup of the user level logging process through, once more, a special ÿle entry in the
/proc
ÿle system: the user level logging process writes
its own process id to that ÿle. Data may be discarded if the kernel records data faster than the user level logging process is capable of saving, as the process is scheduled a limited amount
2
The Linux kernel provides pseudo ÿle entries in the
/proc
ÿlesystem, such that user
level applications may exchange data with the kernel by writing to or reading from a ÿle in this ÿlesystem.
Logging Kernel Events on Clusters
67
of time only. To be able to detect such data loss, each buÿer contains a perprocessor sequence number which is increased whenever the kernel starts writing a new buÿer. Checking the sequence numbers for completeness is left to the visualization tool, since the logging itself is designed to produce little overhead. Kernel logging can be dynamically turned on and oÿ. This mechanism is also done via the
/proc
þle system by writing to special þles. Whenever kernel
logging is restarted, the user level logging process creates a new log þle on disk and writes subsequent buÿers to it. For that purpose, in addition to the buÿer sequence number, there is also a start/stop sequence number that is incremented each time kernel logging is turned on, such that the user level logging process can determine the correct log þle. This is necessary, since on an SMP machine, the buÿer for one processor may still contain data from an earlier logging phase as compared to another processor. Furthermore, since upon stopping kernel logging all buÿers are ýushed, a third special entry is needed that represents the actual size of the current buÿer. Choosing a null-terminated array for the buÿer implementation is not reasonable, since this would require spending time for scanning through the whole buÿer to determine its size when writing it do disk. With respect to keeping the logging overhead small, the user level logging process just fetches and stores the data in whatever order it retrieves it from the kernel. It only cares for evaluating the start/stop sequence number for writing the data to the correct þle. Since the kernel logger uses per-processor buÿers, on an SMP machine, kernel logging can be performed concurrently among all processors without requiring a time-wasting SMP kernel lock: the kernel logging function accesses always the buÿers of the currently executing processor, thus scaling þne even on fat SMP nodes. Calling the kernel logging function from multiple locations including bottom half code is possible, since the kernel itself is not preemptive, such that calls to the kernel logging function are executed sucessively without overlapping in time. However, with the current implementation, the kernel logging function should not be called from within a hardware interrupt handler, since the handler might have interrupted a pending call of the kernel logging function. Overlapping calls to the kernel logging function eÿectively have the same eÿect as unsynchronized concurrent access to the log buÿers, thereby potentially damaging its consistency. Preventing such a scenario requires additional provision such as queuing logging requests. This may be added in a future version. Our kernel modiþcations include a call to the kernel logging function whenever the Linux scheduler decides to switch to another process on any processor. This way, the processing time of the user level logging process itself is logged and can be used for determining the logging overhead caused by the user level logging process. This includes the time needed for copying the log data from kernel space to user space, since the read access on the
/proc
þle system is executed
in the context of the user level logging process. The overhead in the kernel itself can not be tracked this way. But since the kernel logging function mostly consists of determining the timestamp and writing
68
J. Reuter and W.F. Tichy
a log entry into kernel memory, it can be well estimated by assuming a constant cost of time per log entry for a particular machine. Our experiences suggest that determining the timestamp is a bottleneck, but that obviously depends on the particular hardware. Since logging is performed locally on each node (assuming that the data is written to a local ÿle system), the system scales ÿne with an increasing number of cluster nodes. On fat SMP nodes, writing the data to disk may become a bottleneck (though Linux supports only up to 32 processors). Still, if the logging overhead is roughly the same for all nodes, scheduling all logging processes simultaneously as a gang can be used to minimize the eþect of the logging overhead onto any other processes of the system.
3 Data Analysis and Display The user level logging process creates log data ÿles by retrieving data from the kernel via the
/proc ÿle system and writing it to disk without further processing.
It is the task of separate tools to reorder, ÿlter, evaluate and display the data. For this purpose, we provide a standalone Java application with a graphical user interface. Since it is written in a platform independent manner, it runs on several platforms. This is handy, when, for example, the log data is collected on a Linux cluster, but the perfomance analysis will be done on a separate working station that potentially runs under a diþerent OS. Figure 2 shows a screenshot that depicts typical use of the Java tool. For each processor, grouped on a per host basis, a graphical display panel shows a horizontal time line with the currently running processes displayed in diþerent colors. Some colors are dedicated (black = idle process, red = logger process); all other process are currently mapped to a ÿxed set of colors in a round-robin way, but support for user-deÿned color mappings may be added in a future version. Events are marked as vertical ticks across the time line, using diþerent length and color. The panel's view can be scrolled by either using the scrollbar below the panel or by dragging and dropping its content with the mouse. The latter is handy especially when zooming to high resolution makes the eþect of scrollbar movements too coarse. The zoom of the display can be easily controlled by the logarithmicscaled slider at the right side and allows for zooming from full view to microsecond resolution. Care has been taken to ensure fast and smooth scrolling and zooming by proper design of the data structures for internal log data representation and by cacheing pointers to the data of the currently displayed location.
schedule(), schedule task(),
Display of particular event types (
bottom half
enter/leave, ICMP schedule requests (see Section 4) and other events) can be turned on and oþ. When pointing the mouse cursor on a processor's time line, the ID of the current process (and its name, if available) on that processor is textually displayed at the left side above the display panel. When positioning the mouse cursor on an event tick, additional information about the event such as the event type and its
Logging Kernel Events on Clusters
69
exact time in microsecond resolution are textually shown. Processor utilization, idle time and other general statistics are shown at program startup. Log data from multiple hosts can be gathered via NFS: Each host writes its log ÿle to a local disk, in order to minimize the logging overhead, and exports the directory with this ÿle to the workstation on which the visualization tool is run. The tool may then read all log data from all hosts and display it in a single window. It is capable of displaying a large number of processor time lines, practically limited only by the amount of main memory. If memory is limited, our tool can be run with data of only a selected number of nodes that are of interest for the analysis. Filters for data reduction or extraction and combination of data from multiple processor time lines may be essential for a better understanding of huge amount of data. We are planning to implement such ÿlters and proper visualization in a future version of the tool.
4 Preliminary Experience Originally, our work was motivated by observing and controlling cluster-wide scheduling. For this purpose, we implemented a remote scheduling request feature that, for example, may be used for gang scheduling sets of related tasks of a distributed parallel application in a cluster environment. In our implementation, a host sends a special ICMP[12] message to one or several hosts to select a process group for immediate scheduling. We put additional logic into the ICMP network bottom half code of the Linux kernel such that upon reception of this special ICMP message the priority of the aþected processes is set to the maximal possible value. When all bottom halves have been serviced, the Linux kernel reruns the scheduler, such that the time between receiving the ICMP message and scheduling the proper process is mostly determined by the time for processing all pending bottom halves, provided that the chance for further interrupts to intercept is negligible. On an SMP machine, the incoming ICMP message is processed by a single processor that initiates a reschedule on every other processor via a call to the kernel function
smp send reschedule().
We used our tools to examine how much time is spent from the incoming ICMP message until scheduling the requested processes on all processors. The analysis was performed on a Dual 500MHz Pentium III (Katmai) SMP machine. We naively expected that the processor that handles the incoming ICMP message would perform the requested schedule ÿrst, since the
smp send reschedule()
would take some time before aþecting all other processors. Figure 4 shows a screenshot of our visualization tool that depicts a region of time between a particular receipt of an ICMP message and the resulting task switch. Surprisingly, the processor that handles the incoming ICMP message is often the last one that switches to the requested process. The reason may be that this processor is still in the midst of executing the network bottom half code, while the other processor on our two processor machine receives the reschedule interprocessor signal and almost immediately switches to the requested process. In any case, we could show that, when no further time is spent in servicing
70
J. Reuter and W.F. Tichy Incoming ICMP Detected (Task Switch Request)
Task Switch
Network Handler Bottom Half Fig. 4.
Incoming ICMP message and resulting task switches
other interrupts, on our hardware the reschedule takes eÿect within roughly 10 microseconds after receiving the ICMP message.
5
Future Work
Our approach of instrumenting selected locations in the kernel is essential for performance issues on the OS level. Future versions of our tools may consider more process related data or additional event types. For a comprehensive understanding, one needs insight from the application point of view. For example, better support for MPI applications or multithreaded Java programs is desirable, e.g. in order to recognize threads of execution or process groups and observe eÿects of communication patterns between them. Ideally, one would like to combine our approach with one or more of the many application level oriented performance analysis tools. The process IDs that we record on the OS level oÿer the natural basis for an integration with log þle data collected in user level space. Integration of the data either would be done by a separate tool or integrated into our visualization tool. When combining log þles from multiple hosts into a single display, we assume that all logs were started at the same time and the drift between the clocks is negligible. Otherwise, the display may show a horizontal oÿset error on the time line. Our modiþcations to the kernel allow for broadcasting special ICMP messages that remotely start/stop the logging mechanism, using the same infrastructure as for the remote schedule feature. First experience shows that this way, the skew is not worse than 10 microseconds even via a slow 10 MBit/s Ethernet connection. However, intercepting hardware interrupts may contribute to further delay. To eliminate this source of error, we may follow recent work on network time synchronization[2]. This work shows that with broadcasts, the diÿerence in the arrival time is typically small and OS related skew can be minimized by recording the system clock's current time immediately at interrupt
Logging Kernel Events on Clusters
71
time upon receiption of a packet. Consequently, we would try to record the system time clock upon receipt of an ICMP message as early as possibly and use it as reference start time for the logging process.
6 Related Work Almost all software performance analysis tools that we know of focus on either
gprof[7] and hprof[8] follow the stochastical proÿling approach by interrupting
application or communication library level. The classical UNIX tool the Java tool
program execution in regular intervals and recording program status information such as the current execution stack. DiP[9] is a collection of tools for recording a stream of events at PVM or MPI level by instrumenting the underlying communication library. DiP's visualization tool PARAVER uses time lines for visualization and supports textual and graphical display of user deÿned functions on lists of events. SCALEA[14] supports automatic and manual instrumentation of user level source code, using a novel representation of code regions in the course of call graph analysis that also covers loops, I/O and communication statements. Recent versions of Paradyn[1] also follow the approach of examining call graphs. Paradyn uses dynamic instrumentation to insert and delete measurement instrumentation as a program runs. Visualization under Paradyn is mostly based on statistical diagrams and search history graphs rather than time lines. Due to a growing number of performance analysis tools, some work focuses on standardization. MPI[5] provides a built-in interface for proÿling tools. Similar work has been suggested for OpenMP[11]. JavaPSL[3] is a generic language for describing experiment-related data and performance properties, serving as a substitute for speciÿc log ÿle formats and including data of the experiment's environment. Gerndt et al.[6] present an aproach with automatic performance problem search based on the performance properties speciÿcation language ASL. Tamches and Miller[13] present a framework for dynamically instrumenting the Solaris kernel by performing control þow analysis on the kernel machine code and patching it at runtime. Feng et al.[4] present a system that conceptionally comes pretty close to our approach. Still, their implementation diýers in some important details such as the use of SMP locks which our design avoids.
7 Conclusion In this paper, we presented a set of tools for performance analysis that collects OS level data by instrumenting selected code in the OS kernel. We showed that the logging overhead can be kept small and taken into account in the analysis. Particular challenges and solutions on this approach inlude peculiarities of SMP machines. Using our Java-based visualization tool, we could gain ÿrst experience with our tools upon verifying the eýect of a remote schedule feature that we
72
J. Reuter and W.F. Tichy
implented in the kernel. We discussed how our approach may be combined with user level space performing analysis and how the synchronization of time lines across multiple machines may be further improved. The results of our work are publicly available at
http://www.ipd.uka.de/~reuter/tools/.
References 1. Harold W. Cain, Barton P. Miller, and Brian J.N. Wylie. A callgraph-based search strategy for automated performance diagnosis. In Proc. of Euro-Par 2000 Parallel Processing,
pages 108{122, 2000.
2. Jeremy Elson, Lewis Girod, and Deborah Estrin. Fine-grained network time synchronization using reference broadcasts. In Proc. of the Fifth Symposium on Operating Systems Design and Implementation (OSDI 2002),
Boston, MA., December
2002. 3. Thomas Fahringer and Clÿ ovis Seragiotto Jÿ unior. Modeling and detecting performance problems for distributed and parallel programs with JavaPSL. In Proceedings of the 2001 ACM/IEEE conference on Supercomputing,
November 2001.
4. W. Feng, M. Gardner, and J. Hay. The magnet toolkit: Design, evaluation, and implementation. Journal of Supercomputing, 23(1):67{79, August 2002. 5. Message Passing Interface Forum. June 1995.
MPI: A message-passing interface standard,
http://www.mpi-forum.org/docs/mpi-11.ps.
6. M. Gerndt, A. Schmidt, M. Schulz, and R. Wism uller. Performance analysis for teraþop computers - a distributed automatic approach. In Euromicro Workshop on Parallel, Distributed, and Network-based Processing,
pages 23{30, Gran Canaria,
January 2002. 7. Susan L. Graham, Peter B. Kessler, and Marshall K. McKusick. Gprof: A call graph execution proýler. In Proceedings of the SIGPLAN '82 symposium on Compiler construction,
8. Stuart
pages 120{126, Boston, Massachusetts, United States, June 1982.
Halloway.
Using
HPROF
to
tune
performance,
January
2000.
http://developer.java.sun.com/developer/TechTips/2000/tt0124.html#tip2.
9. Jesÿ us Labarta, Sergi Girona, Vincent Pillet, Toni Cortes, and Luis Gregoris. DiP: A parallel program development environment. In Proc. of the 2nd International Euro-Par Conference,
10. Oak
Ridge
1996.
National
Laboratory.
PVM:
http://www.epm.ornl.gov/pvm/pvm home.html.
Parallel
virtual
machine.
11. Bernd Mohr, Allen D. Malony, Sameer Shende, and Felix Wolf. Towards a performance tool interface for OpenMP: An approach based on directive rewriting. In Proc. of Third European Workshop on OpenMPI (EWOMP 2001), Barcelona, September 2001. 12. John Postel. Request for comments RFC 792: Internet control message protocol, September 1981.
http://www.ietf.org/rfc/rfc0792.txt.
13. Ariel Tamches and Barton P. Miller.
Fine-grained dynamic instrumentation of
commodity operating system kernels. In Proc. of Operating Systems Design and Implementation (OSDI 1999),
1999.
14. Hong-Linh Truong and Thomas Fahringer. SCALEA: A performance analysis tool for distributed and parallel programs. In Proc. of the 8th International Euro-Par Conference, LNCS 2400,
Paderborn, Germany, August 2002.