Sep 13, 2013 - (28) proposed a computational tool for filtering lncRNAs from RNA ..... Comparison of averaged performance of testing validation for .... Other genomic annotations derived from the UCSC Genome Browser database are also ...
Nucleic Acids Research Advance Access published September 13, 2013 Nucleic Acids Research, 2013, 1–18 doi:10.1093/nar/gkt818
Long non-coding RNA identification over mouse brain development by integrative modeling of chromatin and genomic features Jie Lv1, Hongbo Liu1, Zhijun Huang1, Jianzhong Su2, Hongjuan He1, Youcheng Xiu1, Yan Zhang2 and Qiong Wu1,* 1
School of Life Science and Technology, State Key Laboratory of Urban Water Resource and Environment, Harbin Institute of Technology, Harbin 150001, China and 2College of Bioinformatics Science and Technology, Harbin Medical University, Harbin 150081, China
Received April 23, 2013; Revised and Accepted August 21, 2013
ABSTRACT
INTRODUCTION
In silico prediction of genomic long non-coding RNAs (lncRNAs) is prerequisite to the construction and elucidation of non-coding regulatory network. Chromatin modifications marked by chromatin regulators are important epigenetic features, which can be captured by prevailing high-throughput approaches such as ChIP sequencing. We demonstrate that the accuracy of lncRNA predictions can be greatly improved when incorporating highthroughput chromatin modifications over mouse embryonic stem differentiation toward adult Cerebellum by logistic regression with LASSO regularization. The discriminating features include H3K9me3, H3K27ac, H3K4me1, open reading frames and several repeat elements. Importantly, chromatin information is suggested to be complementary to genomic sequence information, highlighting the importance of an integrated model. Applying integrated model, we obtain a list of putative lncRNAs based on uncharacterized fragments from transcriptome assembly. We demonstrate that the putative lncRNAs have regulatory roles in vicinity of known gene loci by expression and Gene Ontology enrichment analysis. We also show that the lncRNA expression specificity can be efficiently modeled by the chromatin data with same developmental stage. The study not only supports the biological hypothesis that chromatin can regulate expression of tissuespecific or developmental stage-specific lncRNAs but also reveals the discriminating features between lncRNA and coding genes, which would guide further lncRNA identifications and characterizations.
The ENCODE and related projects have revealed that the majority of eukaryotic transcripts are non-coding RNAs (1). Within the past few years, non-coding RNAs (ncRNAs) have attracted significant attention with regard to their unbelievably numerous biological roles, highlighting the biological significance of previously ‘overlooked’ RNA reservoir (2). Generally, long non-coding RNAs (lncRNAs) are ncRNAs that are longer than 200 nt and are typically expressed in a developmental stage-specific manner (2). Other criteria have also been used such as open reading frame (ORF) size 35% of its length and with PFAM/tigrfam protein domains were not considered as non-coding genes in Ensembl annotation. Other than electronic annotation, the Ensembl annotation also included Havana manual annotation, suggesting that it was a reliable non-coding and coding annotation source. Sequencing data pre-processing Raw chromatin modification data (FASTQ format) were aligned to the mouse genome (mm9) by BWA software (v0.6.2) while suppressing alignments with >2 mismatches within a read. The aligned data were then normalized by a fixed read number (25 000 000). Exact duplicate tags were removed from each ChIP-seq data set to avoid PCR amplification biases introduced in the sequencing library preparation processes. Visual inspection suggested that the baseline read numbers were generally comparable for all normalized chromatin modification data, diminishing differences between different data. The aligned sequencing data were processed by MACS (42) to produce enriched chromatin domains. In lncRNA expression specificity analysis and the relationships with nearby gene analysis, we also used RNAseq data of the same developmental stages with ChIP-seq data, making it suitable for model construction and testing. Raw paired end RNA-seq FASTQ data were downloaded from GEO with the accession number GSE20851 for ES cell and GSE36025 for E14.5 embryonic brain and adult 8-week CB (43). Raw RNA-seq data were aligned to the mouse genome (mm9) by TopHat software (44), followed by gene expression quantification according to a widely accepted protocol (45). The expression levels of transcripts were quantified by Fragments Per Kilobase of transcript per Million mapped reads (45). To obtain assembled non-coding transcriptome data sets for genome-wide lncRNA predictions, we removed
Table 1. The details of 227 features used in the integrated model Features
Cell line
Tissue/cell type
Accession
Feature number
Data type
Histone modifications (H3K4me1, H3K4me3, H3K9me3, H3K36me3, H3K27ac, H3K27me3), PolII and CTCF Histone modifications (H3K4me1, H3K4me3, H3K9me3, H3K36me3, H3K27ac, H3K27me3), PolII and CTCF Histone modifications (H3K4me1, H3K4me3, H3K27ac, H3K27me3), PolII and CTCF Repeat elements and CpG islands
E14
ES
GSE31039
8, each with 7 subfeatures, summing up to 56 features
ChIP-seq
E14.5 whole brain 8 week CB
GSE31039
8, each with 7 subfeatures, summing up to 56 features
ChIP-seq
GSE31039
6, each with 7 subfeatures, summing up to 42 features 9, each with 7 subfeatures, summing up to 63 features 1 conservation feature, 2 ORF features, 7 nucleotide sequences-based features, summing up to 10 features
ChIP-seq
PhastCons most conserved regions, ORF and nucleotide sequences-based features
UCSC mm9 UCSC mm9
Bed format BED format
Columns represent the feature names, the cell lines of mouse ES cell used (cell Line), the tissue/cell type of the data (tissue/cell type), the NCBI GEO accession number (Accession), feature number and the data type.
4 Nucleic Acids Research, 2013
the reads mapped on RefSeq and Ensembl genes. Further filtering included the removal of transfrags with short length (600 nt (26). The remaining transfrags were predicted by our trained feature-selected model. The resulting putative lncRNAs for three developmental stages were listed in Supplementary Table S1. Feature calculation The genomic (only repeat elements and CpG islands) and chromatin features of known and predicted transcripts were quantified for the following seven categories respectively: Transcription Start Sites (TSSs) upstream 3k, promoter (TSS until end of first exon), 1st third, 2nd third and 3rd third of gene body excluding 1st exon, respectively, exons in together and lastly Transcription End Sites downstream 3k. For transcripts with only one exon, the promoter was defined as 20% of gene length downstream of TSSs. The lncRNA body was defined as the gene body without first exon. The rule makes seven subfeatures to be modeled for each feature (except 10 sequence features), summing up to 227 features (Table 1). The full data for all features including subfeature information are in Supplementary Table S2. The general naming conventions of the subfeatures are tissue_feature_region, where region represents one of 3000bp_u _TSS, 3000bp_d _TSS, 1_3 _gene, 2_3 _gene, 3_3 _gene, exons and 3000bp_d_TTS, corresponding to the aforementioned feature categories, respectively. The subfeature calculations were done by writing custom JAVA scripts. The feature values for all genes used in the training and testing model were given in Supplementary Table S2. Selection of potential sequence features is one of the most important steps before modeling. We referred to Sun et al.’s article (26) to select 10 effective sequence features that are listed in Table 1. In addition, the feature space of di- or tri-nucleotide sequence features is large, and these features are highly inter-correlated, which would decrease the performance of integrated model. We only used GC, CT, TAG, TGT, ACG and TCG in our model, which were shown to contribute mostly to the prediction performance (26). Though other features such as those based on homolog search were often used for non-coding RNA classification, they were highly correlated with the conservation and did not improve model performance (26). In addition, CpG island feature was used here because many intergenic CpG islands were associated with non-coding RNAs (46). Repeat elements were also reckoned to regulate lncRNA evolution (47), which were also included in our model. The gene expression specificity based on three developmental stages was used for analyzing lncRNA expression specificity-related chromatin and genomic features. We used QDMR software (48) to calculate expression specificity. Transcripts without developmental stage-specific expression fell into no specificity category.
Feature selection by LASSO regularized logistic regression Standardization that can avoid shrinkage of feature weights was performed by subtracting the mean and dividing by the standard deviation for all features in integrated model. A binomial logistic regression was used to model sequence and chromatin features and then predict putative lncRNAs from transcriptomic data in ES cell, E14.5 brain and adult CB. Let yi = 0 or 1 to represent lncRNA or protein-coding gene. Define y = [y1, y2, . . ., yn]T as the binary class label for all n genes. The probability of yi = 1 is given by pi = Pr(yi = 1), i = 1, . . ., n. The logistic regression model is defined by: m X �j xij ð1Þ logitðpi Þ ¼ �0+ j¼1
where � is the regression coefficient of variable x, which indicates how well each feature explains the difference of lncRNA and protein-coding genes. The logit(pi) is defined by: � � Prðyi ¼ 1Þ logitðpi Þ ¼ log ð2Þ 1 � Prðyi ¼ 1Þ To select efficient features, we used LASSO regularization that introduces an additional penalty with a power raised on the weight vector (49). Using LASSO regularization, feature weights of less significance would shrink to 0 as lambda increases. The LASSO estimate of � is determined by 8 9 !2 6, which was termed as the strict threshold for 10 training models. One would speculate that a model can achieve even better performance with additional feature inclusion. To defy this, we reconstructed three feature-selected models with loose thresholds of 6, 5 and 4 common features in 10 models, respectively. For the integrated model with more features benefited by loose thresholds while keeping other settings unchanged, we observed minor performance increments in the lncRNA and coding gene predictions (Supplementary Figure S3A). For example, the integrated model achieved a precision of 0.803 using the strict threshold, whereas the precision smoothly increased to 0.813 with a looser threshold of 4/10. Such a minor increase of performance suggested that feature selection with a stricter threshold was suitable to perform a genome-wide prediction, with respect to both time and result robustness. We were also interested whether removal of any one, two or more features from the feature selected integrated model at the strict threshold would harm the model performance. For the feature-selected integrated model, when removal of any one feature, two features or three features, while keeping other settings unchanged, on average, we observed only a weak reduction of the model performance for only one feature removal (Supplementary Figure S3B), whereas the performance was worse when more features were removed. The result further suggested the efficiency of feature selection and the robustness of the proposed feature selected integrated model. Independent gene set testing shows that the integrated model including chromatin data identifies lncRNAs more accurately than sequence only model Having the data set of known Ensembl lncRNA and protein-coding genes without training, we conducted model performance testing with the strict threshold, which was shown to be effective compared with other thresholds. It was tempting to evaluate our models without sequence features together with a sequence only model because it was unclear if chromatin data could significantly improve lncRNA prediction power. A set of 6578 Ensembl lncRNA genes without overlapping any RefSeq genes were used as the lncRNA positive testing set for evaluation. In contrast, a set of 1495 proteincoding genes without overlapping any RefSeq genes
Nucleic Acids Research, 2013 7
Table 3. Comparison of averaged performance of testing validation for Ensembl lncRNA and protein-coding genes without overlapping any RefSeq genes using selected features, chromatin data only and sequence only features Used features
Sensitivity
Specificity
PPV
All chromatin features All sequence features Feature selected features
0.706 0.764 0.753
0.649 0.657 0.823
86.0% 87.2% 92.8%
The comparisons include the sensitivity, specificity and PPV.
were used as the negative testing set. The testing set is an unbalanced data set, the size ratio of lncRNAs versus coding genes is �4.4. A more proportion of lncRNAs in testing set mimicked the situation where most unannotated transfrags in assembled transcriptome data were expected to be non-coding fragments. Ten independent tests for 10 training models were performed, respectively. The averaged results were shown in Table 3. From Table 3, the chromatin data only model and the sequence only model achieved a comparable accuracy on predicting lncRNAs (average PPV = 86.0% using chromatin data only features versus 87.2% using sequence only features). It was not surprising that the chromatin data only model did not outperform the sequence only model because chromatin modification data from only limited tissues/cell types were included in integrated model, and the performance may be better if more marks and more data from other tissues/cell types could be added. The integrated model with selected features achieved a better PPV, suggesting the usefulness of feature selection. Taken together, the sequence and chromatin information were somewhat complementary, though the sensitivity of chromatin data only model was inferior to that of the sequence only model. Though more effective sequence features would help identify lncRNAs in theory, it seemed that features involving ORF were most useful, which were considered irreplaceable by chromatin data. Therefore, an integrated model incorporating both effective chromatin information and genomic sequence information could help identify potential lncRNAs in a more effective manner. lncRNA prediction based on transfrags of uncharacterized genomic regions by integrated model We then applied our feature selected integrated model to predict lncRNAs from transfrag sets de novo assembled from RNA-seq data of same developmental stages with chromatin ChIP-seq data. After pre-processing of RNAseq data (details refer to ‘Materials and Methods’ section), only unannotated intergenic transcripts were kept to be predicted by our model. Furthermore, potential coding transcripts were filtered out by the CPC program, which used six features of putative ORFs to distinguish proteincoding from non-coding genes. In summary, we obtained 19 246, 17 230 and 2688 lncRNAs in E14.5 brain, CB and ES cell, respectively. About 80% of these were developmental stage-specific lncRNAs.
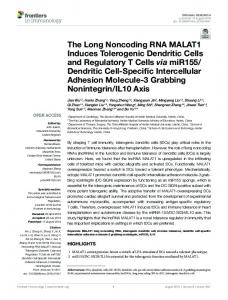
lncRNAs were short, non-conserved and lowly expressed, compared with protein-coding genes in previous studies (4,54,55). To explore whether the putative lncRNAs filtered here also had similar genomic characteristics, we analyzed the gene structure, conservation level and ORF length of developmental stage-specific putative lncRNAs of three tissue/cell types (Figure 2). We found that the length of predicted putative lncRNAs was on average a half of that of known protein-coding transcripts (mean length of 1549 nt for lncRNAs versus 2676 nt for coding transcripts) (Figure 2A). Though shorter than known protein-coding transcripts, the putative lncRNAs were comparable with known RefSeq lncRNAs in length (1549 nt for lncRNAs versus 1899 nt for known lncRNAs). Moreover, lncRNAs had fewer exons per transcript (�1.5) than protein-coding gene (�11.2), even fewer than known lncRNA transcripts (�5.2) (Figure 2B). Though the less number of exons might be an underestimation of the actual size of putative lncRNAs due to potentially incomplete assembly of lowly expressed transcripts, much evidence suggested many lncRNAs were tended to be unspliced, compared with proteincoding genes (56). In supporting this, the gene transcriptional rates were considered to be positively associated with splicing machinery (57). Consistent with prior studies (17,55), the putative lncRNAs were less conserved than known coding transcripts (Figure 2C). Notably, the putative lncRNAs were associated with shorter ORFs than known protein-coding transcripts (mean length of 162.8 nt for lncRNAs versus 1747.0 nt for coding transcripts) (Figure 2D), while comparable with known lncRNAs (384.9 nt for known lncRNAs). Previous studies have implicated lncRNAs as potential products of enhancer functions. It has been suggested that enhancer elements can produce short transcripts called enhancer RNAs (58). Enhancer RNAs may be related to lncRNAs because both of enhancers and lncRNAs are highly tissue/developmental stage-specific in gene expression. For enhancer marks were associated with lncRNAs based on feature selection, we were interested in whether putative lncRNAs were associated with enhancer related chromatin marks. H3K27ac is known as an active enhancer mark, which is more useful for testing enhancer than H3K4me1 that marks both active and poised enhancer (59). To estimate the proportion of enhancer associated putative lncRNAs, we intersected gene body and promoter of putative lncRNAs at three developmental stages with H3K27ac enriched domains of matched stage, respectively. We observed that �20% of promoters of predicted lncRNAs in E14 and CB and �10% of promoters of predicted lncRNAs in E14 brain were associated with H3K27ac enriched domain (Supplementary Figure S4). In addition, �50% of lncRNA body of predicted lncRNAs (exons excluding first exon, the same for following results) were associated with H3K27ac (Supplementary Figure S4). Taken together, a large proportion of lncRNAs seemed to be regulated by enhancer marks, whereas only a small proportion (�20%) of lncRNAs may be enhancer products. If only common lncRNAs expressed in the two developmental stages were considered, the proportion of
8 Nucleic Acids Research, 2013
A
Putative lncRNAs
NR_ lncRNAs
B
NM_ coding genes CB
0.0010 0.0008 0.0006 0.0004 0.0002 0.0000
E14
0.0010 0.0008 0.0006 0.0004 0.0002 0.0000
ES
0
00
20
00
40
00
60
00
80
0 0
00
10
00
20
00
40
00
60
00
80
0 0
00
00
10
20
00
40
00
60
00
80
Putative lncRNAs
0
CB
E14
ES 0
00
10
2
4
6
8
10
0
Putative lncRNAs
NR_ lncRNAs
CB
0.025 0.020 0.015 0.010 0.005 0.000
E14
0.025 0.020 0.015 0.010 0.005 0.000
ES
50
0
10
0
15
0
20
0
25
0
50
0
10
0
15
0
20
0
25
4
6
8
10
0
2
4
6
8
10
0
50
0
10
0
15
0
20
0
25
PhastCons score
Putative lncRNAs
NR_ lncRNAs
NM_ coding genes
0.004 0.003 0.002 0.001 0.000
Density
Density
D
NM_ coding genes
0.025 0.020 0.015 0.010 0.005 0.000
0
2
# of exons
Transcript length
C
NM_ coding genes
NR_ lncRNAs
12000 10000 8000 6000 4000 2000 0 12000 10000 8000 6000 4000 2000 0 12000 10000 8000 6000 4000 2000 0
Count
Density
0.0010 0.0008 0.0006 0.0004 0.0002 0.0000
CB
0.004 0.003 0.002 0.001 0.000
E14
0.004 0.003 0.002 0.001 0.000
ES
0
200 400 600 800 1000 0
200 400 600 800 1000 0
200 400 600 800 1000
ORF length
Figure 2. The genomic property of putative lncRNAs with developmental stage specificity, compared with known lncRNAs and protein-coding genes with developmental stage specificity. (A) Putative lncRNAs display shorter transcript length than that of known lncRNAs and known proteincoding genes. (B) Putative lncRNAs display fewer number of exons than that of known lncRNAs and known protein-coding genes. (C) Putative lncRNAs display lower PhastCons conservation scores than that of known lncRNAs and known protein-coding genes. (D) Putative lncRNAs display comparable ORF length with that of known lncRNAs and shorter ORF length than that of known protein-coding genes.
association with the mark is low (�4% for promoter and �13% for body, detailed data not shown), which could be reasoned that lncRNAs were precisely and specifically regulated by this enhancer mark. As an example of enhancer mark regulated lncRNAs, we showed in Figure 3 that four lncRNAs in an imprinting cluster between Dlk1 and Meg3 were candidates associated with enhancer, which were supported by histone modification patterns (H3K27ac and H3K4me1) and available literature (Figure 3). Only basal levels of H3K4me3 and PolII were observed, in contrast to the enrichment of two enhancer marks H3K27ac and H3K4me1 in the cluster of putative lncRNAs. Court et al. used 3C-qPCR approach to study the chromatin dynamics and long-range cis-interactions for several genomic regions. Based on their data, we found that these lncRNAs were in close to the contact loci with other chromosomes (60). Put together, the lncRNAs we found were reckoned to have roles in chromatin dynamics over large genomic distances even other chromosomes. As another example, we also found an lncRNA located �8 kb downstream of Zfp386 and �4 kb upstream of Vipr2, as shown in Supplementary Figure S5. We then examined the reliability of lncRNA predictions by evaluating whether predicted lncRNA regions were supported by PolII occupancy and Cap Analysis of Gene Expression (CAGE) clusters. First, we analyzed the predicted developmental stage-specific lncRNAs by stagematched PolII ChIP-seq data. RNA polymerase II binds
the promoters of virtually all known protein-coding and non-coding genes (61,62). Though PolII feature was used to build the training model, it was not included in the feature selected model, consistent with its role as a general gene transcription indicator. The PolII distributions aligned by the putative lncRNAs in E14.5 brain were shown in Figure 4A and B. The distributions in other tissues/cell lines were shown in Supplementary Figures S6 and S7. As expected, we found a peak at the vicinity of TSSs in E14.5 brain, CB and ES cell, respectively (Figure 4A, Supplementary Figures S6A and S7A). Quantitatively, �50% of promoters (TSS upstream 3k until end of first exon) of predicted lncRNAs were associated with PolII (Supplementary Figure S8A). Altogether, the PolII patterns were consistent with known distribution of PolII (63). The lncRNA body was significantly enriched with PolII signals over basal levels (Figure 4B, Supplementary Figures S6B and S7B). Approximately 40% of lncRNA body of predicted lncRNAs was associated with PolII (Supplementary Figure S8B). It has been known that genes with low expression have more tendency of PolII distribution toward TSSs and less in gene body compared with genes with high expression (64), which implied that most lncRNAs we identified were lowly expressed exclusively in specific stages, considering the stage of PolII ChIP-seq data was exactly matched with that of predicted stage-specific lncRNAs in this analysis.
Nucleic Acids Research, 2013 9 Scale chr12:
110,710,000
110,720,000
20 kb 110,730,000 110,740,000
110,750,000
mm9 110,760,000
110,770,000
110,780,000
lncRNAs RefSeq Genes
Dlk1 Dlk1 Dlk1 Dlk1 Dlk1
Ensembl Gene Predictions - archive Ensembl 65 - dec2011 Ensembl Genes
Meg3 Meg3 Meg3 Mir1906-1 Mir1906-2 Meg3 ENSMUST00000129245
Sequences in Articles: PubmedCentral and Elsevier Mouse mRNAs from GenBank Mouse mRNAs
Mouse ESTs That Have Been Spliced Spliced ESTs
Mouse ESTs Including Unspliced Mouse ESTs
Non-Mouse mRNAs from GenBank Other mRNAs
Placental Mammal Basewise Conservation by PhyloP Rat Human Orangutan Dog Horse Opossum Chicken Stickleback
Multiz Alignments of 30 Vertebrates
Repeating Elements by RepeatMasker
RepeatMasker 95 _
E14_H3K27ac 1_ 39 _
E14_H3K27me3 1_ 23 _
E14_H3K36me3 1_ 72 _
E14_H3K4me1 1_ 229 _
E14_H3K4me3 1_ 257 _
E14_PolII 1_
Figure 3. Novel putative enhancer related lncRNAs located between Dlk1 and Meg3 in mouse genome, which are supported by histone modification patterns and known literature. These lncRNAs are �35 kb downstream of Dlk1 and �40 kb upstream of Meg3. Coverage plots of several histone modification ChIP-seq data in E14.5 brain are shown at the bottom. Data for each chromatin modification are shown as a ‘wiggle’ track of extended reads. Other genomic annotations derived from the UCSC Genome Browser database are also shown with the direction of transcription indicated by arrows. The visualization is based on a local mirror of the UCSC Genome Browser. Chromosome coordinates (mm9) are shown on top of this figure.
CAGE was developed to map promoters, and we were interested whether the predicted lncRNA promoters were supported by CAGE tags, which would add extra evidence for supporting our predictions. The basic assumption of the evaluation was that the larger the number of CAGE tags overlapped with the predicted lncRNA promoters, the more confident the predictions were. Though only one CAGE tag was needed to map a promoter, lncRNAs would be reliable by multiple tags, due to the potential noise of CAGE, which would be better to be demonstrated in the similar manner with that of PolII.
The CAGE data used here were taken from the FANTOM4 project with over 20 tissues/cell lines including brain tissues (65). Analogous to PolII profile, we also found a peak at the vicinity of TSSs in E14, CB and ES cell, respectively (Figure 4C, Supplementary Figures S6C and S7C). Quantitatively, >80% of promoters of predicted lncRNAs were associated with CAGE tags (Supplementary Figure S8C). No enrichment of CAGE tags in gene body was consistent with the fact that CAGE was developed to map TSSs rather than other genomic regions (Figure 4D, Supplementary Figure S6D
10 Nucleic Acids Research, 2013
B
1.6
1.5
1.8
2.0
2.5
Average Profile
2.2 2.0
Average Profile
2.4
3.0
2.6
A
−3000
−2000
−1000
0
1000
2000
−1000
3000
2000
3000
4000
Average Profile
0.28 0.24 0.16 −3000
−2000
−1000
0
1000
2000
3000
Relative Distance to TSS (bp)
0.20 0.25 0.30 0.35 0.40 0.45 0.5
0.32
0.36
D
0.20
Average Profile
1000
Upstream (bp), 3000 bp of Meta−gene, Downstream (bp)
Relative Distance to TSS (bp)
C
0
−1000
0
1000
2000
3000
4000
Upstream (bp), 3000 bp of Meta−gene, Downstream (bp)
Figure 4. The average profile of PolII ChIP-seq tags and CAGE tags around TSS and within gene body for stage-specific lncRNAs in E14.5 brain. (A) The TSS of lncRNAs is enriched with PolII tags over basal levels, where PolII density is aligned around TSS with ± 3000 bp extensions. The average signal represents the average number of reads per 100-bp interval. (B) The gene body of lncRNAs normalized by length of 3000 bp with 1000-bp extension from TSS toward upstream and TTS toward downstream is enriched with PolII tags over basal levels. (C) The TSS of lncRNAs is enriched with CAGE tags over basal levels, where CAGE tag density is aligned around TSS with ± 3000-bp extensions. (D) The gene body of lncRNAs normalized by length of 3000 bp with 1000-bp extension from TSS toward upstream and TTS toward downstream is enriched with CAGE tags over basal levels. The size of the gene body of all lncRNAs is scaled to 3000 bp for comparison (Meta-gene defined by the CEAS package).
and S7D). In contrast, �60% of lncRNA body of predicted lncRNAs was associated with CAGE tags (Supplementary Figure S8D). Altogether, the evaluation of putative lncRNAs by PolII occupancy and CAGE data suggested that the integrated model was powerful for identifying developmental stage-specific lncRNAs. lncRNAs are coexpressed with nearby genes and are associated with differentiation and development To explore the regulatory roles of the predicted lncRNA candidates, we assigned developmental stage-specific lncRNA candidates to their closest genes and compared the gene expression changes of lncRNAs and their closest genes during development, as previous studies raised a
hypothesis that the regulation of lncRNAs on nearby protein-coding genes was a possible regulatory mechanism (Figure 5A), and almost 40% of GENCODE v7 lncRNAs were estimated to flank protein-coding gene loci (17). We showed the distance distributions between lncRNAs and nearby protein-coding genes in Supplementary Figure S9, where most of E14.5 brain-specific lncRNAs (�71.5%) had gene neighbors within 100 kb and �18.3% within 10 kb. Similarly, �78.5% of CB-specific lncRNAs had gene neighbors within 100 kb and �19.9% had within 10 kb. The detailed distance information for lncRNAs and neighboring genes was available in Supplementary Table S3. An lncRNA candidate may be difficult to be assigned to one specific nearby gene, as lncRNAs were often located in intergenic deserts and even may not
Nucleic Acids Research, 2013 11 Co-expression ?
C
lncRNAs close to E14.5-specific lncRNAs 55% Control
Neighboring coding genes E14.5 stage
Adult stage
E14.5 stage
Adult stage
Cerebellum-specific lncRNA upregulated
75%
E14.5-specific lncRNA downregulated
B
E14.5-specific lncRNA downregulated
LncRNA genes
Known coding genes close to E14.5-specific lncRNAs
71%
Cerebellum-specific lncRNA upregulated
A
47%
Known coding genes close to Cerebellum-specific lncRNAs
lncRNAs close to Cerebellum-specific lncRNAs
Figure 5. Developmental stage-specific lncRNAs are positively associated with neighboring protein-coding genes with regard to gene expression level. (A) A hypothetical model is proposed, assuming stage-specific lncRNAs can regulate neighboring protein-coding genes and therefore have a positive coexpression relationship. (B) We analyze the known protein-coding gene expression changes from E14.5 brain to CB and find that 75% of proteincoding genes closest to the E14.5-specific lncRNAs are downregulated, whereas 71% of protein-coding genes closest to the CB-specific lncRNAs are upregulated. (C) We analyze the expression changes from E14.5 brain to CB for neighboring lncRNA–lncRNA pairs as a control and found that 55% of neighboring lncRNAs around the E14.5-specific lncRNAs are downregulated, whereas 47% of neighboring lncRNAs around the CB-specific lncRNAs are upregulated.
regulate closest genes in a linear genome. Here, we preferred to keep lncRNAs with closest genes