JOURNAL OF LIGHTWAVE TECHNOLOGY, VOL. 31, NO. 16, AUGUST 15, 2013
2981
Long-Range and High-Spatial-Resolution Distributed Birefringence Measurement of a Polarization-Maintaining Fiber Based on Brillouin Dynamic Grating Yongkang Dong, Member, IEEE, Hongying Zhang, Zhiwei Lu, Liang Chen, and Xiaoyi Bao, Senior Member, IEEE
Abstract—We report a long-range and high-spatial-resolution distributed measurement of the birefringence of a polarization-maintaining fiber based on Brillouin dynamic grating (BDG) through optimizing the pump and probe scheme in the time-domain. The optimal scheme includes a CW pump1, a long pump2 pulse, and a short probe pulse, where the long pump2 pulse can effectively excite a BDG with a relatively low power to avoid other nonlinear effects in a long-length fiber, and the short probe pulse is used to improve the spatial resolution. The numerical simulations verify that with this scheme the spatial resolution is determined by the duration of the probe pulse, while the BDG reflection spectrum width increases with shorting the duration of the probe pulse. In experiment, a measurement of a 500-m Panda polarization-maintaining fiber with a 20-cm resolution is realized by using a 20-ns pump2 pulse and a 2-ns probe pulse. The results clearly show the 49-cm spatial period of the birefringence variation caused by the uneven stress as winding the fiber around a spool. Besides, longer spatial periods of the birefringence variation are also observed, which could be caused by the residual stress during the fiber drawing and coating processes or the nonuniformity of fiber preform. Index Terms—Birefringence, dynamic grating, polarizationmaintaining fiber, stimulated Brillouin scattering.
I. INTRODUCTION
P
OLARIZATION-MAINTAINING fibers (PMFs) are optical fibers in which the polarization of linearly polarized light waves launched into the fiber with correct orientation is preserved during propagation, with little or no cross-coupling of the optical power between the polarization modes due to a large birefringence. PMFs are used in special applications, such as in optical fiber sensing, interferometry, and quantum key Manuscript received March 04, 2013; revised May 28, 2013; accepted June 29, 2013. Date of publication July 04, 2013; date of current version July 19, 2013. This work was supported by the Natural Science and Engineering Research Council of Canada through discovery and strategic grant and by the Canada Research Chair Program. The work of Y. Dong was also supported by the National Natural Science Foundation of China under Grant 61205073. (Corresponding author: X. Bao.) Y. Dong and J. Lu are with Institute of Opto-Electronics, Harbin Institute of Technology, Harbin, 150001, China (e-mail:
[email protected]). H. Zhang is with Department of Optics Information Science and Technology, Harbin University of Science and Technology, Harbin, 150080, China. L. Chen and X. Bao are with Physics Department, University of Ottawa, Ottawa, ON, K1N 6N5, Canada (e-mail:
[email protected]). Color versions of one or more of the figures in this paper are available online at http://ieeexplore.ieee.org. Digital Object Identifier 10.1109/JLT.2013.2272118
distribution, etc., for which the birefringence is the one of the most important parameters. Although many methods have ever been proposed to measure the birefringence of PMFs [1]–[3], until recently a distributed measurement of the birefringence of PMFs was first demonstrated by using Brillouin dynamic grating (BDG) [4]. Stimulated Brillouin scattering (SBS) is a fundamental nonlinear optical process caused by electrostriction effect, based on which many useful applications have been developed, such as slow light generation [5], Brillouin amplification [6], and distributed strain/temperature sensing [7], etc. The BDG is essentially a moving acoustic wave associated with the SBS process, and was first demonstrated in a PMF in 2008 by K. Y. Song et al. [8]. Usually, BDG is excited through SBS by launching two counter-propagating pump waves, separated in frequency by Brillouin frequency shift and co-polarized along one principal axis of the PMF. Then a third probe wave, which is polarized along the orthogonal principle axis of the PMF, is used to read the generated BDG [4], [8]–[25]. Due to the relatively large birefringence of the PMFs, the frequency of the probe wave should be offset from those of the two pump waves to obtain the maximum reflection on the BDG, where the amount of the offset is dependent on the birefringence of the PMF and is typically a few tens of GHz. The BDG spectra can be obtained by measuring the reflection of the probe wave as scanning the frequency offset between the pump and probe waves. The center frequency of the BDG spectrum is called birefringence-induced [4], frequency shift and is determined by is the group is the birefringence of the PMF, [8], where refractive index of the PMF, and is the frequency of the probe wave. It is seen that the birefringence can be calculated through of the PMF under test. measuring It is noted that a high-resolution Brillouin gain spectrum in a PMF was performed based on BDG by using a long pump pulse and an ultra-short probe pulse [11], [12], where a remark100 ps able 1-cm spatial resolution was achieved by using probe pulse. As for the BDG spectrum measurement, in [4] two short pump pulses (2 ns) were used to excite a short-length BDG to achieve a high spatial resolution (20 cm). Since the duration of the pump pulses is much smaller than the phonon lifetime ( 10 ns in silica fibers), the Brillouin gain is considerably reduced, so high-power pump pulses should be used to strengthen the grating amplitude to improve the SNR of the reflection signal. The measurement of a piece of Panda fiber and a piece of Bow-tie fiber both with an 8-m in length were demonstrated by using 30-W pump pulses in [4]. However, with such
0733-8724/$31.00 © 2013 IEEE
2982
JOURNAL OF LIGHTWAVE TECHNOLOGY, VOL. 31, NO. 16, AUGUST 15, 2013
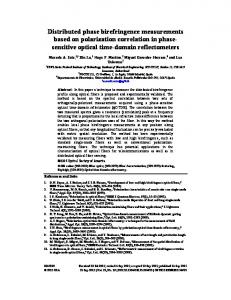
a high power the measurable length of a PMF would be limited by some nonlinear effects, such as self-phase modulation or modulation instability [26]–[29]. These nonlinear effects would broaden the spectra of the pump pulses and consequently reduce the amplitude of the excited BDG thus limiting the measurement length. Another time-domain scheme, including a 20-ns Gaussian pump pulse and a 20-ns Gaussian probe pulse lagged 5 ns, was proposed to excite and read a BDG, realizing the measurement of BDG reflection spectra over a 100-m PMF with a spatial resolution of 2 m [9], however, such a resolution is usually not sufficient for characterizing a fast variation of birefringence over a PMF. Alternatively, the BDGs can also be excited in correlation-domain by Brillouin optical correlation-domain analysis (BOCDA), which usually has a measurement range restriction while pursue a high spatial resolution. More recently, a temporal gating technique was used to overcome the measurement range restriction of BOCDA obtaining a 500-m range and a 45-cm spatial resolution for BDG measurement [17]. In this paper, we optimize the time-domain scheme to achieve a long-range and high-spatial-resolution distributed measurement of the birefringence of a PMF based on BDG. The optimal scheme includes a CW pump1, a long pump2 pulse and a short probe pulse. The long pump2 pulse can effectively excite a BDG with a relatively low power to avoid other nonlinear effects, i.e., self-phase modulation or modulation instability, thus extending the measurement range, and the short probe pulse is used to improve the spatial resolution. The numerical simulations and experimental results are both presented based on the optimal scheme. This paper is structured as follows. In Section II, we give the measurement scheme and explain how to choose the durations of pump2 pulse and probe pulse. In Section III, numerical simulations are performed to demonstrate the dependence of spatial resolution and BDG spectrum on the durations of pump pulse and probe pulse. In Section IV, the measurement of a 500-m Panda polarization-maintaining fiber with a 20-cm resolution is experimentally implemented by using a 20-ns pump2 pulse and a 2-ns probe pulse, and analysis of the measurement results are also given. Section V gives discussions and conclusions. II. MEASUREMENT SCHEME Fig. 1 shows the schematic diagram of excitation and readout of a BDG for distributed measurement of the birefringence of a PMF. The measurement process is as follows. Two counter-propagating pump waves, i. e., a CW pump1 and a pulsed pump2, are launched into one principal axis of a PMF, where their frequency offset is set at the Brillouin frequency shift of the fiber. A BDG would be excited following the pump2 pulse along the fiber through the SBS process. In the meantime, a short probe pulse immediately after the pump2 pulse is launched into the orthogonal principal axis to read the BDG, and the reflection spectra of the BDG over the entire fiber can be obtained through scanning the frequency offset between the pump2 and probe waves in the vicinity of the birefringence-induced frequency shift. Then the distributed birefringence of the PMF can be calculated based on the measured BDG spectra. With this scheme, the duration of pump2 pulse should be larger than the phonon lifetime (10 ns) so that the acoustic wave grows to its full extent through the SBS process realizing the ef-
Fig. 1. Schematic diagram of excitation and readout of a BDG for distributed measurement of the birefringence of a PMF.
ficient excitation of a BDG. As such, the power of the pump2 pulse is not required to be as high as that in [4], so that the nonlinear effects, including self-phase modulation and modulation instability, can be avoided in a long-length fiber. In addition, it will be shown in the following section that with this scheme the spatial resolution of the measurement is determined by the duration of the probe pulse rather than that of the pump2 pulse, so that a high spatial resolution can be obtained by using a short probe pulse. III. NUMERICAL SIMULATIONS The process of excitation and readout of a BDG can be described by the following coupled-wave equations [21], [22]. (1) (2) (3) (4) (5) where , , , , are field amplitudes of pump1, pump2, probe, reflection and acoustic waves, respectively, where the reflection of the probe wave is the BDG signal. are the effective refractive indices of the principal axes of a PMF; is the SBS gain coefficient; is the phonon lifetime; is the light velocity in vacuum; is the detuning in the BDG readout process. In numerical simulations, the parameters are: light wavelength , fiber length , effective mode field area , phonon lifetime ns and SBS gain coefficient m /W; the power of the CW pump1 is 0.1 mW and the powers of the pump2 pulse and probe pulse are both 1 W, where these powers are the same as those used in the following experiments. In the followings, it will be revealed that the BDG spectrum is determined by the probe pulse if the fiber length is larger than the effective BDG length. In simulation, the maximum duration of the probe pulse is 10 ns corresponding to 1-m effective BDG length, so the simulation results with 2-m fiber length are valid for the case of a 500-m fiber with 2-ns probe pulse in experiment. We first examine the dependence of the spatial resolution on the durations of pump pulse and probe pulse with the scheme proposed in Fig. 1. The spatial resolution can be determined through the rising time of the BDG signal in the abrupt transition region. In the simulations, the frequency offset between the
DONG et al.: BIREFRINGENCE MEASUREMENT OF A POLARIZATION-MAINTAINING FIBER BASED ON BDG
Fig. 2. Time traces of pump1 and BDG signals with a 20-ns pump2 pulse and a 2-ns probe pulse. The length of the optical fiber is 2 m.
2983
Fig. 4(a). Note that the BDG spectra feature symmetric side lobes located on both sides of the maximum reflectivity, which arise from the uniformity of gratings. The FWHM width of the BDG spectrum as a function of the duration of the probe pulse is plotted in Fig. 4(b), from which it is seen that the BDG spectrum width decreases with increasing the duration of the probe pulse. It was previously verified that the BDG is a kind of weak grating, and the spectrum width is only determined by the length of the grating [25]. Analogous to the real length of a fiber Bragg grating (FBG), we can define an effective BDG length as in the readout process with a short probe pulse, where is the duration of the probe pulse. The physical meaning of the effective BDG length is the length of the probe pulse propagating in the fiber, for example, it is 20 cm for a 2-ns pulse. The theoretical result of a uniform weak FBG with different grating length (solid curve) by using the equation in [30] is also plotted in Fig. 4(b) for comparison. It is seen that the BDG spectrum width agrees with that of a uniform weak FBG when using the effective BDG length. Based on the above analysis, we can conclude that the spatial resolution of the distributed birefringence measurement equals to the effective BDG length determined by the duration of the probe pulse, while the measured BDG spectrum width will increase with decreasing the duration of the probe pulse thus leading to decreasing of the measurement accuracy. IV. EXPERIMENTAL SETUP AND RESULTS
Fig. 3. Numerical simulations of BDG spectra with different durations of the pump2 pulse, including 5 ns, 10 ns, and 20 ns.
two pump waves is set at the Brillouin frequency shift to fully excite the BDG and the frequency of the probe wave is chosen to obtain the maximum BDG signal, i. e., . With a 20-ns pump2 pulse and a 2-ns probe pulse, the time traces of transmitted pump1 signal (solid curve) and the BDG signal (dashed curve) are plotted in Fig. 2. It can be seen that in the abrupt transition region the rising time of the BDG signal is of 2 ns (corresponding to a 20-cm spatial resolution) and is determined by the duration of the probe pulse, while the rising time of the pump1 signal is of 20 ns and is determined by the duration of the pump2 pulse. We then simulate the reflection spectra of the BDG through fixing the frequency offset between the two pump waves at the Brillouin frequency shift and changing the frequency of the probe wave. We first examine the influence of the duration of pump2 pulse on the BDG spectrum. Fixing the 2-ns probe pulse, the simulation results of the BDG spectra with different durations of the pump2 pulse, including 5 ns, 10 ns, and 20 ns, are plotted in Fig. 3. Since the duration of the pump2 pulse contributes to the efficiency of the BDG excitation, the BDG signal increases with the duration of the pump 2 pulse, while the profile of the BDG spectrum keeps the same, as shown in Fig. 3. Fixing the 20-ns pump2 pulse, the simulation results of the BDG spectra with different durations of the probe pulse, including 2 ns, 4 ns, 6 ns, 8 ns and 10 ns, are plotted in
The experimental setup is shown in Fig. 5. A 500-m Panda PMF (PM1550-HP, made by Nufern) is used as the fiber under test (FUT), whose Brillouin frequency shift is of 10.871 GHz at room temperature and its nominal beat-length is smaller than 5 mm at 1550 nm. The FUT is tightly wound around a spool with a diameter of 15.5 cm corresponding to a spatial period of cm. Two fiber lasers operating at around 1550 nm are used to provide two pump waves, i.e., pump1 and pump2, and their frequency offset is locked at 10.871 GHz by a microwave frequency counter. A tunable laser with a wavelength resolution of 0.1 pm is used to provide the probe wave. The frequency difference between the pump1 and probe is monitored by a high-speed detector and an electrical spectrum analyzer (ESA). The two pump waves are launched into the fast axis of the PMF through a polarizer (P) and a polarization beam combiner (PBC) to excite BDG, and the probe wave is launched into the slow axis through the PBC to read the BDG. An electro-optic modulator (EOM1) is used to generate a 20-ns pump2 pulse with 1-ns rising/falling edge, and another EOM2 is used to generate a 2-ns probe pulse with 100-ps rising/falling edge, where the probe pulse is set to immediately following the pump pulse in time, i.e., the delay between the falling edge of the pump2 pulse and the rising edge of the probe pulse is zero. The sampling rate of the DAQ is set at 2 GHz/s, corresponding to 5 cm/point in the FUT. In experiment, the CW pump1 power was set at 0.1 mW and the powers of the pump2 and probe pulses were both set at 1 W. The frequency offset between the pump2 and probe waves was scanned from 46.8 to 49 GHz to obtain the BDG reflection spectra. The top-view of the measured 3-D BDG spectra over the 500-m FUT is shown in Fig. 6, where the shifts of the BDG spectra indicate the nonuniform birefringence over the FUT. A measured BDG reflection spectrum with offset (subtracting the
2984
JOURNAL OF LIGHTWAVE TECHNOLOGY, VOL. 31, NO. 16, AUGUST 15, 2013
Fig. 6. Measured 3-D BDG spectra over the 500-m FUT.
Fig. 4. Numerical simulations of BDG spectra: (a) with different durations of the probe pulse, including 2 ns, 4 ns, 6 ns, 8 ns and 10 ns, and (b) the BDG spectrum width (FWHM) as a function of the duration of the probe pulse, and the solid line is the theoretical result of a uniform weak FBG.
Fig. 7. Typical measured BDG spectra of (a) a uniform fiber section and (b) a nonuniform fiber section, and simulations (solid curves). The duration of the probe pulse is 2-ns.
Fig. 5. Experimental setup. PC, polarization controller; P, polarizer; PBC, polarization beam combiner; EDFA, Erbium-doped fiber amplifier; PD, photo-detector; DAQ, data acquisition.
) in a fiber section with uniform birefringence is plotted in Fig. 7(a), and its spectrum width (FWHM) is 440 MHz. The simulation of the BDG spectrum with a 2-ns probe pulse is also plotted for comparison (solid curve), from which we can see that the measured result matches very well with the simulation. Fig. 7(b) shows a typical BDG spectrum with offset in a fiber section with nonuniform birefringence, where the spectrum features nonuniformly-broadened asymmetric profile caused by the birefringence variation.
The amplitude of the BDG reflection spectra (maxima of the fitted curves) over the FUT is shown in Fig. 8. It can be seen that the amplitude of the BDG reflection spectra decreases towards the far end of the FUT, which could attribute to several factors. Firstly, the pump depletion effect for pump2 pulse reduces its power and consequently reduces the strength of the excited BDG in the far end of the FUT; secondly, the fiber attenuation also accounts for about 0.5 dB loss for propagation in a 500-m PMF. Note that besides the decreasing tendency on the whole large fluctuations of the amplitude of the BDG spectra can also be observed in local regions, which attribute to different extents of the birefringence nonuniformity within the length of the spatial resolution. As shown in Fig. 7(b), the nonuniform birefringence within the length of the spatial resolution causes
DONG et al.: BIREFRINGENCE MEASUREMENT OF A POLARIZATION-MAINTAINING FIBER BASED ON BDG
2985
Fig. 8. Amplitude of the BDG reflection spectra (maxima of the fitted curves) over the FUT.
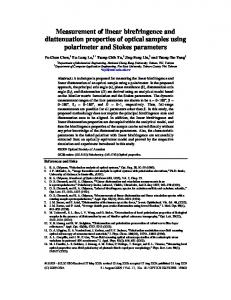
the broadened BDG spectrum and the decreasing BDG reflection signals. A considerable decreasing of the amplitude of the BDG spectra in local regions indicates a large extent of the birefringence nonuniformity within the length of the current spatial resolution, so that a better spatial resolution is required to fully characterize the birefringence variation in these regions. The central frequency of the BDG reflection spectrum is , based on which the local birefringence of the fiber can be calculated. Based on the measured BDG spectra shown in Fig. 6, the calculated birefringence over the FUT is shown in Fig. 9(a), where the maximum value is 3.6869 located at the position of 44.55 m (marked in figure) and the minimum value is 3.5772 10 located at the position of 350.65 m (marked in figure), resulting in a fluctuation of 3 over the entire fiber. As for the fiber section with uniform birefringence, the fitting accuracy of is 4 MHz and the corresponding birefringence measurement accuracy is 0.3 10 . We then apply Fourier transform to the AC birefringence variation (subtracting the average value) to characterize its variation in frequency domain, and the results are plotted in Fig. 10, whose horizontal axis is the reciprocal of the spatial period of the birefringence variation. One can clearly see the peak of the spatial period of 49 cm, which equals to the spatial period of the fiber spool. It indicates that the fiber should be subjected to uneven stress as winding the fiber to the spool, and the birefringence variation could come from both uneven axial stress and uneven transverse pressure between different fiber layers. The detailed variation over the segment of 40~60 m is plotted in Fig. 9(b), from which one can clearly see the birefringence change caused by the uneven stress as winding the fiber, and a spatial period of 49 cm is denoted in figure. We also observe that the change of caused by the uneven stress is in the range of a few hundreds of MHz. In addition to the peak of the spatial period of 49 cm, there are many other peaks with longer spatial periods, which could be caused by the residual stress induced by various disturbance factors during the fiber drawing and coating processes or the nonuniformity of fiber preform. Further study should be performed to verify the exact sources of the longer spatial periods. In Fig. 10, the maximum peak corresponds to a spatial period of 33 m, which is also denoted in Fig. 9(a).
Fig. 9. The calculated birefringence over (a) the entire 500-m FUT and (b) the segment of 40~60 m.
Fig. 10. The Fourier transform of the measured AC birefringence variation over the 500-m PMF.
V. CONCLUSIONS AND DISCUSSIONS In conclusion, we demonstrated a distributed birefringence measurement over a long-length PMF with a high spatial resolution based on BDG through optimizing the pump and probe scheme in time domain. The measurement of a 500-m Panda fiber with a 20-cm resolution was demonstrated and the characteristic spatial periods of the birefringence variation were observed, where the spatial period of 49 cm comes from the uneven stress as winding the fiber and the longer spatial periods could be caused by the residual stress during the fiber drawing and coating processes or the nonuniformity of fiber preform. Further study should be performed to verify the exact sources of
2986
JOURNAL OF LIGHTWAVE TECHNOLOGY, VOL. 31, NO. 16, AUGUST 15, 2013
the longer spatial periods. According to the analysis of the fluctuation of the amplitude of the BDG spectra, it is shown that there are local regions with large birefringence variation over the length of current spatial resolution, so that fully characterization of the birefringence needs a better spatial resolution. The maximum measurable length would be mainly limited by the reflection signal decreasing caused by the pump pulse depletion. It is believed that by controlling the pump pulse depletion effect the km-range measurement can be readily realized if the polarization mode coupling would still keep in a relative low lever. Moreover, the distributed measurement of the birefringence can provide an innovative method for the quality inspection of a PMF, and subsequently can be used for characterization of the high-precision fiber gyro coils. ACKNOWLEDGMENT The experiment was done in University of Ottawa. REFERENCES [1] D. A. Flavin, R. McBride, and J. D. C. Jones, “Dispersion of birefringence and differential group delay in polarization-maintaining fiber,” Opt. Lett., vol. 27, pp. 1010–1012, 2002. [2] P. Hlubina and D. Ciprian, “Spectral-domain measurement of phase modal birefringence in polarization-maintaining fiber,” Opt. Express, vol. 15, pp. 17019–17024, 2007. [3] Z. Ding, Z. Meng, X. S. Yao, X. Chen, T. Liu, and M. Qin, “Accurate method for measuring the thermal coefficient of group birefringence of polarization-maintaining fibers,” Opt. Lett., vol. 36, pp. 2173–2175, 2011. [4] Y. Dong, L. Chen, and X. Bao, “Truly distributed birefringence measurement of polarization-maintaining fibers based on transient Brillouin grating,” Opt. Lett., vol. 35, pp. 193–195, 2010. [5] Y. Okawachi, M. S. Bigelow, J. E. Sharping, Z. M. Zhu, A. Schweinsberg, D. J. Gauthier, R. W. Boyd, and A. L. Gaeta, “Tunable all-optical delays via Brillouin slow light in an optical fiber,” Phys. Rev. Lett., vol. 94, p. 153902, 2005. [6] W. Gao, X. Hu, D. Sun, and J. Li, “Simultaneous generation and Brillouin amplification of a dark hollow beam with a liquid-core optical fiber,” Opt. Express, vol. 20, pp. 20715–20720, 2012. [7] T. Horiguchi, K. Shimizu, T. Kurashima, M. Tateda, and Y. Koyamada, “Development of a distributed sensing technique using Brillouin-scattering,” Lightw. Technol., vol. 13, no. 7, pp. 1296–1302, Jul. 1995. [8] K. Y. Song, W. Zou, Z. He, and K. Hotate, “All-optical dynamic grating generation based on Brillouin scattering in polarization-maintaining fiber,” Opt. Lett., vol. 33, pp. 926–928, 2008. [9] K. Y. Song, W. Zou, Z. He, and K. Hotate, “Optical time-domain measurement of Brillouin dynamic grating spectrum in a polarizationmaintaining fiber,” Opt. Lett., vol. 34, pp. 1381–1383, 2009. [10] K. Y. Song, K. Lee, and S. B. Lee, “Tunable optical delays based on Brillouin dynamic grating in optical fibers,” Opt. Express, vol. 17, pp. 10344–10349, 2009. [11] K. Y. Song, S. Chin, N. Primerov, and L. Thevenaz, “Time-domain distributed fiber sensor with 1 cm spatial resolution based on Brillouin dynamic grating,” J. Lightw. Technol., vol. 28, no. 14, pp. 2062–2067, Jul. 2010. [12] K. Y. Song and H. J. Yoon, “High-resolution Brillouin optical time domain analysis based on Brillouin dynamic grating,” Opt. Lett., vol. 35, pp. 52–54, 2010. [13] K. Y. Song and H. J. Yoon, “Observation of narrowband intrinsic spectra of Brillouin dynamic gratings,” Opt. Lett., vol. 35, pp. 2958–2960, 2010. [14] X. Bao and L. Chen, “Recent progress in optical fiber sensors based on Brillouin scattering at University of Ottawa,” Photon. Sensors, vol. 1, pp. 102–117, 2011.
[15] W. Zou, Z. He, and K. Hotate, “Complete discrimination of strain and temperature using Brillouin frequency shift and birefringence in a polarization-maintaining fiber,” Opt. Express, vol. 17, pp. 1248–1255, 2009. [16] W. Zou, Z. He, K. Y. Song, and K. Hotate, “Correlation-based distributed measurement of a dynamic grating spectrum generated in stimulated Brillouin scattering in a polarization-maintaining optical fiber,” Opt. Lett., vol. 34, pp. 1126–1128, 2009. [17] R. K. Yamashita, W. Zou, Z. He, and K. Hotate, “Measurement range elongation based on temporal gating in Brillouin optical correlation domain distributed simultaneous sensing of strain and temperature,” IEEE Photon. Technol. Lett., vol. 24, no. 12, pp. 1006–1008, Jun. 2012. [18] Y. Antman, N. Primerov, J. Sancho, L. Thevenaz, and Zadok, “Localized and stationary dynamic gratings via stimulated Brillouin scattering with phase modulated pumps,” Opt. Express, vol. 20, pp. 7808–7821, 2012. [19] S. Chin, N. Primerov, and L. Thevenaz, “Sub-centimeter spatial resolution in distributed fiber sensing based on dynamic Brillouin grating in optical fibers,” IEEE Sens. J., vol. 12, no. , pp. 189–194, 2012. [20] M. Santagiustina and L. Ursini, “Dynamic Brillouin gratings permanently sustained by chaotic lasers,” Opt. Lett., vol. 37, pp. 893–895, 2012. [21] V. P. Kalosha, W. Li, F. Wang, L. Chen, and X. Bao, “Frequency-shifted light storage via stimulated Brillouin scattering in optical fibers,” Opt. Lett., vol. 33, pp. 2848–2850, 2008. [22] D. Zhou, Y. Dong, L. Chen, and X. Bao, “Four-wave mixing analysis of Brillouin dynamic grating in a polarization-maintaining fiber theory and experiment,” Opt. Express, vol. 19, pp. 20785–20789, 2011. [23] Y. Dong, X. Bao, and L. Chen, “Distributed temperature sensing based on birefringence effect on transient Brillouin grating in a polarizationmaintaining photonic crystal fiber,” Opt. Lett., vol. 34, pp. 2590–2592, 2009. [24] Y. Dong, L. Chen, and X. Bao, “High-spatial-resolution simultaneous strain and temperature sensor using Brillouin scattering and birefringence in a polarization-maintaining fibre,” IEEE Photon. Technol. Lett., vol. 22, no. 18, pp. 1364–1366, Sep. 2010. [25] Y. Dong, L. Chen, and X. Bao, “Characterization of the Brillouin grating spectra in a polarization-maintaining fiber,” Opt. Express, vol. 18, pp. 18960–18967, 2010. [26] G. P. Agrawal, Nonlinear Fiber Optics, 3rd ed. New York, NY, USA: Academic, 2001. [27] M. N. Alahbabi, Y. T. Cho, T. P. Newson, P. C. Wait, and A. H. Hartog, “Influence of modulation instability on distributed optical fiber sensors based on spontaneous Brillouin scattering,” J. Opt. Soc. Amer. B, vol. 21, pp. 1156–1160, 2004. [28] S. M. Foaleng, F. R. Barrios, S. M. Lopez, M. G. Herraez, and L. Thevenaz, “Detrimental effect of self-phase modulation on the performance of Brillouin distributed fiber sensors,” Opt. Lett., vol. 36, pp. 97–99, 2011. [29] Y. Dong, H. Zhang, Z. Lu, L. Chen, and X. Bao, “Impacts of Kerr effect and fiber dispersion on long-range Brillouin optical time-domain analysis,” in Proc. SPIE, Beijing, 2012, vol. 8421, p. 84219Z. [30] T. Erdogan, “Fiber grating spectra,” J. Lightw. Technol., vol. 15, no. 8, pp. 1277–1294, Aug. 1997. Yongkang Dong, biography not available at the time of publication.
Hongying Zhang, biography not available at the time of publication.
Zhiwei Lu, biography not available at the time of publication.
Liang Chen, biography not available at the time of publication.
Xiaoyi Bao, biography not available at the time of publication.