Longitudinal computational fluid dynamics study of aneurysmal dilatation in a chronic DeBakey type III aortic dissection Christof Karmonik, PhD,a Sasan Partovi, MD,a,b Matthias Müller-Eschner, MD,b,c Jean Bismuth, MD,a Mark G. Davies, MD,a Dipan J. Shah, MD,a Matthias Loebe, MD,a Dittmar Böckler, MD,d Alan B. Lumsden, MD,a and Hendrik von Tengg-Kobligk, MD,b,c Houston, Tex; and Heidelberg, Germany Computational fluid dynamics, which uses numeric methods and algorithms for the simulation of blood flow by solving the Navier-Stokes equations on computational meshes, is enhancing the understanding of disease progression in type III aortic dissections. To illustrate this, we examined the changes in patient-derived geometries of aortic dissections, which showed progressive false lumen aneurysmal dilatation (26% diameter increase) during follow-up. Total pressure was decreased by 29% during systole and by 34% during retrograde flow. At the site of the highest false lumen dilatation, the temporal average of total pressure decreased from 45 to 22 Pa, and maximal average wall shear stress decreased from 0.9 to 0.4 Pa. These first results in the study of disease progression of type III DeBakey aortic dissection with computational fluid dynamics are encouraging. ( J Vasc Surg 2012;56:260-3.)
Progressive false lumen aneurysmal dilatation in type III DeBakey aortic dissections (ADs) is a multifactorial process that is poorly understood and likely influenced by systemic and local hemodynamic parameters.1 Currently, no well-defined variables or imaging modalities exist that can reliably predict late aortic dilatation.2-4 Total intraluminal pressure and wall shear stress are parameters that have a direct effect on the aortic wall, may offer predictive value, and can be derived from patient-specific computational fluid dynamics (CFD) simulations. Large differences in AD geometry exist, particularly in the size and tortuosity of the true and false lumens, which limit the value of simulation results obtained from generalized or idealized geometries. In this article, we demonstrate the potential of multimodality, patient-specific CFD simulations with patientderived geometries and flow information to define hemodynamic changes associated with disease progression, thereby providing additional or complementary information not available by imaging alone. The approach presented here can be readily extended to a larger patient group in a longitudinal study with the goal to determine the potential value of CFD simulations in prediction of aneurysmal growth and rupture. Additional therapeutic value can be developed by identifying patients who need From the Methodist DeBakey Heart & Vascular Center, Houstona; the Departments of Diagnostic and Interventional Radiologyb and Vascular Surgery, University Hospital Heidelberg,d and the Department of Radiology, German Cancer Research Center (DKFZ),c Heidelberg. Author conflict of interest: none. Additional material for this article may be found online at www.jvascsurg.org. Reprint requests: Christof Karmonik, PhD, Methodist DeBakey Heart & Vascular Center, 6560 Fannin St 944, Houston, TX 77030 (e-mail:
[email protected]). The editors and reviewers of this article have no relevant financial relationships to disclose per the JVS policy that requires reviewers to decline review of any manuscript for which they may have a conflict of interest. 0741-5214/$36.00 Copyright © 2012 by the Society for Vascular Surgery. doi:10.1016/j.jvs.2012.02.064
260
closer blood pressure control to avoid a surgical intervention after nonoperative management has failed. METHODS Approval for this retrospective study was obtained from the local Institutional Review Board. Image data were collected from clinical examinations of a 45-year-old man who presented with a chronic AD. Computational meshes were derived from a three-dimensional (3D) contrastenhanced magnetic resonance imaging (MRI) study at the initial examination and from a computed tomography angiography study at a 10-month follow-up examination. CFD was used to simulate blood flow in both meshes. Axial through-plane velocity images acquired with twodimensional phase-contrast MRI (2D pcMRI) from the thoracic and the abdominal aorta were compared with CFD results. Total pressure, which is the force per unit area exerted by the blood flow perpendicular to the aortic cross section, was averaged over the lumen of the ascending aorta, true lumen, and false lumen to quantify total pressure variations over the cardiac cycle. Distributions of total pressure, here the force per unit area exerted by the blood flow perpendicular to the aortic wall, and wall sheer stress, which is the force per unit area exerted by the blood flow parallel to or along the aortic wall, were determined in a volume of interest defined at the posterior thoracic false lumen wall (the location of largest dilatation). Further technical details can be found in the Appendix (online only3,5). RESULTS Compared with imaging at the initial presentation, the thoracic and abdominal false lumen diameter and crosssectional areas were both increased (Table). A good correlation between the actual major flow patterns from pcMRI and those derived from CFD (Fig 1) was observed in the true and false lumens. A helical flow pattern of the in-
JOURNAL OF VASCULAR SURGERY Volume 56, Number 1
Karmonik et al 261
Table. Geometric changes for diameter and crosssectional area of ascending aorta and the true and false lumens Variable Ascending aorta Diameter, mm Cross-sectional area, mm2 Thoracic true lumen Diameter, mm Cross-sectional area, mm2 Thoracic false lumen Diameter, mm Cross-sectional area, mm2 Abdominal false lumen Diameter, mm Cross sectional area, mm2
Initial presentation
Follow-upa
38 1162
38 1167
38 645
38 646
40 941
45 1236
32 732
37 910
a Distinct changes during follow-up were only observed for the false lumen (marked in bold).
posterior thoracic false lumen wall. At this location, the MRI images showed a hypointense region exhibiting no enhancement after contrast injection, which most likely represents thrombus formation. Slow and recirculating flow creates stasis and may lead to platelet deposition and eventual thrombus formation (Fig 2, A). In the ascending aorta, maximum total pressure (ie, peak pressure during systole) decreased from 1762 to 1246 Pa (13.2 to 9.3 mm Hg; 29%) and absolute minimum pressure (during retrograde flow) decreased from 555 to 295 Pa (4.1 to 2.2 mm Hg; 34%). In the true lumen, maximum total pressure (848 to 521 Pa; 6.4 to 3.9 mm Hg; 39%) and minimum total pressure (328 to 151 Pa; 2.5 to 1.1 mm Hg; 54%) decreased during follow-up. In the false lumen, maximum total pressure (776 to 478 Pa; 5.8 to 3.6 mm Hg; 38%) and minimum total pressure (315 to 146 Pa; 2.4 to 1.1 mm Hg; 54%) also decreased (Fig 2, B). Distribution of the average total pressure values at the thoracic posterior false lumen wall was similar at the initial and follow-up visits. However, the mean value decreased by a factor of two, from 45 to 22 Pa (Fig 2, C). The temporal average of the wall sheer stress at this location in the false lumen also decreased, from 0.35 (initial examination) to 0.14 Pa (follow-up) and never exceeded 2 Pa at any point during the cardiac cycle. The hemodynamic cause for this shift is likely the result of the lower blood flow velocities observed at this location. The largest wall shear stress (⬎10 Pa) at both assessments existed around the entrance tear, in particular at the posterior wall of the false lumen adjacent to the entry tear (the impingement site of the in-flow jet). DISCUSSION
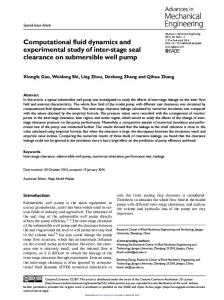
Fig 1. Top, In this schematic of velocity waveform within the ascending aorta, the black circles mark intervals 1 to 4 where intraluminal cross sections are shown. Bottom, Rows show through-plane two-dimensional phase-contrast magnetic resonance imaging (pcMRI) velocity magnitudes and intraluminal cross sections from computational fluid dynamics (CFD). The arrow marks similar features; in particular, a helical flow pattern of inflowing blood (black) can be appreciated in the ascending aorta (open arrows). During systole (2), predominantly antegrade flow in the false lumen can be appreciated (filled arrows); at other time points, flow patterns are more complex, showing different degrees of antegrade (dark) and retrograde (bright) flow in the false lumen.
flowing blood jet was recognized in the ascending aorta. Main flow patterns at the initial examination and during follow-up were similar: there was high-velocity flow in the ascending aorta, with a pronounced jet into the dissection entry tear from the true lumen to the false lumen, and a slow-flow zone with recirculation patterns adjacent to the
This report has demonstrated that CFD simulation can quantify changes in total pressure and wall sheer stress resulting from geometric changes during follow-up using patient-derived data. False-lumen dilatation in the interval between the initial and follow-up visits led to lower blood flow velocities at the thoracic posterior false lumen wall, thereby effectively reducing total pressure and wall sheer stress overall. High wall shear stress (⬎10 Pa) was observed for both assessments at the location of the entry tear. High stresses have the potential to cause additional injury to the endothelial cells, thereby potentially leading to tear progression and the creation of additional tears. Further validation of the calculated wall shear stress values, possibly using a diverging fringe shear stress sensor in an animal model, are therefore warranted. Changes observed in total pressure and wall shear stress are based on the changes in the geometry of the true and false lumens. A potential change in stroke volume, blood pressure, or in the volumetric flow in the ascending aorta was not considered in this study. Low time-average shear stress and fluid-flow reversal, as observed at the posterior thoracic false lumen wall in our model, has been identified with blood platelet deposition and thrombus formation.6 This observation is in agreement with our results and the
JOURNAL OF VASCULAR SURGERY July 2012
262 Karmonik et al
Fig 2. A, The location of slow, recirculating flow (posterior thoracic false lumen wall) coincided with the presence of a thrombotic formation observed with magnetic resonance imaging (MRI) during the initial examination on a twodimensional phase-contrast MRI (pcMRI) magnitude image (left) and a postcontrast parasagittal image indicating lack of enhancement (right, open arrows). B, Temporal variation of total pressure (in 1000-Pa increments) during the cardiac cycle at initial examination (blue) and follow-up (red) at three anatomic locations: ascending aorta and true and false lumens. Pronounced differences for initial presentation and follow-up can be appreciated in all three locations during systolic (*) and diastolic (†) flow. In contrast, total pressure values were essentially identical during diastole (‡). C, Pseudocolor presentation (top) shows the average total pressure on the luminal wall of the three-dimensional model during systole (ie, peak pressure in Pa) at the initial examination (IE) and follow-up (FU). A decrease of total pressure can be appreciated at follow-up, in particular at the posterior false lumen wall (white arrows). Wall shear stress during systole (bottom). Low wall shear stress is present at the posterior wall of the false lumen (⬍2.5 Pa) at both examinations (white arrows).
presence of thrombus at a low-flow zone adjacent to the thoracic posterior false lumen wall. In a rodent animal model study conducted by Hoshina et al,7 wall sheer stress was reduced by 60% through left iliac artery ligation and resulted in a significantly higher abdominal aortic aneurysm volume than that produced by increased wall sheer stress (by 300% through left femoral arteriovenous fistula creation). The authors of that study concluded that high-flow conditions lead to stabilization of aortic integrity, thereby limiting aneurysm growth.7 In our model, in addition to changes in wall sheer stress and flow velocities, reduction of total pressure maxima for systolic and retrograde flow were found in the ascending aorta and true and false lumens, possibly indicating that false lumen dilatation might be considered as a compensatory mechanism in chronic aortic dissections to reduce the force directly exerted onto the luminal wall. However, this hypothesis is limited by the lack of a patient-derived flow waveform at follow-up in our CFD simulation and a direct comparison of the values with acute AD. The present study was conducted by a multidisciplinary interplay of experts in vascular surgery, MRI imaging, image analysis, and the physics of blood flow dynamics. With a Dell Precision Dual-Processor, 3-Ghz,
8-GB dual-core workstation (Dell Corp, Round Rock, Tex), with a commercially available solver (Fluent 6.3.26; Ansys Inc, Canonsburg, Pa), each CFD simulation lasted about 12 hours. Preprocessing and postprocessing of the clinical images was performed with freely available software on a Mac Pro Quad core workstation (Apple, Cupertino, Calif). CONCLUSIONS The results presented here of a longitudinal investigation of chronic AD are encouraging for the use of CFD to provide additional surrogate markers for the characterization of this severe disease entity, thereby predicting false lumen progression in individual patients. Further investigations are warranted, and validation of the simulated hemodynamic parameters with a flow loop or with ex vivo experiments will be essential for a broad acceptance of the here-presented technology. REFERENCES 1. Masuda Y, Yamada Z, Morooka N, Watanabe S, Inagaki Y. Prognosis of patients with medically treated aortic dissections. Circulation 1991;84: III7-13.
JOURNAL OF VASCULAR SURGERY Volume 56, Number 1
2. Chan YC, Clough RE, Taylor PR. Predicting aneurysmal dilatation after type b aortic dissection. Eur J Vasc Endovasc Surg 2011;42: 464-6. 3. Karmonik C, Bismuth J, Shah DJ, Davies MG, Purdy D, Lumsden AB. Computational study of haemodynamic effects of entry- and exit-tear coverage in a DeBakey type III aortic dissection: technical report. Eur J Vasc Endovasc Surg 2011;42:172-7. 4. Filipovic N, Milasinovic D, Zdravkovic N, Böckler D, von TenggKobligk H. Impact of aortic repair based on flow field computer simulation within the thoracic aorta. Comput Methods Programs Biomed 2011;101:243-52. 5. Spiegel M, Redel T, Zhang YJ, Struffert T, Hornegger J, Grossman RG, et al. Tetrahedral vs. polyhedral mesh size evaluation on flow velocity and
Karmonik et al 263
wall shear stress for cerebral hemodynamic simulation. Comput Methods Biomech Biomed Eng 2011;14:9-22. 6. Bluestein D, Niu L, Schoephoerster RT, Dewanjee MK. Steady flow in an aneurysm model: correlation between fluid dynamics and blood platelet deposition. J Biomech Eng 1996;118:280-6. 7. Hoshina K, Sho E, Sho M, Nakahashi TK, Dalman RL. Wall shear stress and strain modulate experimental aneurysm cellularity. J Vasc Surg 2003;37:1067-74. Submitted Nov 10, 2011; accepted Feb 24, 2012.
Additional material for this article may be found online at www.jvascsurg.org.
263.e1 Karmonik et al
Appendix (online only). Technical details Image acquisition. From a 3D contrast-enhanced magnetic resonance angiography (MRA) oblique sagittal image set (Siemens Avanto [Siemens Medical Systems, Erlangen, Germany] 1.5 T; in-plane resolution, 1.2 ⫻ 1.2 mm; slice thickness, 1.6 mm; 60 slices), the geometry for the computational flow dynamic (CFD) calculations was derived as described previously.3 CFD in-flow boundary condition was calculated from two-dimensional phase-contrast magnetic resonance imaging (2D pcMRI) at the ascending aorta (in-plane resolution, 1.8 ⫻ 1.8 mm; slice thickness, 6 mm; one-breath hold; field of view, 450 ⫻ 310 mm) with through-plane flow encoding with a velocity encoding value (VENC) of 200 cm/s. (The VENC value represents the highest expected velocity value. In the pcMRI technique, a phase-difference image is created with the grayscale value proportional to the velocity of the flowing blood, where black corresponds to the largest positive expected velocity and white to the largest negative expected velocity. Higher velocities than the VENC value will result in image artifacts that should be avoided. Therefore, the VENC values should be chosen sufficiently high.) For comparison with CFD results, additional pcMRI acquisitions were available at selected locations in the descending aorta (acquired with the same imaging parameters as for the ascending aorta). At 10 months after the initial examination, a non– electrocardiographic-gated computed tomography angiographic (CTA) image set was acquired on an Aquilion scanner (Toshiba Medical Systems, Tustin, Calif; helical acquisition; matrix, 512 ⫻ 512 mm; slice thickness, 1 mm; field of view, 320 ⫻ 320 mm; in-plane pixel spacing, 0.625 ⫻ 0.625 mm) with the intravenous administration of 130 mL nonionic iodinated contrast medium (Iomeprol, Iomeron 350; Bracco International, Milan, Italy) at an injection rate of 4 mL/s. The geometry of the follow-up computational mesh was derived semiautomatically by a single value threshold from the acquired CT data set. Aortic dissection geometry. Diameter and crosssectional area for the ascending aorta and the thoracic and abdominal true and false lumens were determined from axial multiplanar reformations of the 3D contrast-enhanced MRA and CTA data sets. These data sets were acquired over several cardiac cycles, and therefore, the geometric quantities derived from them should be considered as average values across the cardiac cycle.
JOURNAL OF VASCULAR SURGERY July 2012
CFD simulations. Polyhedral meshes5 with an identical lower mesh boundary were created from each image set (initial presentation and follow-up) using GAMBIT 2.4.6 software (Ansys Inc, Canonsburg, Pa), with mesh sizes determined in a convergence analysis (initial presentation, 188,151 elements; follow-up, 252,399 elements). From the 2D pcMRI acquisitions available at selected positions in the thoracic and abdominal aorta, septum motion was found not to exceed the in-plane resolution of these images (1.3 mm). Therefore, rigid walls were assumed in the CFD simulation for this particular chronic dissection. Transient simulations were performed for each mesh (time-step, 5 ms; 162 time steps/cardiac cycle). Three cardiac cycles were calculated to allow for decay of initial transients. The results reported are from the third cardiac cycle. CFD results available at the nodes of the unstructured computational mesh were interpolated onto a structured regular mesh using the Shephard method (VTK; Kitware Inc, Clifton Park, NY). Intraluminal cross-sections of the CFD data (initial presentation) for different time points were created for qualitative comparison with pcMRI image data (throughplane velocity in superior-inferior direction). The 3D surface reconstructions from the unstructured CFD mesh were created with Paraview 3.8.0 software (Kitware Inc) for comparison of results from the initial presentation and follow-up. The in-flow boundary condition used in the CFD simulations was derived from the aortic flow waveform measured with 2D pcMRI during the initial presentation; thus, the total pressure derived from the simulations corresponds to the aortic pulse pressure. Because diastolic pressures were not included in the simulations, no direct conclusions can be made concerning systolic and diastolic pressures obtained clinically in the brachial arteries. Wall shear stress is the force that the flowing blood exerts on the aortic wall per unit area and which is oriented parallel to the wall. It is calculated from the simulated velocity field by taking the derivative of the velocity component parallel to the wall in the direction perpendicular to the wall multiplied by the viscosity. Total pressure was averaged over the lumen of the ascending aorta and the true and false lumens by region-ofinterest analysis using ImageJ 1.44 p software (National Institutes of Health, Bethesda, Md) for each simulated time point to quantify total pressure variations over the cardiac cycle. Pressures are given in Pa (1 Pa ⫽ 0.0075 mm Hg).