Arthritis Care & Research Vol. 66, No. 7, July 2014, pp 1057–1062 DOI 10.1002/acr.22268 © 2014, American College of Rheumatology
ORIGINAL ARTICLE
Longitudinal Validation of the Brief Index of Lupus Damage PATRICIA KATZ, LAURA TRUPIN, STEPHANIE RUSH,
AND
JINOOS YAZDANY
Objective. To provide further validation of the Brief Index of Lupus Damage (BILD), assessing its sensitivity to change in disease status and ability to predict mortality risk. Methods. Data were from the University of California, San Francisco Lupus Outcomes Study (n ⴝ 958), in which the BILD was administered twice, approximately 5 years apart. We examined disease activity and health care utilization among participants who completed the BILD twice (n ⴝ 745). We identified increases in disease activity and utilization that would suggest a disease flare between the 2 BILD administrations and compared their occurrence by BILD score increases (0, 1, 2, 3, >3). Deaths were ascertained when annual interviews were attempted. Kaplan-Meier life-table analysis compared mortality rates for 4 groups of initial BILD scores (0, 1, 2, >3), and differences were tested using a log rank test. Using Cox proportional hazards models, we estimated the risk of death associated with higher BILD scores. Results. BILD score increases were associated with spikes in disease activity (P ⴝ 0.05) and physician visits (P ⴝ 0.004) over baseline, and with hospitalizations (P < 0.001) during the intervening years. Of those with BILD score increases >3, 84% were hospitalized prior to the second BILD. During followup, there were 60 deaths (6.3%). BILD scores of 2 (hazard ratio [HR] 6.1, 95% confidence interval [95% CI] 1.3–30.0) and >3 (HR 10.8, 95% CI 2.5– 46.2) were associated with higher risk of death. Conclusion. This analysis provides evidence of the predictive validity of the BILD and its ability to detect change. While not intended to replace clinical evaluation of disease damage, the BILD appears to be a useful tool for research.
INTRODUCTION Measuring damage due to systemic lupus erythematosus (SLE) has traditionally relied upon physician assessments such as the Systemic Lupus International Collaborating Clinics (SLICC)/American College of Rheumatology Damage Index (SDI) (1). Studies have supported the validity and reliability of the SDI, but because it requires a trained physician with either comprehensive knowledge of the patient or access to comprehensive medical records to complete a 41-item questionnaire, it is not feasible to use the SDI in large-scale epidemiologic or clinical research. We developed a patient-reported measurement of lupus
Supported by the NIH/National Institute of Arthritis and Musculoskeletal and Skin Diseases (grant P60-AR053308) and by the Rosalind Russell Medical Research Center for Arthritis. Patricia Katz, PhD, Laura Trupin, MPH, Stephanie Rush, BA, Jinoos Yazdany, MD: University of California, San Francisco. Address correspondence to Patricia Katz, PhD, University of California, San Francisco, Arthritis Research Group, 3333 California Street, Suite 270, San Francisco, CA 941430920. E-mail:
[email protected]. Submitted for publication September 4, 2013; accepted in revised form December 3, 2013.
disease damage, the Brief Index of Lupus Damage (BILD), to address the need of these larger-scale studies (2). The BILD was designed to be administered by trained interviewers. Our cross-sectional evaluation of the BILD among 900 individuals with SLE supported the content, criterion, and construct validity of the BILD. We found good agreement and moderately high Spearman’s rank correlations between the SDI and the BILD. Higher BILD scores were also associated with longer disease duration, higher disease activity, poorer functional status, and increased health care utilization. Since the original publication of the BILD, self-administered versions have been tested and validated in English (3) and German (4). Each of these exhibited psychometric characteristics similar to those we previously reported. To date, the BILD has not been tested longitudinally to determine if it can predict important outcomes that might reflect changes in SLE-related damage. Our objective of this study was to provide further validation of the BILD, assessing its sensitivity to change in disease status and its ability to predict higher mortality risk.
MATERIALS AND METHODS Data source. Data were drawn from the University of California, San Francisco (UCSF) Lupus Outcomes Study 1057
1058
Katz et al
Significance & Innovations ●
A reliable, valid, and sensitive patient-reported measure of systemic lupus erythematosus (SLE) damage greatly expands the range of SLE research, permitting epidemiologic and other observational studies to include this important factor both as a covariate and as an outcome.
●
Previous work established the content and criterion validity of the Brief Index of Lupus Damage (BILD).
●
This study demonstrated the ability of the BILD to detect change and predict higher mortality risk.
(LOS), which has previously been described in detail (5). Briefly, LOS participants were recruited from an existing cohort of individuals with confirmed SLE diagnoses based on medical chart reviews supervised by a rheumatologist. Except for the initial confirmation of SLE diagnostic criteria, the data for the LOS were primarily collected via annual standardized telephone interviews. Enrollment began in 2003 and continued through 2010, although 80% of participants were enrolled prior to 2006. The study was approved by the UCSF Committee on Human Research, and all participants gave written informed consent. BILD. The BILD was developed as a self-report proxy for the SDI. The SDI consists of 41 items covering 12 organ systems, designed to quantify cumulative organ damage due to SLE regardless of attribution. Thirty-one items can score 1 point, 6 items can score 2 points, and 1 item can score 3 points, yielding a potential score range of 0 – 46 (6). The SDI is completed by a trained physician and requires either comprehensive knowledge of the patient or access to extensive medical records. In developing the BILD, the goal was not to replicate the SDI item for item, but to develop a proxy that would be sensitive to differences in disease damage. At the same time, items needed to be comprehensible to a lay respondent. Therefore, the BILD does not replicate the SDI item for item, because some manifestations were either considered too rare to be likely to contribute meaningfully to the score (e.g., shrinking lung) or not likely to be interpreted with enough specificity to capture the concept of damage (e.g., alopecia). The instrument contains 28 items that capture information on 26 of the original 41 SDI items. Development of the BILD items and validation of the measure are described in detail elsewhere (2). The BILD was first administered in 2007. Participants who joined the study after that time completed it as they enrolled. All participants in the 2012 interview completed a second BILD. Therefore, for most of the cohort, the 2 BILD scores were approximately 5 years apart; however, the interval ranged from 11–70 months. Variables. Disease status. To assess changes in disease status, we examined both disease activity and health care
utilization. These measures were chosen because the manifestations included in the BILD would typically give rise to increases in symptoms or utilization at the time they occur. We therefore identified increases in symptoms or utilization that would suggest a flare in disease activity between the first and second administrations of the BILD. Our assumption was that such flares could represent SLErelated events that could lead to increases in diseaserelated damage. Disease activity was measured with the Systemic Lupus Activity Questionnaire (SLAQ), a validated patient-reported measure of disease activity (7,8). For utilization, the numbers of both physician visits and hospitalizations were examined. The SLAQ and utilization measures were collected annually and self-reported by participants. Mortality. Deaths were ascertained when annual telephone interview calls were attempted and recorded based on report from family members of the deceased, using the alternate phone contacts provided by subjects at enrollment, if necessary. For an earlier mortality analysis of this cohort (9), a National Death Index (NDI) search was also conducted through 2006. At that time, only 3 cohort members who had been lost to followup were identified as deceased in the NDI. The percentage of participants lost to followup in any year (net of refusals and deaths) has remained very low throughout the study (0.5% annually). Statistical analysis. Sensitivity to change. Only participants who completed the BILD 2 times were included in this analysis (n ⫽ 745). We calculated changes in BILD scores, categorizing increases in scores as 0, 1, 2, 3, or ⬎3 (higher scores represent more accrued damage). These categories were chosen based on the distribution of BILD change scores. Only increases in scores are possible because, by definition, damage cannot be reversed. We then examined increases from baseline in disease activity measured with the SLAQ, increases in the number of physician visits, and hospitalizations that occurred in the years between the 2 BILD scores. Increases in the SLAQ score and physician visits were defined as an increase of 0.5 SD over baseline in at least 1 interview wave between BILD administrations (10), equivalent to a 4-point increase in the SLAQ score and 5 additional physician visits. For hospitalizations, we examined the presence of any hospitalization during the followup period and of any single wave with at least 2 hospitalizations. We tested differences among the BILD change groups using chi-square tests for trend. Mortality. A total of 958 participants completed the BILD instrument at least one time between 2007 and 2010; that group was included in the mortality analysis. For subjects who did not die during the study period, followup time (i.e., time to censorship) was based on the number of months from their baseline BILD score until their last interview, with the exception of 6 subjects, who were not known to have died but who were not interviewed again after their baseline BILD. We assigned these individuals a followup time of 6 months, equivalent to half the average interval between interview waves. For deceased subjects, followup time was calculated as the number of months
Further Validation of the BILD between the baseline BILD score and the date of death, if known. If the exact date of death was not reported, the followup time was based on the midpoint of the interval within which their death was known to have occurred. Fifteen participants had no known date of death; the average interval used to estimate followup time was 10 months (range 2–18 months). The baseline BILD scores were divided into 4 categories corresponding to 0, 1, 2, and ⱖ3 points (higher scores represent more damage). Kaplan-Meier life-table analysis was used to compare mortality rates by categories of the BILD, and differences were tested using a log rank test. Using Cox proportional hazards models, multivariate analyses of possible predictors of mortality were performed. In addition to the BILD categories, predictors examined included the SLAQ, nonwhite ethnicity, education beyond high school, sex, age, and disease duration. As a sensitivity analysis, we re-estimated the life-table and proportional hazards analyses using both end points of the interval for subjects without a precise followup time. The results were virtually identical to the midpoint analysis reported here and are not shown. Additionally, because of a report that renal damage was the most important predictor of mortality within the SDI (11), we were interested to see whether the BILD was associated with mortality if we excluded the end-stage renal disease (ESRD) items. Therefore, we recalculated the BILD without the ESRD items and entered the revised BILD and a separate variable for ESRD into the Cox regression model described above. SAS, version 9.3 was used for the sensitivity to change analyses, and Stata, version 12 was used for the mortality analysis.
RESULTS Among 958 subjects completing the BILD at the initial administration, the mean age was 49 years, 92% were women, 63% were white, and the mean disease duration was 16 years (Table 1). There were no differences between participants who were followed through the second BILD interview (n ⫽ 745) compared to those who dropped out prior to the 2012 interview but were not known to have died (n ⫽ 159) in sex, age, race, disease duration, baseline SLAQ score, number of doctor visits, or baseline BILD (data not shown). However, those who did not remain in the study were more likely to have been hospitalized in the baseline year and less likely to have completed college. BILD scores ranged from 0 –13 with a median of 1 (interquartile range [IQR] 0 –3) in the first administration. At the second administration, BILD scores ranged from 0 –18 with a median of 2 (IQR 1– 4). Half of the sample reported at least 1 additional manifestation of damage in the second BILD administration. The mean annual change in BILD was 0.21 points. Sensitivity to change in disease status. Changes in BILD ranged from 0 –13 with a median of 1 (IQR 0 –1). Of the 745 LOS participants with 2 BILD scores, 372 had no increase in BILD score. Of the remaining participants, 210, 84, 41, and 38 had increases of 1, 2, 3, and ⬎3 points, respectively
1059
Table 1. Baseline characteristics among participants who completed 1 or 2 BILD interviews*
Women, % (no.) Age, mean ⫾ SD years Race/ethnicity, % (no.) White, non-Hispanic Hispanic African American Asian Other/unknown Education, % (no.) High school or less Some college/AA/trade Bachelor’s degree or more Disease duration, mean ⫾ SD years Medications during the past year, % (no.) Glucocorticoids (oral/IV) Other immunosuppressants† Only glucocorticoids Both glucocorticoids and immunosuppressants SLAQ score, mean ⫾ SD Annual number of physician visits, mean ⫾ SD Hospitalizations in the baseline year, % (no.) 0 1 ⱖ2 Baseline BILD Median (IQR) Range Followup BILD Median (IQR) Range Change in BILD Median (IQR) Range Average annual change in BILD Mean ⫾ SD Range
All participants with >1 BILD score (n ⴝ 958)
Participants with 2 BILD scores (n ⴝ 745)
92 (885) 49 ⫾ 13
93 (693) 48 ⫾ 13
63 (599) 10 (95) 11 (103) 10 (100) 6 (61)
61 (457) 10 (78) 10 (76) 11 (83) 7 (51)
16 (151) 46 (437) 39 (369) 16 ⫾ 9
15 (114) 44 (324) 41 (306) 16 ⫾ 9
58 (558) 29 (274)
56 (414) 28 (211)
34 (329) 24 (229)
32 (241) 23 (173)
12 ⫾ 8 16 ⫾ 11
12 ⫾ 8 16 ⫾ 11
77 (739) 14 (138) 8 (81)
82 (613) 12 (86) 5 (40)
2 (1–3) 0–13 –
1 (0–3) 0–13 2 (1–4) 0–18
– 1 (0–1) 0–13 – 0.21 ⫾ 0.30 0–2.4
* BILD ⫽ Brief Index of Lupus Damage; AA ⫽ associate degree; IV ⫽ intravenous; SLAQ ⫽ Systemic Lupus Activity Questionnaire; IQR ⫽ interquartile range. † Immunosuppressants include azathioprine, mycophenolate mofetil, methotrexate, cyclosporine, leflunomide, cyclophosphamide, etanercept, rituximab, infliximab, adalimumab, and abatacept.
(Table 2). Overall, 37% of LOS participants had an increase in SLAQ score in at least 1 wave, 43% had an increase in physician visits in at least 1 wave, 40% had 1 or more hospitalizations during the study period, and 14% had 2 or more hospitalizations in a single year. The prevalence of an increase in SLAQ scores was highest among participants with changes in BILD score ⬎3. There was a
1060
Katz et al
Table 2. Increases in disease activity and physician visits and hospitalizations associated with subsequent increases in BILD scores* Increase in BILD score Total (n ⴝ 745)
0 (n ⴝ 372)
1 (n ⴝ 210)
2 (n ⴝ 84)
3 (n ⴝ 41)
>3 (n ⴝ 38)
P†
37 43 40 14
33 36 29 5
40 50 42 19
36 44 52 15
39 56 68 29
50 50 84 55
0.053 0.004 ⬍ 0.0001 ⬍ 0.0001
SLAQ (ⱖ1 score ⬎ baseline by 0.5 SD) Physician visits (ⱖ1 wave ⬎ baseline by 0.5 SD) Any hospitalizations during the study period Hospitalizations (ⱖ1 wave with ⱖ2)
* Values are the percentage. Increases in disease activity (i.e., Systemic Lupus Activity Questionnaire [SLAQ] score) and utilization were selected to reflect increases in symptoms or utilization that would suggest a flare in disease activity between the first and second administrations of the Brief Index of Lupus Damage (BILD) that could lead to increases in disease-related damage. † P value from chi-square test for trend.
greater prevalence of increased physician visits among participants with a change in BILD score ⬎0, and the chi-square value for trend was significant (P ⫽ 0.004), reflecting a greater likelihood of an increase in physician visits among those with greater increases in BILD score. Greater increases in BILD score were associated with significantly greater likelihood of any hospitalizations during the study period or ⱖ2 hospitalizations reported at any interview wave (chi-square for trend P ⬍ 0.0001). More than 80% of the participants with BILD score increases ⱖ3 were hospitalized between the 2 BILD assessments. Prediction of mortality. During the followup period, there were 60 deaths (6.3%) among the 958 LOS participants who had an initial BILD score. Mean followup time was 49 months (range 4 –75 months). In comparing participants who died to those who survived, regardless of followup status, there were no differences in sex, race, education, or baseline SLAQ score (data not shown). Those who died were significantly older, had longer disease duration, and had more physician visits and hospitalizations in the baseline year. For initial BILD scores of 0, 1, 2, and ⱖ3, the mortality rates were 0.9%, 2.0%, 6.3%, and 13.1%, respectively (Table 3). In Cox proportional hazards models adjusting for age, sex, disease duration, race/ethnicity, education, and SLAQ score, a BILD score of 2 (hazard ratio [HR] 6.1,
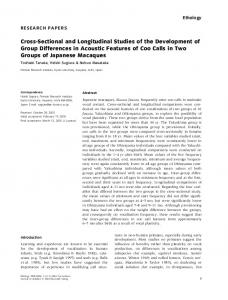
95% confidence interval [95% CI] 1.3–30.0) and a BILD score of ⱖ3 (HR 10.8, 95% CI 2.5– 46.2) were associated with higher risk of death over the followup period. Race, education, sex, and SLE disease activity were not associated with increased mortality risk in that model. Analyses of the revised BILD excluding the ESRD items showed a similar pattern, although the HRs were somewhat reduced (BILD score 2: HR 4.9, 95% CI 1.4 –17.6 and BILD score ⱖ3: HR 6.7, 95% CI 1.9 –23.1). For comparison, the HR for ESRD based on the renal disease items was 2.9 (95% CI 1.4 –5.9). Kaplan-Meier analysis also showed significantly higher mortality with increasing BILD scores (log rank 2 ⫽ 43.1, P ⬍ 0.001) (Figure 1).
DISCUSSION Our previous analyses provided evidence of the crosssectional validity of the BILD as a brief patient-reported measure of lupus disease damage. In these analyses, we demonstrated the predictive validity of the BILD. The BILD was both sensitive to change in disease status, increasing after disease events that were likely to represent accrual of damage, and a strong predictor of mortality in this cohort. In order for a health outcome measure to be useful in longitudinal studies, it must be able to detect real change
Table 3. Mortality by initial BILD scores*
Total BILD score No. of subjects No. of deaths Mortality, % HR (95% CI), unadjusted HR (95% CI), adjusted† BILD score omitting renal disease items No. of subjects No. of deaths Mortality, % HR (95% CI), adjusted‡
0
1
2
>3
225 2 0.9 Ref. Ref.
247 5 2.0 2.4 (0.5–12.2) 2.0 (0.4–10.2)
158 10 6.3 7.8 (1.7–35.5) 6.1 (1.3–30.0)
328 43 13.1 15.5 (3.7–63.8) 10.8 (2.5–46.2)
239 3 1.3 Ref.
271 7 2.6 1.8 (0.5–7.0)
174 13 7.5 4.9 (1.4–17.6)
274 37 13.5 6.7 (1.9–23.1)
* BILD ⫽ Brief Index of Lupus Damage; HR ⫽ hazard ratio; 95% CI ⫽ 95% confidence interval. † Adjusted for age, sex, disease duration, race/ethnicity, education, and disease activity (Systemic Lupus Activity Questionnaire score). ‡ Adjusted for the variables listed above as well as for incident dialysis or renal transplant.
Further Validation of the BILD
1061
Figure 1. Relationship between the Brief Index of Lupus Damage and mortality: results of the Kaplan-Meier analysis (log rank 2 ⫽ 43.1, P ⬍ 0.001).
when such change occurs. We found that BILD scores increased following rises in disease activity and physician visits and following hospitalizations that occurred between the first and second BILD administrations. Each of these events can be assumed to reflect disease manifestations or events that could cause accumulation of disease damage. In these analyses, there was a stronger relationship between increases in BILD scores and hospitalizations than between increases in BILD scores and increases in disease activity or physician visits. Hospitalizations may be a stronger reflection of disease events that could cause damage accrual, so the difference noted in these relationships might be expected. We designed the BILD to capture the overall concept of damage in SLE for epidemiologic research. It is important to note that it is not a direct substitute for the SDI, since the BILD omits many items from the SDI that were either not suitable for patient self-report or were not informative because of their frequent overreporting by patients. Instead, among a group of patients (rather than in any individual patient), the BILD is able to differentiate between those with high or low degrees of SLE damage and identify those with higher risks of mortality. Indeed, the mortality HRs from the BILD are equivalent to, and in some cases stronger than, those reported for the SDI (12–14). There are potential limitations to this study. Some individuals thought to be lost to followup may have died. Our prior search of the NDI showed that this was not common (only 3 of those lost to followup were found to have died), and even so, such occurrences would tend to bias our results toward negative results. As noted above, these analyses include only English-speaking, primarily well-educated individuals. While we and others have begun to expand the administration to non–English-speaking and less well-educated groups, such individuals were not included in this analysis. It is possible that some individuals overreported disease
manifestations, particularly individuals with scores at the high end of the scale. For example, the maximum BILD score increase was 13. While it is possible that someone could be accurately reporting such an increase in disease manifestations, it is also possible that this represents measurement error. To minimize this effect, we did not use a linear form of BILD score increases in our analyses, but categorized changes instead, with the largest increase group capped at ⱖ3. Additionally, the mean annual increase in BILD score in our cohort was 0.21, a rate of change that is within the range of SDI changes noted in other cohorts: in the LUMINA (LUpus in MInorities, NAture versus nurture) cohort, an average 1-year change of 0.4 was observed (15), and an inception cohort from the SLICC network reported an average annual change over 5 years of 0.17 (16). A reliable, valid, and sensitive patient-reported measure of SLE damage greatly expands the range of SLE research, permitting epidemiologic and other observational studies to include this important factor both as a covariate and an outcome. The evidence we present in this study adds to the evidence supporting the usefulness and validity of the BILD. Since our original publication of the instrument (2), a self-reported version has been developed and validated in a predominantly African American lupus cohort with lower levels of education (3), and a German version has also been validated (4). Although our original administration included only English-speaking individuals, we are now administering the BILD in Spanish, after a rigorous translation process. In summary, while previous cross-sectional examination of the BILD showed concurrent validity, this analysis provides evidence of the ability of the BILD to detect change and predictive validity. Importantly, the BILD differentiated between those who later had high mortality risk from their disease and those who did not. While not
1062
Katz et al
intended to replace clinical evaluation of disease damage, the BILD does appear to be a useful tool for research. AUTHOR CONTRIBUTIONS All authors were involved in drafting the article or revising it critically for important intellectual content, and all authors approved the final version to be published. Dr. Katz had full access to all of the data in the study and takes responsibility for the integrity of the data and the accuracy of the data analysis. Study conception and design. Katz, Trupin, Yazdany. Acquisition of data. Trupin. Analysis and interpretation of data. Katz, Trupin, Rush, Yazdany.
REFERENCES 1. Gladman D, Ginzler E, Goldsmith C, Fortin P, Liang M, Urowitz M, et al. The development and initial validation of the Systemic Lupus International Collaborating Clinics/American College of Rheumatology Damage Index for systemic lupus erythematosus. Arthritis Rheum 1996;39:363–9. 2. Yazdany J, Trupin L, Gansky SA, Dall’Era M, Yelin EH, Criswell LA, et al. The Brief Index of Lupus Damage: a patient-reported measure of damage in systemic lupus erythematosus. Arthritis Care Res (Hoboken) 2011;63:1170 –7. 3. Drenkard C, Yazdany J, Trupin L, Katz PP, Dunlop-Thomas C, Bao G, et al. Validity of a self-administered version of the Brief Index of Lupus Damage (BILD) in a predominantly black systemic lupus erythematosus population in the United States. 10th International Congress on SLE; 18 –21 April, 2013; Buenos Aires, Argentina. 4. Chehab G, Sander O, Richter J, Acar H, Vordenbaumen S, Brinks R, et al. Validation and evaluation of the German Brief Index of Lupus Damage (BILD): a self-reported instrument to record damage in systemic lupus erythematosus. Lupus 2013; 22:1050 –5. 5. Yelin E, Trupin L, Katz P, Criswell L, Yazdany J, Gillis J, et al. Work dynamics among persons with systemic lupus erythematosus. Arthritis Rheum 2007;57:56 – 63. 6. Romero-Diaz J, Isenberg D, Ramsey-Goldman R. Measures of adult systemic lupus erythematosus: updated version of British Isles Lupus Assessment Group (BILAG 2004), European Consensus Lupus Activity Measurements (ECLAM), Systemic Lupus Activity Measure, Revised (SLAM-R), Systemic Lupus
7.
8.
9.
10.
11.
12.
13.
14.
15.
16.
Activity Questionnaire for Population Studies (SLAQ), Systemic Lupus Erythematosus Disease Activity Index 2000 (SLEDAI-2K), and Systemic Lupus International Collaborating Clinics/American College of Rheumatology Damage Index (SDI). Arthritis Care Res (Hoboken) 2011;63 Suppl:S37– 46. Karlson EW, Daltroy LH, Rivest C, Ramsey-Goldman R, Wright EA, Partridge AJ, et al. Validation of a Systemic Lupus Activity Questionnaire (SLAQ) for population studies. Lupus 2003;12:280 – 6. Yazdany J, Yelin EH, Panopalis P, Trupin L, Julian L, Katz PP. Validation of the Systemic Lupus Erythematosus Activity Questionnaire in a large observational cohort. Arthritis Rheum 2008;59:136 – 43. Hersh AO, Trupin L, Yazdany J, Panopalis P, Julian L, Katz P, et al. Childhood-onset disease as a predictor of mortality in an adult cohort of patients with systemic lupus erythematosus. Arthritis Care Res (Hoboken) 2010;62:1152–9. Norman G, Sloan J, Wyrwich K. Interpretation of changes in health-related quality of life: the remarkable universality of half a standard deviation. Med Care 2003;41:582–92. Danila M, Pons-Estel G, Zhang J, Vila L, Reveille J, Alarcon G. Renal damage is the most important predictor of mortality within the damage index: data from LUMINA LXIV, a multiethnic US cohort. Rheumatology (Oxford) 2009;48:542–5. Nived O, Jonsen A, Bengtsson A, Bengtsson C, Sturfelt G. High predictive value of the Systemic Lupus International Collaborating Clinics/American College of Rheumatology Damage Index for survival in systemic lupus erythematosus. J Rheumatol 2002;29:1398 – 400. Chambers S, Allen E, Rahman A, Isenberg D. Damage and mortality in a group of British patients with systemic lupus erythematosus followed up for over 10 years. Rheumatology (Oxford) 2009;48:673–5. Sutton EJ, Davidson JE, Bruce IN. The Systemic Lupus International Collaborating Clinics (SLICC) Damage Index: a systemic literature review. Semin Arthritis Rheum 2013;43:352– 61. Alarcon GS, Roseman JM, McGwin G Jr, Uribe A, Bastian HM, Fessler BJ, et al. Systemic lupus erythematosus in three ethnic groups. XX. Damage as a predictor of further damage. Rheumatology (Oxford) 2004;43:202–5. Urowitz MB, Gladman DD, Ibanez D, Fortin PR, Bae SC, Gordon C, et al. Evolution of disease burden over five years in a multicenter inception systemic lupus erythematosus cohort. Arthritis Care Res (Hoboken) 2012;64:132–7.