Longitudinal Voxel-Based Morphometry with Unified Segmentation: Evaluation on Simulated Alzheimer’s Disease Gerard R. Ridgwaya, Oscar Camaraa, Rachael I. Scahillb, William R. Cruma, Brandon Whitcherc, Nick C. Foxb, and Derek L. G. Hilla∗ aCentre for Medical Image Computing, University College London. bDementia Research Centre, UCL. cGlaxoSmithKline.
Abstract. The goal of this work is to evaluate Voxel-Based Morphometry and three longitudinally-tailored methods of VBM. We use a cohort of simulated images produced by deforming original scans using a Finite Element Method, guided to emulate Alzheimer-like changes. The simulated images provide quite realistic data with a known pattern of spatial atrophy, with which VBM’s findings can be meaningfully compared. We believe this is the first evaluation of VBM for which anatomically-plausible ‘gold-standard’ results are available. The three longitudinal VBM methods have been implemented within the unified segmentation framework of SPM5; one of the techniques is a newly developed procedure, which shows promising potential.
1
Introduction
Voxel-Based Morphometry [1] is a method for automated whole-brain analysis of local structural differences, using Statistical Parametric Mapping (http://www.fil.ion.ucl.ac.uk/spm/); Longitudinal variants have been developed for application to cohorts with serial imaging [2, 3]. VBM necessitates preprocessing of the images, including spatial normalisation and tissue-segmentation. There is great difficulty in evaluating the performance of VBM methods due to the lack of ground truth. To the best of our knowledge, no previously published VBM studies of realistically complex data have had gold-standard maps of the regions that should be detected. We have developed Finite Element Methods (FEM) which can structurally alter images, producing finely-controllable, clinically realistic changes [4]. Such simulated images have known underlying deformation fields and volume changes, which can form a gold standard for evaluating atrophy-measurement techniques. Alzheimer’s Disease is a progressive neurodegenerative disorder, of great clinical and socio-economic importance. AD causes a loss of brain tissue which can be visualised and quantified using serial Magnetic Resonance Imaging [5]. Using a cohort of AD patients with MR images at baseline and one year later, we simulated new approximate year-on scans from the original baselines, guided by semi-automated measures of whole-brain, hippocampal, and ventricular volume changes [6]. The original baseline and simulated follow-up images then constitute a data-set with known FEM ground truth; we use this to derive a gold standard suitable for evaluating longitudinal VBM, and compare four such techniques, one of which is novel.
2
Methods
2.1
Voxel-Based Morphometry and Longitudinal VBM
VBM in SPM5 involves unified tissue-segmentation and spatial normalisation [7], followed by spatial smoothing and voxel-wise statistical testing. With serial data, statistical analysis can take advantage of reduced within-subject variability. To capitalise on the longitudinal information, changes should also be made to the VBM preprocessing methods. In this work, we evaluate standard VBM against two longitudinal methods from the literature (which we have adapted to be compatible with the unified segmentation framework) and our own newly developed SPM5 method. All SPM analyses were performed within an explicit mask derived from the smoothed ground-truth grey-matter segmentation. All smoothing was done with an 8mm FWHM Gaussian kernel. A one-sample t-test was performed on subtraction images; single-tailed contrasts for atrophy (increase0) were evaluated and thresholded with multiple comparison correction using Random Field Theory (pF W E < 0.01). ∗
[email protected]
2.1.1
Standard VBM
Here, ‘Standard’ VBM refers to simple application of unified preprocessing independently to each scan of each subject; only the statistics differ from the non-serial case. ‘Standard’ should not be contrasted here to ‘optimised’ VBM [8], which the unified segmentation model aims to supersede [7]. 2.1.2
Tied-normalisation
The preprocessing step of spatial normalisation should take advantage of the fact that multiple time-points for a single subject can be registered much more accurately than scans of different subjects, and that initial rigid alignment already reveals a great deal about within-subject change [5]. Using the non-unified model of SPM2, Gaser (in Draganski et al. [2]) developed a method with longitudinally tied spatial normalisation, in which repeat scans are transformed using the parameters determined for their corresponding baselines, then independently segmented. Following the introduction of SPM5’s unified framework, an extended generative model for unified longitudinal segmentation and normalisation should ideally be developed. As a simpler alternative, we have implemented an approach which applies the baseline normalisation parameters to the native-space baseline and follow-up grey matter images from separate unified segmentations. 2.1.3
Pre-averaged
More advanced techniques can combine inter-subject spatial normalisation with precise intra-subject registration using High-Dimensional Warping (HDW). One such method (designed by Ashburner, and implemented in [3]), creates lownoise averaged images of HDW-registered longitudinal sets, before inter-subject spatial normalisation and segmentation in SPM2. (i.e. averaging is ‘pre’ segmentation.) We have adapted this approach to the SPM5 framework, with unified segmentation and inter-subject normalisation following the intra-subject warping and averaging. The intra-subject volume changes from HDW must be taken into account to generate the follow-up data, which can be elegantly done by modulating the native-space segmented averageimages with the HDW Jacobian fields before applying the predetermined inter-subject transformations. This avoids the interpolation error due to the transformation of the Jacobians in [3]. 2.1.4
Post-averaged
We propose a technique similar to pre-averaging, but novel, and well-suited to SPM5’s unified segmentation. The new method should be better for subjects with large longitudinal change that might not be fully recovered by HDW, as in this case, the pre-averaged images may be too blurred to segment well. Each time-point is first segmented, and SPM5’s bias-corrected version is saved; HDW transformations are then determined on the corrected images and applied to their native-space segmentations. The warped segmentations are then averaged; i.e. averaging is ‘post’ segmentation of sharp original images. Each average segmentation is modulated with the HDW volume changes to create follow-up equivalents, then each set of original and modulated segmentations is spatially normalised with the baseline parameters.
2.2
Finite Element Modelling of Atrophy
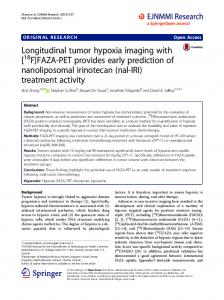
The atrophy simulation process is based on that described in [4]. It consists of four main steps: (1) Generation of a reference mesh; (2) Warping to a subject-specific mesh; (3) Deformation of the mesh using a FEM solver; (4) Application of the deformations to the baseline image of each subject, to produce a new simulated follow-up image. The reference mesh was built using the BrainWeb atlas labels of these structures [9] (http://www.bic.mni. mcgill.ca/brainweb/). The adaptation of the reference mesh to each subject was achieved with a mesh warping procedure guided by a fluid registration algorithm [10]. We used a cohort of 18 probable AD patients (7 female; ages from 55 to 86, mean 70) with baseline and 12-month follow-up MRI scans [6]. The FEM simulation was driven using values of the subjects’ volume changes in the brain, hippocampi, and ventricles (from semi-automated segmentation-based measurements). Simulated mean (standard deviation) percentage volume increases were: brain, -2.43 (1.18); hippocampi, -4.74 (3.24); ventricles, 11.49 (5.35). Figure 1(a-c) shows a single-subject example of atrophy simulation; ventricular expansion, cortical thinning, and opening of CSF spaces can be observed.
Figure 1. Example case of simulated atrophy: (a) Original baseline; (b) Simulated +1yr follow-up; (c) Subtraction image. The same subject’s gold-standard volume changes in BrainWeb space: (d) Volume gain (VG=1yr/orig); (e) GM-increase = (GM*VG)-GM; and (f) Smoothed GM-increase, as entered into the analysis.
2.3
Generation of a Gold Standard
Because the same mesh is warped from the BrainWeb template to each individual patient, there is a known correspondence between elements of the warped meshes for the different subjects; therefore the volume change of each element can be mapped back to the common space. By converting the element-wise volume changes to a voxel-wise representation, an image of the ratio of follow-up to original volume is created. These volume gain ratio images can be used to modulate the BrainWeb Grey Matter Segmentation, resulting in perfectly aligned effective follow-up segmentations, similar to those in the two HDW-based longitudinal VBM methods. The original BrainWeb GM is then subtracted from each follow-up and the result smoothed. Figure 1(d-f) illustrates this process for one subject. The gold-standard smoothed subtraction images could be entered into an identical one-sample t-test as the actual sets of VBM subtraction images. For reasons discussed in section 4.1, we instead use contrast (negative mean) images, thresholded at different values for visualisation purposes.
Figure 2. Gold-standard average atrophy, Maximum Intensity Projections thresholded at: (a) 0, (b) 0.01, (c) 0.02, (d) 0.03.
Figure 3. Maximum Intensity Projections of significant atrophy (pF W E < 0.01) for VBM methods: (a) Standard; (b) Tied-normalisation; (c) Pre-averaged; (d) Post-averaged.
3
Results
Gold-standard maximum intensity projections, at varying thresholds, can be seen in figure 2. Statistical results from the four VBM methods are presented in figure 3 as maximum intensity projections. In both cases the atrophy t-contrast (increase