institutions adopt Web-based learning systems for their e-learning courses. ..... Students who are confident in their ability to master an e-learning system, without ...
International Review of Research in Open and Distance Learning Volume 10, Number 2.
ISSN: 1492-3831
April – 2009 Regional Focus Issue: Bridge over Troubled Waters ~ Cengiz Hakan Aydin and Yoram EshetAlkalai, IRRODL Regional Editors for the Middle East
Looking under the Bonnet: Factors Affecting Student Adoption of E-Learning Systems in Jordan Muneer Mahmood Abbad University of Bahrain David Morris and Carmel de Nahlik Coventry University, UK
Abstract The primary questions addressed in this paper are the following: what are the factors that affect students‟ adoption of an e-learning system and what are the relationships among these factors? This paper investigates and identifies some of the major factors affecting students‟ adoption of an e-learning system in a university in Jordan. E-learning adoption is approached from the information systems acceptance point of view. This suggests that a prior condition for learning effectively using e-learning systems is that students must actually use them. Thus, a greater knowledge of the factors that affect IT adoption and their interrelationships is a pre-cursor to a better understanding of student acceptance of e-learning systems. In turn, this will help and guide those who develop, implement, and deliver e-learning systems. In this study, an extended version of the Technology Acceptance Model (TAM) was developed to investigate the underlying factors that influence students‟ decisions to use an e-learning system. The TAM was populated using data gathered from a survey of 486 undergraduate students, who were using the Moodle based e-learning system at the Arab Open University. The model was estimated using Structural Equation Modelling (SEM). A path model was developed to analyze the relationships between the factors to explain students‟ adoption of the e-learning system. Whilst findings support existing literature about prior experience affecting perceptions, they also point to surprising group effects, which may merit future exploration. Keywords: E-learning; technology acceptance model; Structural Equation Modelling; system adoption; Middle East
Introduction In educational institutions (e.g., high schools, universities, etc.) and in work life, the question of how to utilise modern information and communication technologies for learning purposes is
Looking under the Bonnet: Factors Affecting Student Adoption of E-Learning Systems in Jordan Abbad, Morris, and de Nahlik
important. E-learning in its broadest sense refers to any learning that is electronically enabled. In a slightly narrower sense, it is learning that is enabled by the application of digital technologies. Narrowed down further, it becomes any learning that is Web-based or Internet-enabled. Instruction over the Internet is perceived by many to be a significant breakthrough in teaching and learning (Keller & Cernerud, 2002; LaRose, Gregg, & Eastin, 1998). Many higher education institutions adopt Web-based learning systems for their e-learning courses. However, there is a limited empirical examination of the factors underlying student adoption of Web-based learning systems (Ngai, Poon, & Chan, 2007). Successful implementation of a system and adoption by learners requires a solid understanding of user acceptance processes and ways of persuading students to engage with these technologies (Saadé & Bahli, 2005). There is much research that has addressed the antecedents of technology use (Mahmood, Hall, & Swanberg, 2001) in general, but the overwhelming majority of studies have focused on users in developed countries. Whilst developing countries have much to gain from exploiting the Internet and IT in general, they have received relatively little research attention (Hasan & Ditsa, 1998). This paper‟s focus on Jordan not only deals with the specific experience in that country but also adds significantly to our overall knowledge of the factors underpinning student acceptance of eleaning technology. The Arab Open University (AOU) was founded by Prince Talal bin Abdul Aziz under the umbrella of the Arab Gulf Program for United Nations Development Organizations (AGFUND) and is headquartered in Kuwait; one of its first branches was founded in Jordan in 2002. The AOU was the first Jordanian university to adopt e-learning on a widespread basis and plays a critical role in e-learning development nationally. It operates in partnership with the UK Open University (OU) and deploys a Moodle–based e-learning management system to deliver courses and support to learners.
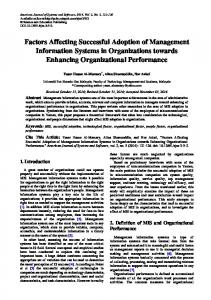
The Technology Acceptance Model (TAM) The TAM is an adaptation of the theory of reasoned action (Fishbein & Ajzen, 1975) specifically tailored for modelling user acceptance of information systems. Thus, the TAM is an intentionbased model. According to the theory of reasoned action, beliefs influence attitudes, which lead to intentions, which then generate behaviour. The TAM adopted this belief-attitude-intentionbehaviour relationship to model users‟ acceptance of IT (Bernadette, 1996; Di Benedetto, Calantone, & Zhang, 2003; Riemenschneider & McKinney, 2001). The TAM posits that two factors, perceived usefulness and perceived ease of use, are of primary relevance in influencing IT acceptance behaviours. Following Davis (1989), the posited relationship between perceived usefulness and perceived ease of use is that perceived usefulness mediates the effect of perceived ease of use on attitudes and intended use. In other words, while perceived usefulness has direct impacts on attitudes and intended use, perceived ease of use also influences attitude and use indirectly through perceived usefulness. These direct and indirect effects are additive. In turn, these two factors are the product of a number of variables which are exogenous to the TAM itself. Figure 1 summarises the TAM.
Page | 2
Looking under the Bonnet: Factors Affecting Student Adoption of E-Learning Systems in Jordan Abbad, Morris, and de Nahlik
Page | 3
Perceived ease of use is the degree to which an individual believes that learning to use a technology will require little effort. Perceived usefulness refers to the extent that a learner believes that use of the technology will improve his or her performance (see Efferson, Lalive, Richerson, Mcelreath, & Lubell, 2006). The problem of measuring and finding the factors that determine computer usage has inspired many researchers during the past two decades. The Technology Acceptance Model (TAM) set the baseline for much future research in information and computer technology adoption and use (Davis, 1989). In the TAM, Davis proposed two determinants of computer usage: perceived usefulness and perceived ease of use. Later, other researchers expanded the TAM model to incorporate additional variables that may account for more variance in computer technology usage (see Venkatesh & Davis, 2000; Gefen & Straub, 1997). The TAM was originally developed to focus on IT system usage in the workplace. More recently, the TAM has been applied to the domain of e-learning (Carswell & Venkatesh, 2002). This paper develops an extended version of the TAM to investigate factors that influence a student‟s decision to use an e-learning management system.
Literature Review Researchers have progressively developed the TAM by proposing and testing specific antecedents to its two use-belief constructs. Without considering antecedent factors, the TAM provides only very general information on users‟ opinions about a system and does not yield “specific information that can better guide system development” (Mathieson, 1991, p. 173). However, research on technology adoption often produces conflicting findings (Chen, Gillenson, & Sherrel, 2002) and care must be exercised in choosing potential external variables for inclusion in the study. The basis of choice proposed here is a combination of prior empirical evidence and expectations derived from the existing literature.
Subjective Norms
Looking under the Bonnet: Factors Affecting Student Adoption of E-Learning Systems in Jordan Abbad, Morris, and de Nahlik
A subjective norm refers to a person‟s perception that significant others think she should or should not perform the behaviour in question (Fishbein & Ajzen, 1975). Taylor and Todd (1995) use the term “subjective norms” to refer to a person‟s perception of the social pressures put on him or her to perform the behaviour in question. Subjective norms have been found to have a significant direct (Ajzen, 1991; Mathieson, 1991; Taylor & Todd, 1995) and indirect (Venkatesh & Davis, 2000) effect in predicting an individual‟s intention to use computer technology. However, research results are variable. Some studies have found that it is not significant at all (e.g. Davis, 1986), whilst other studies have suggested that the effects of subjective norms decay over time and only remain significant in mandatory settings (Venkatesh & Davis, 2000). More recently, Lee (2006) found that subjective norms significantly influenced perceived usefulness. This study includes subjective norms as an independent variable with the expectation that they will positively influence behavioural intentions to use e-learning.
Internet Experience Studies using the TAM have proposed that an individual‟s experiences with a specific technology influence perceptions of ease of use and usefulness of that technology. In addition, Kerka (1999) argued that learner success in distance learning depends on technical skills in computer operation and Internet navigation as well as the ability to cope with the substantive subject matter. Morss (1999) found empirical evidence that older students who had more experience of the technology used a learning management system (WebCT) more than younger students with less experience of IT.
System Interactivity The key elements of learning processes are the interactions among students themselves, the interactions between faculty and students, and the collaboration in learning that results from these interactions. A major source of developments in e-learning has come via technologies that promote increased learner interaction. Interactions can be either synchronous or asynchronous. Thus, system interactivity is expected to be one of the factors that may affect students‟ adoption of e-learning systems. Davis, Bagozzi, and Warshaw (1989) argued that objective system characteristics have a direct impact on perceived usefulness and ease of use. In a study of the adoption of e-mail and text editors, Davis (1989) found that the TAM fully mediates the effects of system characteristics on usage behaviour.
Self-Efficacy Self-efficacy is an important concept in social learning theory (Bandura, 1977). Self-efficacy is an individual‟s belief in her capability to perform certain behaviours or one‟s personal beliefs about her ability to perform certain tasks successfully. Several studies have found that perceptions of self-efficacy influence decisions about what behaviours to undertake, persistence in attempting certain behaviours, and the actual performance attainments of the individual with respect to those behaviours (Brown & Inouye, 1978; Wood & Bandura, 1989). In the e-learning
Page | 4
Looking under the Bonnet: Factors Affecting Student Adoption of E-Learning Systems in Jordan Abbad, Morris, and de Nahlik
context, self-efficacy is interpreted as a student‟s self-confidence in his or her ability to perform certain learning tasks using a learning management system (LMS). A student who has a strong sense of his capability in dealing with a LMS may have a more positive perception of its ease of use and usefulness and is likely to be more willing to accept and use the system.
Technical Support The availability of technical support is one of the important factors in determining the acceptance of technology for teaching (Williams, 2002). This is especially the case in the beginning stage of technology adoption. Venkatesh (1999) found that facilitating conditions and external control served as anchors that users employ to inform perceived ease of use about information technology. Support as a facilitating condition and external control were strong determinants of perceived ease of use. Empirical evidence shows that e-learning projects that were not successful in achieving their goals did not have access to technical advice and support (Alexander & McKenzie, 1998; Soong, Chan, Chua, & Loh, 2001). Recently, Ngai et al. (2007) extended the TAM to include technical support as an external variable in explaining use of WebCT. Figure 2 shows our initial model. This combines the hypothesised effects drawn from the literature. Letters in brackets show the shortened names for variables that will be used in this paper.
Page | 5
Looking under the Bonnet: Factors Affecting Student Adoption of E-Learning Systems in Jordan Abbad, Morris, and de Nahlik
Methodology Participants in the Study Page | 6 Participants in the study consisted of undergraduate students who were taking the last lecture of the first basic computer literacy classes at the Arab Open University (AOU) in Jordan. Participation in this study was voluntary, and 486 of 654 students (74.3%) who were enrolled in these classes agreed to take part. Sixteen questionnaires with significant levels of missing data were identified and removed from the study. Thus, 470 completed questionnaires were included in the analysis. A summary of demographic characteristics of participants is shown in Table 1. Table 1 Summary of Demographic Characteristics of Research Participants Variable Gender: Male Female Age: Under 20 years 20 - under 30 years 30 - under 40 years Above 40 years Faculties: Faculty of Language Studies Faculty of Business Studies Faculty of Computing Studies Faculty of Educational Studies Faculty of General Studies Occupation: Not working Part-time worker Full-time worker Computer at home: Yes No Internet access at home: Yes No Internet experience: Never
No. of Respondents
Percent (%)
151 319
32 68
31 283 133 23
6.6 60.2 28.3 4.9
120 72 60 214 4
25.5 15.3 12.8 45.5 0.9
200 54 216
42.5 11.5 46
381 89
81 19
210 260
44.7 55.3
71
15.1
Looking under the Bonnet: Factors Affecting Student Adoption of E-Learning Systems in Jordan Abbad, Morris, and de Nahlik
Less than 1 year 1 – 2 years More than 2 years
127 65 207
27 13.9 44
The Research Instrument A majority of studies using the TAM have relied on survey methodology for data collection. The survey method used in this study is similar to that used in previous TAM studies, thus enabling continuity and comparability with previous research. A seven-point Likert scale was used to measure students‟ level of agreement or disagreement with 36 items. These items were adapted and refined from previous studies (e.g., Davis, 1986; Ajzen, 1991) to make them more specifically relevant to the current research. Appendix A specifies the survey items used in the final estimation of the model. Since Arabic is the main language spoken in Jordan, the empirical study was conducted in the Arabic language. The original survey instrument was developed in English and then independently translated into Arabic by two expert bilingual speakers with a general knowledge of higher education. The two versions were compared and a final version agreed upon. The Arabic version was pilot tested using 30 Arab Open University students to ensure usability.
Research Methods This research uses a three-stage approach. Firstly, previous studies were reviewed to help build an initial model based on the TAM approach. Secondly, a survey was constructed to provide measures of the factors identified; the measures were further developed using confirmatory factor analysis (CFA). Finally, a structural model (summarised in Figure 2) was developed and estimated using structural equation modelling (SEM) techniques. SEM is a comprehensive statistical approach to testing hypotheses about relationships among observed and latent variables (Hoyle & Panter, 1995). A major advantage of SEM is the ability to estimate a complete model incorporating both measurement and structural considerations. In SEM the measurement model shows the statistical relationship between the latent and observable (also known as measured or indicator) variables. The measurement model does not look at relationships between latent variables. Here latent variables are those shown in the boxes of Figure 2, whilst the measured variables are the sets of responses to the individual survey questions. Thus latent variables (often called factors) are not measured directly but are estimated from observed variables. Once the measurement model that best explains the relationships has been identified or “confirmed” (i.e., uses the fewest observed variables to measure the latent variables), the structural model is estimated. This estimates potential causal dependencies between the latent variables. The structural model is usually expressed as a diagram known as a path model. SEM techniques have been widely used in measuring user acceptance of information technology (Chau, 1996; Venkatesh, Morris, Davis, & Davis, 2003). In relation to technology uptake, a number of published studies have adopted the SEM approach; examples include Moon and Kim (2001), Selim (2003), Venkatesh (1999), and Venkatesh and Davis (2000). However, it is not the
Page | 7
Looking under the Bonnet: Factors Affecting Student Adoption of E-Learning Systems in Jordan Abbad, Morris, and de Nahlik
purpose of this paper to provide a full discussion of SEM techniques and a full account can be found in Bollen (1998). Confirmatory factor analysis (CFA) was used as the first step of the two-step sequence of analysis (identifying the measurement model). Revisions to the model were made based upon the general guidelines suggested by MacCallum (1986) and Anderson and Gerbing (1988). As a general rule, modifications are made one at a time since a single change might affect other parts of the solution. CFA was conducted using AMOS 7. In practice, several survey items are often statistically associated with (loaded on) more than one latent variable (factor). Each of these items is removed from the estimation model one at a time, and the model re-estimated. The general sequence of item deletion begins with the item having the most factors loaded. The remaining items are used in final (measurement) model estimation. Cronbach‟s α is usually used to assess the internal consistency of the multi-item scales.
Results Model Estimation Initial model estimation indicated a poor model fit. Six common model-fit measures were used to assess the model‟s overall goodness-of-fit: the ratio of χ2 to degrees-of-freedom, goodness-of-fit index, adjusted goodness-of-fit index, normalized fit index, comparative fit index and root mean square error of approximation. The initial model was only acceptable on the root mean square error of approximation test. The final model was derived through the process of progressively deleting items and re-estimating the model. In terms of overall goodness-of-fit, the final model met all six of the criteria identified above. The model also met Bollen‟s (1998) criteria for identification. Appendix A shows the items used in the final model estimation. The α score for each of the eight factors was higher than the usually accepted threshold level of 0.7 as Table 2 shows. Table 2 Composite Reliability Factor
Variables
Perceived Usefulness
PU1 PU3 PU4 PEU3 PEU4 PEU6 IU1
Perceived Ease of Use
Intention to Use
Composite Reliability α 0.847
0.874
0.877
Page | 8
Looking under the Bonnet: Factors Affecting Student Adoption of E-Learning Systems in Jordan Abbad, Morris, and de Nahlik
IU2 IU3 IU4 SN2 SN3 SN4 IE2 IE3 SI1 SI2 SI3 SE2 SE3 SE4 TS2 TS3
Subjective Norms
Internet Experiences System Interactivity
Self-Efficacy
Technical Support
0.844
Page | 9 0.864 0.846
0.836
0.802
Discriminant validity is the extent to which a given statistical construct (here a latent variable) is distinct from other constructs (Hair, Black, Babin, Anderson, & Tatham, 2006). Thus, high discriminant validity provides evidence that a statistical construct is unique and captures some phenomenon that other measures do not. Discriminant validity is said to be present when crosscorrelations between indicators measuring different factors are not excessively high and, therefore, correlations between the latent variables (factors) are only moderately strong (Kline, 1998). As shown in Table 3, factor correlation coefficients, ranging from 0.389 to 0.797, all indicated that the eight constructs were correlated yet distinct constructs and, therefore, provided a strong evidence of discriminant validity. Generally, a cross-factor correlation of 0.85 or higher indicates that the two factors might be measuring the same underlying constructs. Table 3 Factor Correlations
PEU PU ITU TS SE SI IE SN
PEU 1 0.715 0.797 0.416 0.727 0.491 0.598 0.508
PU
ITU
TS
SE
SI
IE
SN
1 0.791 0.52 0.64 0.541 0.441 0.551
1 0.474 0.691 0.585 0.516 0.558
1 0.452 0.519 0.438 0.389
1 0.638 0.6 0.57
1 0.477 0.65
1 0.456
1
Looking under the Bonnet: Factors Affecting Student Adoption of E-Learning Systems in Jordan Abbad, Morris, and de Nahlik
Correlations greater than 0.3 for the sample size of 470 used in the analysis are statistically significant at the 0.01 level. An inspection of the correlation matrix reveals that all of the interitem correlations were significant (greater than 0.3) at the 0.01 level. The correlation matrix for the survey items (as opposed to the factor correlations discussed here) is shown in Appendix C.
Page | 10
The Structural Model CFA alone is limited in its ability to examine the nature of relationships between variables beyond simple correlations (Hair et al., 2006). A structural theory is a conceptual representation of the relationships between constructs. It can be expressed in terms of a structural model that represents the theory with a set of structural equations and is usually expressed in a visual form. A path analysis for the structural equation model with latent variables (see Appendix D) was performed to evaluate the hypothesized relationships that help predict students‟ behavioural intentions to use e-learning systems. The commonly used measures of model fit, based on results from an analysis of the structural model, are summarized in Table 4. The results indicated an acceptable fit to the data. The model was also fully identified according to Bollen‟s (1998) criteria. Table 4 SEM Statistics of Model Fit Model goodness-fit indexes Chi-square Degrees of freedom Chi-square/degree of freedom Goodness-of-fit index Adjusted goodness-of-fit index Normalized fit index Comparative fit index Root mean square error of approximation
Recommended value
≤ 3.0 ≥ 0.90 ≥ 0.80 ≥ 0.90 ≥ 0.90 ≤ 0.08
Result in this study 504.533 * 208 2.426 0.914 0.886 0.927 0.955 0.055
Note: N = 470, * p< 0.05
Table 5 shows the effects of the observed variables on the latent variables. These do not show causality in other than a statistical sense; although, of course, we have a priori reasons (discussed at the outset of this paper) to believe that causality in the wider sense is present. Direct effects are those where a change in variable x results in a change in variable y (x → y). Indirect effects occur when the change in variable y contingent on a change in x operates through a third variable z (x → z → y). The total effect is the sum of the direct and indirect effects and is the correlation between the two variables. Following Cohen (1992), total effects of greater than 0.5 can be said to be of medium strength whilst those in the 0.2 to 0.5 range can be said to be small (large effects require correlations of 0.8 or more.) Effects of size greater than 0.2 are shown in bold. R 2 (the
Looking under the Bonnet: Factors Affecting Student Adoption of E-Learning Systems in Jordan Abbad, Morris, and de Nahlik
coefficient of determination) is a measure of the proportion of the variability in a particular variable explained by the model; for example, the model explained 75% of the variability in Intention to Use. Table 5
Page | 11 Standardized Causal Effects Factor Determinant Perceived Ease IE SI of Use SE TS (R2 = 0.580 Perceived PEU SN Usefulness IE SI 2 (R = 0.613) SE TS Intention to PU Use PEU SN 2 IE (R = 0.75) SI SE TS
Direct Effect 0.233 0.001 0.567 0.062 0.495 0.162 -0.129 0.064 0.130 0.218 0.412 0.450 0.119 -
Indirect Effect 0.115 0.001 0.280 0.031 0.204 0.067 0.099 0.027 0.424 0.130
Total Effect 0.233 0.001 0.567 0.062 0.495 0.162 -0.014 0.064 0.411 0.249 0.412 0.654 0.185 0.099 0.027 0.424 0.130
However the information in Table 5 is not sufficient to tell whether or not a particular path value is (statistically) significant. To test for this we need to compare the estimates of the path values with the variability in those estimates. Table 6 shows the critical ratios (t-test values) obtained by dividing the path values by their standard errors. Table 6 Results of Path Tests Path IE →PEU SI → PEU SE → PEU TS → PEU SN →PU PEU → PU
Critical Ratio 4.199 0.019 7.788 1.182 2.647 6.734
Sig. Level 0.001 0.985 0.001 0.237 0.008 0.001
Comment Sig. Not Sig. Sig. Not Sig. Sig. Sig.
Looking under the Bonnet: Factors Affecting Student Adoption of E-Learning Systems in Jordan Abbad, Morris, and de Nahlik
IE → PU SI → PU SE → PU TS → PU SN → ITU PEU → ITU PU → ITU
-2.280 0.919 1.616 4.096 2.742 7.765 6.601
0.023 0.358 0.106 0.001 0.006 0.001 0.001
Sig. Not Sig. Not Sig. Sig. Sig. Sig. Sig.
The results shown in Tables 5 and 6 should be interpreted together. Note that Table 6 does not include paths with indirect-only effects. A path with a small effect can satisfy the t-test if the standard error is also very small. However, the fact remains that the effect is so small it indicates no „real‟ effect. This occurs in three cases (SN → PU, IE → PU and SN → ITU). Similarly a path with an acceptable effect coefficient can have a large standard error and thus not be significant on a t-test. This occurs with the SE → PU path. Only paths that satisfy both tests can usefully be regarded as being statistically significant. These are shown in bold in Table 6.
Results The final model is summarised in Figure 3. Heavier lines indicate the stronger effects; thinner lines indicate small effects. The arrows show the implied direction of causality in the relationships between factors.
Page | 12
Looking under the Bonnet: Factors Affecting Student Adoption of E-Learning Systems in Jordan Abbad, Morris, and de Nahlik
Another way of representing our results is through the estimated structural equations for the model, which are as follows: PU = 0.476PEU + 0.167SN – 0.102IE + 0.146SE + 0.194TS R2 = 0.613
Page | 13 PEU = 0.191IE + 0.001SI + 0.659SE + 0.057TS R2 = 0.580 IU = 0.434PU + 0.456PEU + 0.129SN R2 = 0.75 The findings show that self-efficacy is an important determinant of perceived ease of use. This is consistent with the results of Venkatesh and Davis (1996). Self-efficacy showed a strong direct effect (0.567) on perceived ease of use. The result is also consistent with that of Davis (1989), who argued that computer self-efficacy and perceived ease of use are related and similar. A student‟s prior Internet experience has a statistically significant influence upon perceived ease of use but not perceived usefulness. This finding is at variance with those of Igbaria, Gamers, and Davis (1995), who found that the level of computing experience had a significant direct influence on perceived usefulness and perceived ease of use. Previous studies have demonstrated mixed results where the effects of subjective norms are concerned. Venkatesh and Davis (2000) showed a direct effect between subjective norms and both intention to use a system and perceived usefulness. Previous findings (Davis et al., 1989; Mathieson, 1991) failed to establish statistically significant relationships between these variables, as is the case here. Of course different studies refer to different times, places, technologies, and cultural contexts, and this is a potentially persuasive reason why they are not necessarily comparable. System interactivity refers to students‟ perceptions of the system‟s ability to provide interactive communication between instructor and students and among students. This study does not provide any evidence that system interactivity affects students‟ adoption of e-learning systems. Perceptions of the level of technical support available to users were found to have a direct effect on perceived usefulness and reasonable indirect effect on intention to use. This result was consistent with that of Ngai et al. (2007).
Discussion The primary objective of this study is to analyse the factors influencing students‟ acceptance of elearning. Previous findings from the field of technology acceptance research suggest that for the advantages of a technology to be attained, the technology must be accepted and used (Venkatesh
Looking under the Bonnet: Factors Affecting Student Adoption of E-Learning Systems in Jordan Abbad, Morris, and de Nahlik
et al., 2003). The application of the TAM to e-learning is relatively new, and the power of SEM has the potential to add new insights into the factors underpinning students‟ acceptance of elearning technology. The location of the study in Jordan, a developing country, is also a needed departure from the bulk of previous work. Our results lead to four conclusions: 1. Students who are frequent and/or heavy users of the Internet are more likely to use elearning systems. 2. Students who are confident in their ability to master an e-learning system, without help, are more likely to become users. 3. Students are reassured by the availability of back-up technical support. 4. Students believe that an e-learning system will be more useful to them if it is easy to use. Of course we may argue that such conclusions are unsurprising and perhaps even uninspiring, but they may also point to a latent construct around the areas of confidence and path dependence from prior learning trajectories which form future areas of research, for example, de Nahlik and Morris (2008). However the “negative” findings are also of interest. Frequent Internet users are more likely to use e-learning systems because they believe they will be easy to use rather than useful per se. This apparently contradicts the 2006 study by Efferson et al. but suggests that the payoff is of lesser importance. However, again this offers future research possibilities in that it could be explained by deconstructing perceptions of use and the nature of the payoff, to use the Efferson et al. (2006) construct. It may be that the study award is not perceived in the same way as “usefulness” but relates to perceptions of a higher order goal, which could, for example, be conceptualised by returning to Maslow (1943) and his level of “esteem” constructs. The effects of Internet use on beliefs about LMS usefulness are an indirect product of perceptions of how easy to use a system might be. On the other hand the availability of technical support is a direct influence on perceived usefulness but not ease of use. This would seem to suggest that a well-designed e-learning system or LMS should have a reassuring and intuitive user interface, which promotes confidence among potential users. There is no strong evidence in our work that subjective norms or system interactivity influences students‟ intentions to use e-learning systems. Whilst the former is of no great consequence for the design of e-learning systems, the latter would seem to run counter to our aims to develop collaborative e-learning pedagogies. The development of e-learning is in its infancy in Jordan and it may well be that students‟ expectations of e-learning systems did not embrace communication capabilities. Indeed the results for system interactivity and subjective norms may reinforce each other. If there is no great expectation that an e-learning system will be used for communication purposes then there will be little peer pressure to use the system.
Page | 14
Looking under the Bonnet: Factors Affecting Student Adoption of E-Learning Systems in Jordan Abbad, Morris, and de Nahlik
Finally, given the subject of this special edition of IRRODL, it may also be worth considering and celebrating differences in linguistic structures and social patterns of interactions. Cultures that are more focused on oral traditions may be less engaged with e-learning (other than as a conduit to information) and may use existing social interactive structures that lie outside of any LMS to collaborate. Much e-learning material is prepared using Western pedagogic models. Are we using a less appropriate cultural lens to explore this subject?
Page | 15
Looking under the Bonnet: Factors Affecting Student Adoption of E-Learning Systems in Jordan Abbad, Morris, and de Nahlik
References Ajzen, I. (1991). The theory of planned behavior. Organization Behavior and Human Decision Process, 50, 179-211. Alexander, S. & McKenzie, J. (1998). An evaluation of information technology projects in university learning. Department of Employment, Education and Training and Youth Affairs, Canberra: Australian Government Publishing Services. Anderson, J.C. & Gerbing, D.W. (1988). Structural equation modeling in practice: A review and recommended two-step approach. Psychological Bulletin, 103(3), 411- 423. Bandura, A. (1977). Self-efficacy: Toward a unifying theory of behavioral change. Psychological Review, 84(2), 191–215. Bernadette, S., (1996). Empirical evaluation of the revised „Technology Acceptance Model‟. Management Science, 42(1), 85-93. Bollen, P.M. (1998). Structural equations with latent variables. New York: Wiley. Brown, I. Jr., & Inouye, D.K. (1978). Learned helplessness through modeling: The role of perceived similarity in competence. Journal of Personality and Social Psychology, 36(8), 900-908. Carswell, A. D. & Venkatesh, V. (2002). Learner outcomes in an asynchronous distance educational environment. International Journal of Human-Computer Studies. 56(5), 475494. Chau, P.Y.K. (1996). An empirical assessment of a modified technology acceptance model. Journal of Management Information Systems, 13(2), 185–204. Chen L., Gillenson, M.L., & Sherrell, D.L. (2002). Enticing online consumers: An extended technology acceptance perspective. Information and Management, 39(8), 705–719. Cohen, J. (1992). A power primer. Psychological Bulletin, 11, 155-159. Davis, F. D. (1986). A technology acceptance model for empirically testing new end-user information systems: Theory and results. Doctoral dissertation, Sloan School of Management, Massachusetts Institute of Technology. Davis, F.D. (1989). Perceived usefulness, perceived ease of use, and user acceptance of information technology. MIS Quarterly, 13(3), 319-340.
Page | 16
Looking under the Bonnet: Factors Affecting Student Adoption of E-Learning Systems in Jordan Abbad, Morris, and de Nahlik
Davis, F.D., Bagozzi, R.P., & Warshaw, P.R. (1989). User acceptance of computer technology: A comparison of two theoretical models. Management Science, 35(8), 982. de Nahlik, C.F. & Morris, D. (2008). Different roads: The impact of prior learning trajectories and the successful integration of international students in a UK university. Working paper in progress available at https://curve.coventry.ac.uk/cu/access/search.do?method=basic&qs.query=different+road s&x=13&y=11 Di Benedetto, C. A., Calantone, R. J., & Zhang, C. (2003). International technology transfer: Model and exploratory study in the People‟s Republic of China. International Marketing Review, 20(4), 446-462. Efferson, C., Lalive, R., Richerson, P., Mcelreath, R., & Lubell, M. (2006). Models and antimodels: The structure of payoff-dependent social learning. Zurich IEER Working Paper No. 290, (May 2006). Available at SSRN: http://ssrn.com/abstract=905250 ELCU (2002). Jordan will become IT hub for the region. E-Learning Coordination Unit: Ministry of Education, Jordan. Available at http://www.moe.gov.jo/learning/vision_11.htm Fishbein, M. & Ajzen, I. (1975). Belief, attitude, intention and behavior: An introduction to theory and research. Reading, MA: Addison-Wesley. Gefen, D. & Straub, D. (1997). Gender differences in the perception and use of e-mail: An extension to the Technology Acceptance Model. Management Information Systems Quarterly, 21(4), 389-400. Hair, J., Black, B., Babin, B., Anderson, R. E., & Tatham, R.L. (2006). Multivariate data analysis (6th ed.). Englewood Cliffs: Prentice Hall. Hasan, H. & Ditsa, G., (1998). The impact of culture on the adoption of IT: An interpretive study. Journal of Global Information Management, 7(1), 5-15. Hoyle, R. H. and Panter, A. T., (1995). Writing about structural equation models. In R. H. Hoyle (Ed.), Structural equation modeling (pp. 158-176). Thousand Oaks, CA: Sage. Igbaria, M., Gamers, T., & Davis, G.B. (1995). Testing the determinants of micro-computer usage via a structural equation model. Journal of Management Information Systems, 11(4), 87-114. Keller, C. & Cernerud, L. (2002). Students‟ perception of e-learning in university education.
Page | 17
Looking under the Bonnet: Factors Affecting Student Adoption of E-Learning Systems in Jordan Abbad, Morris, and de Nahlik
Learning, Media and Technology, 27(1), 55-67. Kerka, S. (1999). Distance learning, the Internet, and the World Wide Web. ERIC Digest. (ERIC Document Reproduction Service No. ED 395214). Kline, R.B., (1998). Principles and practice of structural equation modeling. New York, NY: The Guilford Press. LaRose, R., Gregg, J., & Eastin, M. (1998). Audio graphic tele-courses for the Web: An experiment. Journal of Computer Mediated Communications, 4(2). Lee, Ya-Ching. (2006). An empirical investigation into factors influencing the adoption of an e-learning system. Online Information Review, 30(5), 517-541. MacCallum, R.C. (1986). Specification searches in covariance structure modeling. Psychological Bulletin, 101(1), 107-120. Mahmood, M. A., Hall, L., & Swanberg, D. L. (2001). Factors affecting information technology usage: A meta-analysis of the empirical literature. Journal of Organizational Computing and Electronic Commerce, 11(2), 107-130. Maslow, A. H. (1943). A theory of human motivation. Psychological Review, 50, 370-396. Mathieson, K. (1991). Predicting user intentions: comparing the Technology Acceptance Model with the theory of planned behavior. Information Systems Research, 2(3), 173191. Moon, J. & Kim, Y. (2001). Extending the TAM for a World Wide Web context. Information and Management, 38(4), 217-231. Morss, D.A. (1999). A study of student perspectives on Web-based learning: WebCT in the classroom. Internet Research, 9(5), 393–408. Nasser, R. & Abouchedid, K. (2000). Attitudes and concerns towards distance education: The case of Lebanon. Online Journal of Distance Learning Administration, 3(4), 1-10. Ngai, E.W.T., Poon, J.K.L., & Chan, Y.H.C. (2007). Empirical examination of the adoption of WebCT using TAM. Computers & Education, 48(2), 250-267. Riemenschneider, C. K. & McKinney, V. R. (2001). Assessing belief differences in small business adopters and non-adopters of web-based E-commerce. Journal of Computer Information Systems, 42(2), 101-107.
Page | 18
Looking under the Bonnet: Factors Affecting Student Adoption of E-Learning Systems in Jordan Abbad, Morris, and de Nahlik
Saadē, R. & Bahli, B (2005). The impact of cognitive absorption on perceived usefulness and perceived ease of use in on-line learning: an extension of technology acceptance model. Information & Management, 42(2), 317-327. Selim, H.M. (2003). An empirical investigation of student acceptance of a course websites. Computers & Education, 40(4), 343-360. Soong, M.H.B., Chan H.C., Chua, B.C., & Loh, K.F. (2001). Critical success factors for online course resources. Computers & Education, 36(2), 101-120. Taylor, S. & Todd, P.A. (1995). Understanding information technology usage: a test of competing models. Information Systems Research, 6(2), 144-176. Venkatesh, V. (1999). Creation of favorable user perceptions: exploring the role of intrinsic motivation. Management Information Systems Quarterly, 23(2), 239-60. Venkatesh, V. & Davis, F.D. (1996). A model of the antecedents of perceived ease of use: development and test. Decision Sciences, 27(3), 451-81. Venkatesh, V. & Davis, F. D. (2000). A theoretical extension of the technology acceptance model: Four longitudinal field studies. Management Science, 46(2), 186-204. Venkatesh, V., Morris, M.G., Davis, G.B., & Davis, F. D. (2003). User acceptance of information technology: Toward a unified view. Management Information Systems Quarterly, 27(3), 426-478 Williams, P. (2002). The Learning Web: the development, implementation, and evaluation of Internet-based undergraduate materials for the teaching of key skills. Active Learning in Higher Education, 3(1), 40-53. Wood, R. & Bandura, A. (1989). Social cognitive theory of organizational management. Academy of Management Review, 14(3), 361-384.
Page | 19
Looking under the Bonnet: Factors Affecting Student Adoption of E-Learning Systems in Jordan Abbad, Morris, and de Nahlik
Appendix A Survey Items Used in the Final Estimation of the Model Previous Studies Davis, 1986
Perceived usefulness PU1 PU3 PU4
Davis, 1986
Page | 20
PEU 3 PEU 4 PEU 6
Davis, 1986
IU1 IU2 IU3 IU4
Venkatesh, 1999
TS2 TS3
Tan and IE2 Teo, 2000 IE3 Ajzen, 1991
SN2 SN3 SN4
Davis, 1989
SI1 SI2 SI3
Tan and SE2 Teo, 2000
Using the e-learning system (LMS) would allow me to accomplish learning tasks more quickly Using the LMS would enhance my effectiveness in learning Using the LMS would increase my productivity in learning Perceived ease of use My interaction with the LMS is clear and understandable Getting the information from the LMS is easy Overall, I find the LMS easy to use Intention to use I intend to use the LMS to study I intend to study other subjects through a LMS I intend to increase my use of the LMS in the future Having used the LMS, I would recommend it to my colleagues to use it for study purposes Technical support A hotline is available when there is technical problem E-mail enquiries can be made when there is technical problem Internet experience I spend many hours using the Internet I frequently use the Internet Subjective norms My instructors think that I should use LMS People who are important to me think that I should use LMS People who are influence my behaviour think that I should use LMS System interactivity The LMS enables interactive communications between instructor and students The LMS enables interactive communications among students The communicational tools (e-mail, chat room, forum, etc) in the LMS are effective Self-efficacy I am confident of using the LMS even if there is no one around to show me how to do it
Looking under the Bonnet: Factors Affecting Student Adoption of E-Learning Systems in Jordan Abbad, Morris, and de Nahlik
SE3 SE4
I am confident of using the LMS even if I have never used such a system before I am confident of using the LMS as long as someone shows me how to do it
Page | 21
Looking under the Bonnet: Factors Affecting Student Adoption of E-Learning Systems in Jordan Abbad, Morris, and de Nahlik
Appendix B Factor Loadings Item PU1 PU2 PU3 PU4 PU5 PU6 PEU1 PEU2 PEU3 PEU4 PEU5 PEU6 IU1 IU2 IU3 IU4 ATT1 ATT2 ATT3 ATT4 TS1 TS2 TS3 TS4 TS5 IE1 IE2 IE3 SN1 SN2 SN3 SN4 SI1 SI2 SI3 SE1 SE2
Component 1 2 .261 .663 .251 .770 .256 .728 .289 .681 .267 .664 .285 .640 .187 .403 .304 .474 .290 .238 .348 .251 .314 .229 .327 .243 .355 .592 .136 .628 .293 .664 .394 .614 .275 .713 .432 .622 .247 .601 .207 .692 .234 .168 .061 .204 .167 .198 .226 .112 .106 .083 .188 .120 .122 .100 .144 .150 .258 .118 .147 .127 .148 .213 .115 .232 .156 .158 .166 .062 .241 .208 .303 .150 .202 .188
3 .191 .065 .179 .179 .366 .398 .614 .489 .732 .620 .580 .631 .303 .381 .151 .182 .199 .147 .227 .216 .222 .001 -.009 .344 .359 .262 .212 .156 .130 .214 .107 .026 .091 .024 .099 .278 .275
4 .173 .149 .235 .219 .014 .063 .086 .191 .142 .243 .356 .299 .111 .165 .201 .104 .156 .224 .313 .197 .080 .111 .140 .031 .238 .282 .185 .136 .251 .147 .158 .168 .168 .168 .152 .487 .632
5 .003 .187 .196 .093 .233 .229 .217 .151 .152 .150 .051 .091 .092 .081 .188 .188 .187 .126 .032 .201 .270 .107 .072 .079 .052 .085 .147 .170 .638 .786 .794 .676 .202 .202 .204 .218 .081
6 .256 .136 .158 .139 .163 .116 .111 .157 .145 .158 .012 .067 .068 .143 .151 .190 .126 .092 .145 .190 .545 .782 .820 .663 .442 .053 .173 .159 .236 .141 .061 .051 .174 .200 .144 .239 .152
7 .143 .125 .158 .102 .055 .086 .107 .092 .090 .117 .030 .041 .226 .135 .107 .082 .123 .163 .261 .144 .248 .120 .094 .202 .440 .245 .092 .129 .119 .091 .206 .372 .782 .789 .670 .330 .213
8 .137 .184 .001 .066 .084 .100 .189 .121 .168 .130 .316 .257 .193 .161 .182 .132 .107 .063 .038 .065 -.050 .179 .091 .134 .141 .633 .795 .838 .236 .067 .102 .126 .100 .098 .203 .139 .274
Page | 22
Looking under the Bonnet: Factors Affecting Student Adoption of E-Learning Systems in Jordan Abbad, Morris, and de Nahlik
SE3 SE4 SE5
.247 .192 .193
.092 .193 .238
Note: Factor loadings in bold
.250 .089 .111
.738 .712 .765
.159 .187 .283
.142 .058 .109
.150 .271 .036
.169 .102 .166
Page | 23
Looking under the Bonnet: Factors Affecting Student Adoption of E-Learning Systems in Jordan Abbad, Morris, and de Nahlik
Appendix C Survey Item Cross-Correlations PEU3 PEU3 1 PEU4 0.708 PEU6 0.684 0.461 PU1 0.498 PU3 0.474 PU4 0.548 IU1 0.515 IU2 0.537 IU3 0.521 IU4 0.279 TS2 0.286 TS3 0.504 SE2 0.501 SE3 0.432 SE4 0.334 SI1 0.33 SI2 0.318 SI3 0.429 IE2 0.435 IE3 0.321 SN2 0.356 SN3 0.337 SN4
PEU4 PEU6 PU1 PU3 PU4 IU1
IU2
IU3
IU4
TS2
TS3
SE2
SE3
SE4
| 24 SI3 SI1Page SI2
IE2
IE3
SN2 SN3 SN4
1 0.705 0.476 0.514 0.488 0.564 0.531 0.554 0.536 0.287 0.295 0.519 0.516 0.445 0.344 0.34 0.328 0.442 0.448 0.331 0.367 0.347
1 0.63 0.61 0.3 0.31 0.45 0.45 0.39 0.37 0.37 0.36 0.35 0.35 0.33 0.37 0.35
1 0.64 0.31 0.32 0.47 0.47 0.4 0.39 0.39 0.37 0.36 0.37 0.35 0.38 0.36
1 0.3 0.31 0.46 0.45 0.39 0.38 0.37 0.36 0.35 0.36 0.34 0.37 0.35
1 0.67 0.31 0.3 0.26 0.34 0.34 0.33 0.31 0.31 0.24 0.27 0.25
1 0.31 0.31 0.27 0.35 0.35 0.34 0.32 0.32 0.25 0.27 0.26
1 0.7 0.6 0.44 0.43 0.42 0.43 0.44 0.36 0.4 0.38
1 0.6 0.44 0.43 0.42 0.43 0.44 0.36 0.4 0.38
1 0.38 0.37 0.36 0.37 0.38 0.31 0.35 0.33
1 0.67 0.64 0.34 0.34 0.41 0.45 0.43
1 0.76 0.3 0.33 0.32
1 0.31 0.34 0.32
1 0.65 0.61
1 0.46 0.497 0.472 0.546 0.513 0.536 0.519 0.278 0.285 0.502 0.5 0.431 0.333 0.329 0.317 0.428 0.433 0.32 0.355 0.336
1 0.66 0.62 0.51 0.48 0.5 0.49 0.33 0.34 0.42 0.42 0.36 0.35 0.34 0.33 0.3 0.3 0.33 0.36 0.34
1 0.67 0.55 0.52 0.54 0.53 0.35 0.36 0.45 0.45 0.39 0.37 0.37 0.36 0.32 0.33 0.35 0.39 0.37
1 0.52 0.49 0.52 0.5 0.34 0.35 0.43 0.43 0.37 0.36 0.35 0.34 0.31 0.31 0.34 0.37 0.35
1 0.65 0.67 0.65 0.32 0.33 0.48 0.48 0.41 0.4 0.39 0.38 0.37 0.38 0.35 0.39 0.37
1 0.63 0.34 0.34 0.4 0.45 0.42
1 0.32 0.33 0.39 0.43 0.41
1 0.68
1
Appendix D Structural Model