Vol. 1/No. 1 (2009)
INTERNETWORKING INDONESIA JOURNAL
11
Loop-back Action Latency Performance of an Industrial Data Communication Protocol on a PLC Ethernet Network Endra Joelianto, Member IEEE, and Hosana
Abstract—One of the well known industrial data communication protocols is Modbus which is widely used in industrial automation due to its availability. Modbus protocol can be implemented in many ways according to its network. Network using serial RS485 is well known in industry especially for long range communication, but realtime input/output (I/O) communication over ethernet is fairly new in the industrial environment. There are many questions about the reliability and performance of the Modbus for its optimization especially in its networking. Performance metrics and tests for IT infrastructure equipment have been used for many years, but now with realtime communication being used more, users are asking whether their desktop, laptop, or palm computer can handle the performance requirements of these network intensive applications. These same questions can be asked for industrial equipments as well, such as Programmable Logic Controller (PLC) ethernet networks. In this paper, serial communication RS 485 and TCP/IP are used as physics of Modbus data communication protocol. Action latency performance of this protocol will be tested on the ethernet network. An extension of the ethernet network with serial RS485 network will also be considered in relation with two different network topologies. The algorithm that used to test Modbus is the Media Access Control (MAC) algorithm, which mainly determines the performance of a network. Index Terms— Industrial ethernet networking, Modbus, TCP/IP, MAC, programmable logic controller.
C
I. INTRODUCTION
onventional industrial sequential control systems adopt a master-slave centralized control approach. A central controller (master) makes major control decisions and controls low-level I/O devices via point-to-point connections. Although it is reliable, this control architecture is inflexible Manuscript received March 27, 2009. This work was partially supported by the Incentive Research Program, State Ministry of Research and Technology, Indonesia under Grant 97M/Kp/XI/2007. E. Joelianto is with the Instrumentation and Control Research Group, Department of Engineering Physics, Bandung Institute of Technology, Bandung 40132, Indonesia (corresponding author phone: +62-22-2504424; fax: +62-22-2506281; e-mail:
[email protected]). Hosana was with the Instrumentation and Control Research Group, Department of Engineering Physics, Bandung Institute of Technology, Bandung 40132, Indonesia.
for long implementation and reconfiguration time. Industrial equipment vendors and users were primarily concerned with inherent nondeterministic performance of industrial communication network characteristics. In general, there is no guarantee the data transmitted over wire by the source will reach the destination. This is unacceptable in the industrial world. Therefore, new protocols and methods have been developed to overcome these limitations [1]. With the development of the computer network technology and intelligent sensors and actuators, Modbus technology is being used more and more widely nowadays. Modbus is a network for connecting field devices: sensors, actuators and field controllers such as PLCs, regulators, driver controllers and so on. It is a kind of realtime communication systems and is based on a layered structure deduced from the seven layers OSI model. For time-critical control systems such as realtime control system, to reduce message delay is one of the major considerations. While for safety-critical systems such as fire alarm systems, to avoid data loss is of high importance. For different control systems, different approaches are adopted according to the requirements of the system [2]. The enterprise performance management of data network is becoming more important as computer networks grow in size and complexity. An increase in frequency, type and severity of faults occurring on these networks has been linked to this growth. Monitoring changes in topology and traffic flow is essential for management of dynamic communication networks. For automation users, deterministic performance of the Modbus is essential for control, messaging and large data acquisition applications. Simply deploying the latest switching technologies may not ensure determinism if those features are not carefully designed. A comprehensive examination of the network communications matrix, message traffic, host protocols used, and capabilities of the infrastructure can lead to greater performance and reliability for investment. Schneider Automation NCSE’s has identified those inefficiencies that rob performance such as reported in [3]: (1) System bottlenecks and congested message queues, (2) Unauthorized hosts or devices on networks, (3) Unnecessary Protocol in use, (4) Excessive collisions, errors and delays, (5) Excessive broadcast or multicast traffic from switches, routers and PC’s. Identifying and correcting problems in these areas will
ISSN: 1942-9703 / © 2009 IIJ
12
INTERNETWORKING INDONESIA JOURNAL
produce a cleaner, faster and more effective network. One example of Modbus that functions well at this moment and is able to solve a few problems that have not been solved before is Modbus TCP application on a ship [4]. The main control system is able to manage generation and distribution energy in the ship and also to manage the cargo. Modbus TCP in the ship is used to manage and control all the main system, such as propulsion system, electricity distribution, heating, air conditioning, pump, technical equipment, security, state monitoring, etc. This project was started in 2002 where Aker Kaerner proposed implementation of a Modbus TCP based Transparent Ready solution for the Viking Dynamic, a platform supply vessel managed by Eidesvik AS. The system uses web-enabled architecture that transmits data directly to the ship owner via the ship’s satellite connection. The use of remote diagnostics also generates savings because maintenance can be planned in advance and new parts can be ordered before the ship gets back to its home port. This is good news as the vessel spends less time at dock which reduces port fees. There were several reasons that contributed directly to the success of the project. First, because of the open nature of the architecture, it facilitated collaboration between people, system, and products. Second, it permitted easy access to data using universal technologies, i.e. ethernet TCP/IP via Modbus and the Internet that people were already familiar and comfortable with. Security problems were solved by building the architecture through the use of dedicated components such as routers, firewalls, and virtual private networks for the Modbus TCP application. The architecture allowed remote appraisals or diagnostics of installations, machines, panel boards and other equipment at less costs and without special training since most encounters with these things are no more than looking at a web page. Moreover, human machine interface (HMI) could be located in a computer anywhere with easy and secure access to a network, public or private. This application shows that by using Modbus TCP many problems in automation can be solved and brings a new way to develop automation projects [4]. Our research is focused on the performance of Modbus protocols in PLC. In this research, a widely used Modbus, serial RS485 and TCP will be tested on a PLC Twido network. Mathematical analysis is taken to evaluate the realtime performance of the system with respect to the throughput as well as the message delay. The remainder of the paper is organized as follows. In section 2, we describe the basic theory of Modbus, PLC, Topology, MAC algorithm and performance testing methodology. In section 3, we describe the experiment that have been done, simplify the model and give some assumptions. In section 4, we analyze the Modbus performance and section 5 will give the conclusion.
JOELIANTO ET AL.
II. BASIC THEORY A. Modbus Protocol Modbus is an application layer messaging protocol, positioned at level 7 of the OSI model that provides client/server communication between devices connected on different types of buses or networks. Modbus has been known as industry’s serial de facto standard since 1979 and continues to enable millions of automation devices to communicate. The Internet community can access Modbus at a reserved system port 502 on the TCP/IP stack. Modbus is a request/reply protocol and offers services specified by function codes. Modbus function codes are elements of Modbus request/reply Protocol Data Units (PDUs). Fig. 1 shows the Modbus communication stack.
Fig. 1. Modbus communication stack.
The Modbus protocol allows an easy communication within all types of network architectures. Every type of devices (PLC, HMI, Control Panel, Driver, Motion control, I/O Device, etc) can use Modbus protocol to initiate a remote operation [5]. A networking example of Modbus is shown in Fig. 2.
Fig. 2. The architecture of Modbus networking example.
ISSN: 1942-9703 / © 2009 IIJ
Vol. 1/No. 1 (2009)
INTERNETWORKING INDONESIA JOURNAL
13
B. Modbus Serial Modbus Serial Line protocol is a Master-Slave protocol. This protocol takes place at level 2 of the OSI model. A master-slave type system has one node (the master node) that issues explicit commands to one of the slave nodes and processes responses. Slave nodes will not typically transmit data without a request from the master node, and do not communicate with other slaves. The mapping of Modbus protocol on a specific bus or network introduces some additional fields on the Protocol Data Unit (PDU) is shown in Fig. 3. The client that initiates a Modbus transaction builds the Modbus PDU, and then adds fields in order to build the appropriate communication PDU.
Fig. 5. Slave behavior of Modbus.
This following figure shows the time diagram of 3 typical scenarios of Master/Slave communications [6].
Fig. 3. Modbus mapping.
The Modbus data link layer comprises two separate sub layers: • The master/slave protocol • The transmission mode (RTU vs ASCII modes) The behavior of Modbus master and slave are shown in Fig. 4 and 5 respectively.
Fig. 6. Time diagram of Modbus Master/Slave communication.
Fig. 4. Master behavior of Modbus.
C. Ethernet & Modbus TCP Ethernet/IP uses a peer-to-peer and producer/consumer architecture for its data exchange versus a master/slave or command/response architecture. This allows for greater flexibility in the network and system designs, which fits better into the Ethernet networking model. In addition, Ethernet/IP splits its communication into configuration and management traffic (implicit messaging). Configuration and management traffic uses TCP/IP, and realtime I/O traffic uses UDP/IP. The producer/consumer model for Ethernet/IP allows multiple modes of communication to be chosen for realtime data exchange. The most common mode for producing data is called cyclic production. During cyclic production, the producer will send data at a particular rate called the Requested Packet Interval (RPI). The RPI and corresponding Accepted Packet Interval dictates the speed of the data ISSN: 1942-9703 / © 2009 IIJ
14
INTERNETWORKING INDONESIA JOURNAL
produced over the network regardless of the rate at which the actual data values change. Ethernet/IP also uses an object-oriented model. Some objects, such as the Identity object, TCP/IP object, and the Ethernet link object, are required by all Ethernet/IP devices. These map basic information about the device into the object model. Other objects are device specific, and while basic definitions of them may exist in the specification, the exact information recorded in the object is specific to the device and application [7][8]. A communicating system over Modbus TCP may include different types of device: • A Modbus TCP Client and Server devices connected to a TCP/IP network • The Interconnection devices like bridge, router or gateway for interconnection between the TCP/IP network and a serial line sub-network which permit connections of Modbus Serial line Client and Server end devices. The architecture of the Modbus TCP can be described as the Fig. 7. The response of Modbus TCP is non-deterministic with the best reaction time is 20 ms. To improve performance, realtime with RTPS (Realtime Publisher Subscriber) that utilizes UDP/IP but this is not really realtime standard. The available bandwidth for TCP/IP is 90%-100% [9].
Fig. 7. Modbus TCP communication architecture.
D. Programmable Logic Controller By definition, a Programmable Logic Controller (PLC) is a solid state control system that continuously monitors the status of devices connected as inputs. Based upon a user written program, stored in memory, it controls the status of devices connected as outputs. PLC that used in this research is PLC Twido. PLC Twido is a PLC that made by SchneiderTelemecanique and it is included into PLC nano category. PLC is able to make network, the typical architecture of the industrial network is shown in Fig. 8. Level 0 consists of sensors and actuators. Level 0.5 consists of smart devices which have capability to perform simple control actions. PLC and Human Machine Interface (HMI) are located in Level 1. Level 2 is called Host, it links industrial automation networks with the office automation networks.
JOELIANTO ET AL.
Fig. 8. PLC networking.
Level 1 in the Fig. 8 consists of PLC that can communicate with the highest level (Level 2) and the lowest level (Level 0). Hence communication is an important factor in the industrial automation implementation. PLC Twido supports communication in Modbus, ASCII and Remote Link. In this experiment the evaluated communication is Modbus, either TCP or serial RS485. E. Predictive P-Persistent CSMA Protocol MAC algorithm shown in Fig. 9 is used to control the access of a node to the shared media. To reduce the message delay, LonWork uses an enhanced algorithm which belongs to the family of Carrier Sense Multi Access (CSMA). It is a variant of p -persistent CSMA with the difference that the parameter p , the probability with which a message is transmitted when the channel is idle, varies according to the traffic condition. When the traffic is high, p is small. When the traffic is low, p rises. Such a strategy decreases the collision during heavy traffic and improves the utilization of the channel when the traffic is low. For such a protocol, a ready node, the one that has message to send, will sense the channel before transmission. If the channel is detected idle, with the probability p varies with the current backlog (i.e. the number of ready nodes), it will transmit the message. With the probability 1 − p , it will delay the transmission by one slot time. If at this new point, the channel is detected idle, it will repeat the same process. If the channel is sensed busy, this node will reschedule the transmission according to a random delay time [2]. The implementation of this algorithm in the MAC layer is shown in the Fig. 10. The probability p is given by
p = 1 /(16 BL) , where BL is the estimated number of ready nodes (1≤ BL ≤63). Then, the Random Delay Time (RDT) is calculated according to p and the RDT timer is started. If the
ISSN: 1942-9703 / © 2009 IIJ
Vol. 1/No. 1 (2009)
INTERNETWORKING INDONESIA JOURNAL
channel is always sensed idle during the period of this RDT. This node will start transmission when the RDT is expired. If before the end of the RDT, the channel is detected busy, the same process will be repeated. A ready node monitors the state of the channel and determines the channel to be idle if it senses no transmission during the β 1 period. Nodes without a ready message during this period will remain in synchronization for the duration of the followed random delay time. And if the message is ready after the end of β 1 period, it will be scheduled to transmit in one of the (0… 16 . slots during this random delay time.
BL -1)
15
carried out by the Open DeviceNet Vendor Association (ODVA) can be found in [12]. In order to eliminate the need for multiple devices to execute the test, it may be possible to construct a loop-back test. This loop-back test would connect an output on the device to an input, and then command the device to send an output and wait for the input to be measured by the device. While not all devices will have both inputs and outputs, many of the test equipment to one device, since the test equipment would only have to measure the time delay between networks packets. The loop-back test would be subject to many different types of errors and latencies. This test will be much more valuable to users than to developers, since it will not show the affects of the individual errors of latencies. The major sources of error and latency will probably be from the physical energy conversion creating an output signal and reading the input. These numbers are usually well known by the vendor and can be accounted for in the performance analysis. Another source of error and latency would be due to the processing overhead and network protocol stack. A time analysis of the action latency loop-back test procedure is shown in Fig. 11. and equations (1) as follows [10]:
Fig. 11. Time analysis for action loop-back test. Fig. 9. MAC algorithm.
TDUT_ALLB = 2×Tstack+2×TProc+2×TBus + TConOut+ TWire+ TConIn
β1
β2
(1) TALLB = 2×TNetwork+ TDUT_ALLB+ TTE
(2)
where: Fig. 10. Random delay time.
F. Performance Testing Methodology Latency is defined as the time interval between a message being sent to a device and a corresponding event occurring. Action Latency tests the ability for a device to either cause or measure a physical action and determine the time between the action and the associated network packet. If the device is being commanded to act, it is the time between the device receiving the network packet and the action happening. If the device is producing data, it is the time between the physical action and the device sending the network packet. These tests will be highly device specific, and require application level programming on the part of the tester. These tests will also be affected by multiple error sources, since the test equipment may consist of more than one device [10][11]. Latency approach to test the performance of Ethernet/IP devices
TDUT_ALLB
:
TBus
:
TConOut
:
TWire
:
TConIn
:
TALLB
:
TNetwork TTE TStack
: : :
ISSN: 1942-9703 / © 2009 IIJ
Latency Time for the Device Under Test for the Action latency Loop-Back Test Latency Time for the internal device bus, may be zero if device does not use a bus Latency Time to perform the output energy conversion Latency Time for the signal to travel along the wire Latency Time to perform the input energy conversion Latency Time for the Action Latency LoopBack Test Latency time due to network overhead Latency time due to the test equipment Latency time due to the DUT’s network protocol stack
INTERNETWORKING INDONESIA JOURNAL
16
JOELIANTO ET AL.
III. MEASUREMENT OF THE APPLICATION RESPONSE TIME A. Modbus Experiment Configuration on PLC Network Important requirements in realtime applications are the application response time and throughput. The application response time is the time measured from the moment, when the application calls the middleware to send a publication through the network layers, to the time, when the subscribed applications get this publication. The application response time can be affected by the network load, the network bandwidth, the implemented network stack, the processor speed, and in most case by the operating system. The experiment that has been done is an experiment to test the packet delay between the HMI through TCP/IP connection into PLC Twido. Another experiment tests packet delay between the HMI through TCP/IP connection into PLC Twido and then the data goes into another PLC through Modbus serial RS485. The second experiment uses two network topologies, i.e. star and ring topology. The 1st, 2nd, and 3rd experiment configurations are shown in the following figures. TCP/IP
PLC Twido 1
TCP/IP
Fig. 15. Counting algorithm.
PLC Twido 2
Fig. 12. 1st Experiment configuration.
TCP/IP
PLC Twido 1
TCP/IP
PLC Twido 2 RS 485 PLC Twido 3
Fig. 16. Block diagram of 2nd experiment algorithm (star topology).
Fig. 13. 2nd Experiment configuration.
TCP/IP
PLC Twido 1
TCP/IP
PLC Twido 2 RS 485
PLC Twido 4
PLC Twido 3 RS 485
Fig. 14. 3rd Experiment configuration.
From all of these experiments, it is calculated the time required by the transmitted packet sent from the HMI via PLC network and then returned to the HMI again. One packet contains 100 words of data. The experiment is carried out 50 times. The 2nd experiment can be said as a star topology and the 3rd experiment is a ring topology [13]. The algorithms of the developed ladder program in the experiments are shown in Figure 15, 16 and 17.
Fig. 17. Block diagram of 3rd experiment algorithm (ring topology).
ISSN: 1942-9703 / © 2009 IIJ
Vol. 1/No. 1 (2009)
INTERNETWORKING INDONESIA JOURNAL
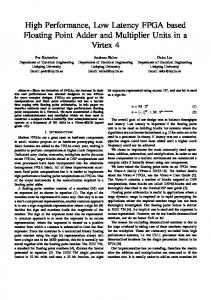
B. Results The response time of 1st experiment varies from 12 to 20 ms, the 2nd experiment varies from 98 to 106 ms and the 3rd experiment varies from 92 to 106. The mean time value of the 1st experiment is 17.75862 ms, the 2nd experiment is 101.667 ms and the 3rd experiment is 101.72 ms. The result of the experiments can be seen in the graphics shown below.
Time (ms)
1st Experiment (Ethernet Communication) 25 20 15 10 5 0 1
5
9
13 17 21 25 29 33 37 41 45 49 Data
Fig. 18. The result of 1st experiment.
Time (ms)
IV. ANALYSIS A. Topology, Network and Frame Analysis Network topology usually gives big different on the performance of a protocol. In these experiments, we only use 2 simple network topologies, i.e. star and ring. From the results of the experiment, it can be seen that there is no big different between the response time of the star topology and the ring topology. The mean of the star topology response time is 101.667 ms and the ring topology response is 101.72 ms. If the analysis is based on the network that is used, it gives very big different. Communication through Ethernet is faster than using serial RS485 because the communication that occurs in Ethernet is full-duplex while communication using serial RS485 is half-duplex. The mean of Ethernet communication response time is 17.75862 ms while the experiment that uses serial RS485 is 101.667 ms for star topology and 101.72 ms for ring topology. Although the experiments that use serial RS485 are also through the Ethernet communication but it still slower than the Ethernet communication only. B. Action Latency Analysis The experiment is tested under action latency methodology. According to Fig. 11, the experiments in Fig. 12-14 could also be described as that figure. The test equipment (TE) in this experiment is the PC and the Device Under Test (DUT) in this experiment is PLC. In connection with latency methodology, the experiments could be drawn as in Fig. 21, 22 and 23.
2nd Experiment (Star Topology) 110 105 100 95 90 85
TE 1
5
17
SWITCH
UDP1
SWITCH
UDP2
9 13 17 21 25 29 33 37 41 45 49 53 Data
Fig. 21. Action latency configuration of 1st experiment.
Fig. 19. The result of 2nd experiment.
TE
SWITCH
UDP1
SWITCH
UDP2
Time (ms)
3rd Experiment (Ring Topology)
UDP3
110 105 100 95 90 85
Fig. 22. Action latency configuration of 2nd experiment.
1
5
9 13 17 21 25 29 33 37 41 45 49 Data
TE
SWITCH
Fig. 20. The result of 3rd experiment.
UDP1
SWITCH
UDP4
UDP2
UDP3
Fig. 23. Action latency configuration of 3rd experiment.
ISSN: 1942-9703 / © 2009 IIJ
INTERNETWORKING INDONESIA JOURNAL
18
If the figures of action latency configuration for each experiment above are compared with the Figure 11, the response time result can be said as the result of TALLB for each experiment. The length of Ethernet cable from TE to switch and UDP to switch is about 5 meter and the length of serial RS485 cable from every UDP to UDP is about 3.6 meter. From this experiment can be said that cable length gives little effect to data communication. C. Delay Analysis According to the result of all the experiments, transmitting and receiving packets produce delay time. There is uncertainty in the delay time, as there is fluctuation in the measured time. This happens because of message delay phenomenon that usually occurs in the network communication. There are mainly three factors that contribute to the message delay. 1. Waiting delay: the delay between the time when the message arrives and the time when the channel is successfully caught by the message. 2. Transmission delay: the delay between the times that the first and last bits of the message are transmitted. 3. Propagation delay: the delay between the time that the last bit is transmitted at the source node and the time that it is received by the destination node. In addition, when a message enters the OSI model, it passes through it with different processes by different layers. These processes produce delay. However, when it is compared with above delays, it is negligible [2] and it will not be considered here. V. CONCLUSION The paper has shown the loop-back action latency performance comparison of Modbus in PLC network by using Ethernet, serial RS485 and also using two different topologies, ring and star topology. From the experiment and the analysis that have been discussed in the paper, it can be summarized as follow: • Communication through Ethernet is faster than through serial RS485 in PLC Twido Network • Different topologies give little effect on the performance of Modbus in PLC Twido • The cable length also gives little effect on the performance of Modbus in PLC Twido Further research direction is as suggested in [14]. • The three factors that contribute to the message delay need to be tested in order to find out the value of those delays. • For RS485 networks, efforts should focus on reducing delay. • For Ethernet networks, research needs to address the throughput limitations and fairness problems, while preserving the small delays.
JOELIANTO ET AL.
REFERENCES [1]
[2]
[3]
[4] [5] [6] [7]
[8] [9] [10] [11] [12] [13]
[14]
J. Hops, B. Swing, B. Phelps, B. Sudweeks, J. Pane, and J. Kinslow, “Non-deterministic DUT behavior during functional testing of high speed serial busses: Challenges and Solutions,” in 2004 Proc. International Test Conference. X. Chen, and G. S. Hong, “Real-time performance analysis of a fieldbusbased network,” in 2002 Proc. Information Decision and Control (IDC), Adelaide, Australia. Optimizing Ethernet Network, Schneider Automation Network Certification Services Team, North Andover, MA, USA, 2001. Available: http://www.us.telemecanique.com. “Modbus sails along on powered by ethernet,” The Industrial Ethernet Book, 28, pp. 38-39, Sept. 2005. MODBUS Application Protocol Specification, May 2002. http://www.MODBUS.org. MODBUS over Serial Line Specification and Implementation Guide, Feb. 2002. Available: http://www.MODBUS.org. O. Dolejs, P. Smolik, and Z. Hanzalek, “On ethernet use for real-time publish-subscribe based applications,” IEEE, 2004. Available: http://dce.fdk.cvut.cz/hanzalek/publications/Hanzalek04.pdf. W. Stallings, Data and Computer Communication, 6th ed., Prentice Hall, 2000. L. Larsson, “Fourteen industrial ethernet solutions under spotlight,” The Industrial Ethernet Book, 28, pp. 16-23, Sept. 2005. J. D. Gilsinn, “Industrial ethernet takes the test,” ISA-InTech, Sept. 2005. Available: http://www.isa.org/InTechTemplate.cfm. J. D. Gilsinn, “Real time I/O performance metrics and tests for industrial ethernet,” ISA Automation West, 2004. Available: http://www/isa.org. “Performance Test Methodology for EtherNet/IP Devices version 1.0,” EtherNet/IP Implementors Worskshop, ODVA, 2005. Y. Song, A. Koubaa, and F. Simonot, “Switched ethernet for realtime industrial communication: modelling and message buffering delay evaluation,” in 2002 Proc. 4th IEEE WFCS, Vasteras, Sweden. H. S. Yang, M. Reisslein, M. Herzog, M. Maeir, and. Wolisz, Metro WDM networks: comparison of ring and star topologies. Available: http:// www.tkn.tu-berlin.de/publications/papers/gc5.pdf.
Endra Joelianto (M’01) received the B.Eng. degree in Engineering Physics from Bandung Institute of Technology, Indonesia in 1990, and Ph.D. degree in Engineering from The Australian National University (ANU), Australia in 2002. He was a Research Assistant with Instrumentation and Control Laboratory, the Department of Engineering Physics, Bandung Institute Technology, Indonesia from 1990-1995. Since 1999, he has been with the Department of Engineering Physics, Bandung Institute of Technology, Bandung, Indonesia, where he is currently an Assistant Professor. His research interest includes hybrid control systems, discrete event systems, artificial intelligence, robust control and intelligent automation. He has edited one book on intelligent unmanned systems published by Springer-Verlag, 2009 and published more than 50 research papers. Dr. Joelianto currently is an Editor of the International Journal of Artificial Intelligence (IJAI). He is the Chairman of Society of Automation, Control & Instrumentation, Indonesia. Hosana was born in Jakarta, Indonesia on January 12th, 1983. He received the B.Eng. degree in Engineering Physics from Bandung Institute of Technology, Indonesia in 2005. After graduated, he worked as a Research Assistant with Programmable Logic Controller-Research Group (PLC-RG), Bandung, Indonesia in the areas of instrumentation and control such as PLC, HMI, DCS, etc. From 20062007, he worked at PT. Wifgasindo Dinamika Instrument Engineer, Indonesia as a system integrator and EPC (Engineering, Procurement and Construction) company. At PT. Wifgasindo, he developed a system for ConocoPhillipsIndonesia called Puyuh Load Shedding System. This system was design to avoid blackout that could happen in power systems. Since June 2007, he has been with PT. Scada Prima Cipta also as a system integrator and EPC company. He is responsible in designing and developing new systems in instrumentation and control.
ISSN: 1942-9703 / © 2009 IIJ