existing lossless image set compression algorithm, the results are signif- icantly better than .... Image 1st order 2nd order 4th order (JPEG2000). I1. 5.33. 4.47. 3.51 .... Gonzalez, R.C., Woods, R.E.: Digital Image Processing. Prentice Hall, 3rd ...
Lossless Compression of Satellite Image Sets Using Spatial Area Overlap Compensation⋆ Vivek Trivedi and Howard Cheng Department of Mathematics and Computer Science University of Lethbridge Lethbridge, Alberta, Canada {vivek.trivedi, howard.cheng}@uleth.ca
Abstract. In this paper we present a new prediction technique to compress a pair of satellite images that have significant overlap in the underlying spatial areas. When this prediction technique is combined with an existing lossless image set compression algorithm, the results are significantly better than those obtained by compressing each image individually. Even when there are significant differences between the two images due to factors such as seasonal and atmospheric variations, the new prediction technique still performs very well to achieve significant reduction in storage requirements.
1
Introduction
In this paper, we examine the problem of lossless compression of large sets of satellite images. More specifically, we design an algorithm for the lossless compression of a set of satellite images. These sets consist of many images of similar geographical locations taken at different times as the satellite orbits the Earth. Despite some differences in climate conditions, we expect a high amount of redundancy among these satellite images that represent the same geographic location. The storage of large image collections has traditionally been treated in a straightforward manner by applying well-known compression algorithms to individual images (see, for example, [13]). When the images in the collection are related, there are opportunities to reduce the storage requirements further. There are general-purpose image set compression algorithms for images that are related even though the relationship is not known a priori, including the centroid method and MST-based methods [4–6, 8, 9]. An important component in these algorithms is a compensation algorithm that predicts a target image to be compressed, given a reference image that has already been coded. We propose a new compensation algorithm that takes advantage of the properties of our image sets to reduce redundancies among images. Examples of such compensation in other applications include motion compensation for video compression [13], ⋆
This research was supported by a MITACS Accelerate Internship with Iunctus Geomatics Corp. (VT) and an NSERC Discovery Grant (HC).
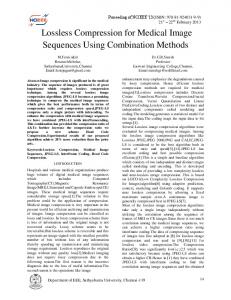
as well as compensation for the compression of stereo images [12], multiview videos [10], and object movies [2]. The new compensation algorithm is based on metadata associated with each image that specifies its spatial location. Since the orbiting path of the satellite is not the same each time it passes through the same area, it is very rare that two images represent exactly the same areas. In order to compress the target image given the reference image, the overlapped area is first determined. It is shown in this paper that simple subtraction of each target pixel in the overlapped area by the corresponding pixel in the reference image is insufficient due to factors such as varying seasons (e.g. snow cover) and changes in atmospheric conditions (e.g. amount of aerosol or humidity in the air). These issues are dealt with by an intensity map computed from the target and the reference images. Through experiments on real image sets, we show that the new compensation algorithm combined with well-known image compression algorithms is significantly better than compressing each image individually. Although the techniques proposed here can be applied to other satellite image sets with similar properties, we mainly worked on images which are acquired in a single panchromatic band by the SPOT5 satellite [3]. These images are taken in a cloud-free environment and each pixel represents a 10m × 10m area of the surface of the Earth. These images are orthoractified to remove distortions due to the tilt and elevation angles from nadir in the satellite camera sensors. Sample images used for the experiments are shown in Fig. 1. The images are chosen so that there is complete overlap in the area imaged to demonstrate the effectiveness of the proposed compensation algorithm. However, complete overlap is not required for our algorithm.
(a) I1
(b) I2
(e) I5
(c) I3
(f) I6
(d) I4
(g) I7
Fig. 1. Images used in the experiments.
2
Image Set Compression Methods
Data compression is typically achieved by removing redundancy in the given data. For lossless compression of individual images, typical algorithms attempt to remove two types of redundancy—interpixel redundancy and coding redundancy [7]. These redundancies are reduced by a mapper (e.g. wavelet transform) and an entropy coder (e.g. arithmetic coding). For sets of similar images, there is an additional type of redundancy that exists among the images. A set mapper is first applied to reduce this interimage redundancy [8, 9]. The output of the set mapper is a set of images that can be processed by ordinary image compression algorithms to reduce the remaining interpixel redundancy and coding redundancy. The centroid method of Karadimitriou and Tyler [8, 9] first computes a centroid image in the set, which is simply the pixelwise average of all images in the set. The set mapper then predicts each image in the set by subtracting the centroid image. If all images are very similar, the difference images contain mostly zeros and can be compressed very efficiently. For our application, however, this method can only work well if every image represents exactly the same geographic location with no displacements. This almost never occurs in the image set, even if we apply a clustering algorithm to group images of similar locations together. A different approach to the set mapping problem is based on minimum spanning trees [4–6]. In this approach, each image (as well as a “zero” root image) is represented as a vertex in a graph. Between every pair of vertices u and v, there is an edge whose weight represents the cost to encode image v when u is known (or vice versa). To compress the entire image set, a minimum spanning tree (MST) is computed from this graph. The zero root image is used as the first reference image. The algorithm repeatedly chooses a target image that is connected to another reference image that has already been coded in the MST. This is done until all images have been compressed. Decompression of the image proceeds from the root, and decompress the images in the same order. When images in the set are not all very similar but there is significant similarity between pairs of images, it has been shown that MST-based set compression algorithms perform very well [4, 6]. Thus, MST-based algorithms are more suitable in our application. Regardless of which of the above set mapping methods is chosen, a key component is the compensation of a target image given a reference image. While simple image subtraction is used in the previous works, it does not work well with the image sets in our application.
3
Spatial Area Overlap Compensation
In order to compute the overlap in the geographical area represented by a pair of images, we make use of location metadata that are typically recorded with satellite images. In our application, the geographical location of the rectangular area of the surface of the Earth corresponding to each image is extracted from the
metadata and specified in the Universal Transverse Mercator (UTM) coordinate system. Other geographic coordinate system can be also used. The spatial area overlap between the target image and the reference image is computed by applying a standard polygon intersection algorithm [11]. Since the overlapped area represents the same geographic area, a high level of interimage redundancy between the corresponding pixels is expected. As in many image compression algorithms, we attempt to remove this inter-image redundancy through the technique of prediction. Let T be the target image to be encoded, and R be the reference image. We denote by T (i, j) the pixel of T at image coordinates (i, j), and likewise for R(i, j). We now describe how to form the prediction error image E (whose dimensions are the same as those of T ) using spatial area overlap compensation. For each pixel T (i, j) in the overlapped area in the target image T , the corresponding image coordinates (i′ , j ′ ) in R representing the same spatial location is computed. The coordinates (i′ , j ′ ) are used to determine a predicted pixel value Tˆ(i, j) for T (i, j). Since i′ and j ′ are often not integers, interpolation is needed to obtain a value for Tˆ(i, j). In order to minimize computation, we use nearest neighbour interpolation. That is, Tˆ(i, j) = R(round(i′ ), round(j ′ )).
(1)
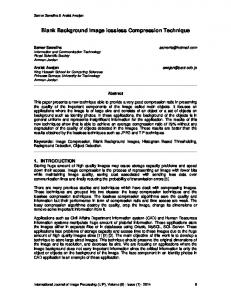
Our images have relatively high resolution, and more computationally intensive interpolation schemes such as bilinear or bicubic interpolation does not result in significant improvements in the accuracy of the prediction. If (i, j) is not in the overlapped area in T , we simply set Tˆ(i, j) = 0. The prediction error image E is simply formed by E(i, j) = T (i, j) − Tˆ(i, j). (2) It is clear that if the reference image R and the prediction error image E are available, then the target image T can be recovered provided that the geographic coordinates of T and R are known. The computation of the prediction error image is illustrated in Fig. 2. It can be seen that the major geographic features such as the rivers and streams in the target image is much less prominent in the prediction error image. As expected, the differences in atmospheric conditions near the top of the main river on the left are captured in the prediction error image. It can also be seen from Fig. 2 that prediction error image obtained still contains significant interpixel redundancy among the coded overlapped area, so that an image compression algorithm is still needed to encode the prediction error image. Also in the case of partial overlap, the uncompensated area (the area outside of the spatially overlap) has significant amount of interpixel redundancy as in the original image. This interpixel redundancy can be quantified by examining the entropy [7]. In Table 1, we show the first, second, and fourth order entropy of image I1 together with the entropy of the prediction error resulting from using different reference images. The difference between first and fourth order entropy can be considered as a measure of the amount of interpixel redundancy that exists in
(a) Target image
(b) Reference image
(c) Prediction error image Fig. 2. Illustration of spatial area overlap compensation.
the image. Also included is the space reduction obtained by the JPEG 2000 compression algorithm [1] (in lossless mode) on the original target image and the prediction error images compared to storing the target image uncompressed. We see that a reduction in entropy is often obtained using spatial area overlap compensation, although only a minor improvement is obtained in actual compression performance in some cases. There is no significant improvement using spatial area overlap compensation using (1) to predict the target image. Despite the fact that the images have significant overlap, the overlapped area are not similar enough for simple subtraction to work well. On closer examination, this is often due to seasonal variations (e.g. snow cover) or atmospheric conditions (such as humidity and pollution) observed between images taken at different times of the year. For example, I1 and I5 in Fig. 1 shows two images representing the same area but they appear very different due to seasonal variations. These results show that a different prediction method is needed.
4
Intensity Mapping
Seasonal variations can significantly impact the intensity of reflected light recorded by the satellite camera sensors. For example, grass may reflect considerable less light in the summer than in the winter when it is covered by snow. Crops in the
Table 1. Experiments on a sample target image and the entropy of prediction error from different reference images. Entropy (bits/pixel) Space Reduction Image 1st order 2nd order 4th order (JPEG2000) I1 5.33 4.47 3.51 60.6% I1 − I2 3.74 3.58 3.28 59.0% I1 − I3 4.03 3.79 3.36 61.5% I1 − I4 6.04 4.95 3.68 61.8% I1 − I5 6.09 5.16 3.76 56.0% I1 − I6 4.03 3.79 3.36 56.2% I1 − I7 5.15 4.49 3.60 57.4%
summer may be harvested in a different season. Even if an image of the same location is taken at different times in the same season, the pixel intensities may be different because of variations in atmospheric conditions. Despite seasonal and atmospheric variations that exist among images in the set, it was observed that pixels of the same “type” in the reference image are often changed in similar ways in the target image. By the type of a pixel we mean the type of surface the pixel corresponds to. At the same time, different types of pixels are changed by different amounts. For example, in Fig. 1 we see that the pixels belonging to a crop field in I1 are changed in I5 because they have been harvested. One can attempt to use region-based techniques to analyze different regions of pixels and compensate appropriately. However, such an approach may be computationally intensive, and side information on the locations and shapes of regions must also be stored. We propose a new simple prediction method called intensity mapping to take advantage of this property and overcome issues arising from variations in seasonal and atmospheric conditions. For each pixel intensity in the overlapped area of the target image, we use (1) to determine the corresponding pixel intensity in the reference image. All such pairs of reference and target intensities are collected. Let S = {(Tˆ(i, j), T (i, j)) | (i, j) in the overlapped area in T } (3) be the multiset of such pairs with duplicates included. Then, for a pixel T (i, j) in the overlapped area of the target image, we define the intensity mapped predictor � � T¯(i, j) = round median{t | (Tˆ(i, j), t) ∈ S} . (4) In other words, T¯(i, j) is simply the median of all target intensities associated with the reference intensity Tˆ(i, j) in S. An intensity map consisting of the set {(Tˆ(i, j), T¯(i, j)) | (i, j) in the overlapped area in T }
(5)
(with all duplicates removed) must also be stored so that the decompression algorithm has access to the same prediction when reconstructing the target image
from reference image and the prediction error. The storage requirement for the intensity map is negligible in relation to the prediction error image. Median is chosen over mean for intensity mapping because it is less affected by outliers. Since intensity mapping is only a rough approximation of how different types of pixels are changed from one image to another, outliers often exist and can affect the mean significantly, leading to a larger prediction error for more pixels. Intensity mapped prediction is illustrated in Table 2. In this table, we show the various target pixel intensities associated with a particular reference intensity, as well as the effect of intensity mapping on the prediction error. Although the use of intensity mapped prediction does not change the statistical properties (e.g. entropy, range, etc.) of the target intensities corresponding to a specific reference intensity, the prediction errors over the entire image is reduced. An improvement in the overall prediction error image is achieved because intensity mapped prediction effectively allows a different adjustment in the predicted value based on the type of pixels being coded. Table 2. Example of intensity mapped (IM) prediction. Reference Target Median Error (no IM) Error (with IM) 70 97, 99, 100, 102, 102 27, 29, 30, 32, -5, -3, -2, 0, 102, 104, 105 32, 34, 35 0, 2, 3 100 120, 121, 121, 122, 122 20, 21, 21, 22, -2, -1, -1, 0, 124, 125, 125 24, 25, 25 2, 3, 3 220 180, 182, 182, 183, 183 -40, -38, -38, -37, -3, -1, -1, 0, 1, 1, 2 184, 184, 185 -36, -36, -35 1, 1, 2
Table 3 shows the experimental results using intensity mapped prediction. As expected, the fourth order entropy of the prediction error image is significantly reduced in most cases. This is also often seen in actual space reduction achieved by lossless JPEG 2000. In fact intensity mapped prediction performs better in all but one case. Even for I1 and I2 which are quite similar visually, intensity mapped prediction gives very good results. A slight disadvantage for intensity mapped prediction is that two passes are needed to construct the intensity map and to compute the prediction error. Figure 3 shows the prediction error image of I1 . It is visually clear that intensity mapping significantly reduces high frequency details in the error image. For example, the zig-zag patterns in the terrain, the thin lines in harvested fields, and the bright strips of dirt road are apparent in the prediction error image without intensity mapping. On the other hand, the same features are drastically reduced when intensity mapping is used. This can also be verified by examining the histograms of the pixel intensities in the error images. We see in Fig. 4 that the histogram of the prediction errors is much more skewed when intensity mapped prediction is used, so that the resulting error image is easier to compress.
Table 3. Experiments on intensity mapped (IM) prediction.
Image I1 − I2 I1 − I3 I1 − I4 I1 − I5 I1 − I6 I1 − I7
4th Order Entropy (bits/pixel) no IM IM 3.28 1.03 3.36 1.90 3.68 3.41 3.76 2.53 3.36 3.10 3.60 2.52
(a) Error image (no IM)
Space Reduction (JPEG 2000) no IM IM 59.0% 83.8% 61.5% 77.3% 61.8% 48.5% 56.0% 57.4% 56.2% 56.4% 57.4% 65.7%
(b) Error image (IM)
Fig. 3. Effect of intensity mapping on prediction error image I1 − I2 .
(a) No IM
(b) IM
Fig. 4. Histogram of intensities in prediction error images.
Spatial area overlap compensation along with intensity mapping can be used in MST-based set compression algorithms [4–6] to obtain edge weights and to compress chosen edges in the MST. As an example, we may construct a directed graph where the weight of each edge is the compressed size of the corresponding prediction error image after compensation. Figure 5 depicts the computed directed MST of the image set in Fig. 1 where node I0 represents a zero “root” image that acts the reference image for encoding image I7 . Using the given MST and spatial area overlap compensation with intensity mapped prediction, we obtain a further reduction of 23.9% compared to compressing each image individually (81182 bytes vs. 106663 bytes). �� I0
�� 14769
�� ? I7
�� H � H 12373 �� 14003 H 15268 HH � �� ? �� �� j � � I6
I2
�� �� �� �
J 6475 12456 5838 J
��� �� J ^ �� ��
� I4
I3
I5
I1
�� �� ��
Fig. 5. Directed minimum spanning tree of the example image set.
5
Conclusions and Future Works
We described a compensation algorithm for images with significant spatial area overlap taking into account of variations in seasonal and atmospheric conditions. We have shown that when combined with MST-based set compression algorithms, the storage requirement is reduced compared to compressing each image individually. The proposed algorithm generates the prediction error image in two passes. During first pass it constructs the intensity map by scanning the images and in the second pass it uses the intensity map to compute the prediction error from the target image. To improve efficiency we are examining an adaptive method to update the intensity map as it encodes the target image in one pass. The use of this method will also eliminate the necessity of storing the intensity map separately for decoding.
The method of intensity mapped spatial area overlap compensation can also be extended for satellite images of different scales. An image of a particular scale can be predicted from images of other scales. For example, we can predict 10meter images using 5-meter images that have similar spatial coordinates. There are also possibilities of predicting an image from multiple images of the same area, especially if an image overlaps with multiple images in different parts. These possibilities will be examined in the near future.
6
Acknowledgments
The authors would like to thank Iunctus Geomatics Corp. for providing the satellite images for our experiments.
References 1. Adams, M.: JasPer project. http://www.ece.uvic.ca/ mdadams/jasper/ 2. Chen, C.P., Chen, C.S., Chung, K.L., Lu, H.I., Tang, G.: Image set compression through minimal-cost prediction structures. In: Proceedings of the IEEE International Conference on Image Processing. pp. 1289–1292 (2004) 3. Corporation, S.I.: SPOT-5 satellite imagery and satellite system specifications. http://www.satimagingcorp.com/satellite-sensors/spot-5.html 4. Gergel, B.: Automatic Compression for Image Sets Using a Graph Theoretical Framework. Master’s thesis, University of Lethbridge (2007) 5. Gergel, B., Cheng, H., Li, X.: A unified framework for lossless image set compression. In: Data Compression Conference. p. 448 (2006) 6. Gergel, B., Cheng, H., Nielsen, C., Li, X.: A unified framework for image set compression. In: Arabnia, H. (ed.) Proceedings of the 2006 International Conference on Image Processing, Computer Vision, & Pattern Recognition (IPCV’06). vol. II, pp. 417–423 (2006) 7. Gonzalez, R.C., Woods, R.E.: Digital Image Processing. Prentice Hall, 3rd edn. (2008) 8. Karadimitriou, K.: Set redundancy, the enhanced compression model, and methods for compressing sets of similar images. Ph.D. thesis, Louisiana State University (1996) 9. Karadimitriou, K., Tyler, J.M.: The centroid method for compressing sets of similar images. Pattern Recognition Letters 19(7), 585–593 (1998) 10. Merkle, P., M¨ uller, K., Smolic, A., Wiegand, T.: Efficient compression of multiview video exploiting inter-view dependencies based on H.264/MPEG4-AVC. In: IEEE Intl. Conf. on Multimedia and Expo (ICME’06). pp. 1717–1720 (2006) 11. O’Rourke, J.: Computational Geometry in C. Cambridge University Press, 2nd edn. (1998) 12. Perkins, M.G.: Data compression of stereopairs. IEEE Trans. on Communications 40(4), 684–696 (1992) 13. Shi, Y.Q., Sun, H.: Image and Video Compression for Multimedia Engineering: Fundamentals, Algorithms, and Standards. CRC Press, 2nd edn. (2008)