Low and Intermediate Temperature Properties of Asphalt Mixtures using Vacuum Tower Bottoms modified with Bioderived Rejuvenators Joseph H. Podolsky1, Ashley Buss2, Nacu Hernandez3, R. Christopher Williams4, and Eric W. Cochran5 1
Iowa State University, Department of Civil, Construction, and Environmental Engineering, 174 Town Engineering, Ames, Iowa, 50011, United States,
[email protected] 2 Iowa State University, Department of Civil, Construction, and Environmental Engineering, 403 Town Engineering, Ames, Iowa, 50011, United States,
[email protected] 3 Iowa State University, Department of Chemical, and Biological Engineering, 3125 Sweeny Hall, Ames, Iowa, 50011, United States,
[email protected] 4 Iowa State University, Department of Civil, Construction, and Environmental Engineering, 490 Town Engineering, Ames, Iowa, 50011, United States,
[email protected] 5 Iowa State University, Department of Chemical, and Biological Engineering, 1035 Sweeney, Ames, Iowa, 50011, United States,
[email protected]
Abstract Vacuum tower distillation bottom (VTB), is an asphalt material produced through vacuum tower distillation processing in petroleum refineries to increase production of higher economic value lighter components such as gasoline and jet fuel. Due to the loss of saturates from this process, VTB are very stiff and are heavily limited for use in paving. In past binder studies done at Iowa State University, linseed oil based bio-derived materials (BDM) have been shown to improve the low temperature performance of the stiff VTB, as compared to softer paving grade asphalts through rejuvenation. Mix performance must also be examined based on past results. Mix performance of VTB modified with BDM used as rejuvenators (two dosage levels) at low and intermediate temperatures was examined and compared against the performance of a control, and VTB modified with a commercially available rejuvenator (two dosage levels) using the semi-circular bend (SCB) test and the dynamic modulus test at low and intermediate temperatures. Findings show that heat bodied linseed oil (HBO) and partially hydrogenated heat bodied linseed oil (PHBO) combined make for a successful rejuvenator of VTB. 5%HBO and 5%PHBO combined perform equally and better than the commercial rejuvenator and better than the control by lowering stiffness and increasing fracture energy at low temperature, while performing the same at intermediate temperatures. Keywords: vacuum tower distillation bottoms, linseed oil, rejuvenation, stiffness, fracture energy. 1. Introduction Different fractions used for producing many products are created through the distillation of oil during the refining process. One of the heaviest fractions produced during refining of petroleum crude is asphalt binder. Lighter petroleum crude fractions are used for manufacturing higher economic value products such as gasoline and specialty chemicals. When the price of oil increases, lighter component products such as gasoline increase in price, thus incentivizing the increased production of said lighter components during petroleum crude refining. To increase production of 1
higher economic value lighter components, refineries equipped with vacuum tower equipment run vacuum distillation to extract more from crude oil. From this process vacuum tower distillation bottoms (VTB) are produced. VTB is very stiff due to the loss of saturates from the vacuum tower distillation process to produce more lighter components, and thus is not typically used wholly for paving a roadway as an asphalt binder and can be terminally blended for producing the appropriate asphalt binder grade. Several studies have been published investigating the use of rejuvenators with laboratory-aged asphalt binder, recovered binder from recycled asphalt pavement (RAP) and by applying rejuvenators on high-RAP mixtures. Rejuvenators act to restore an aged asphalt binder’s rheological properties. Asphalt binder restoration is the process in which volatiles and oils are renewed while still keeping the adhesion properties stable. The intent is for a rejuvenator to return the ratio of asphaltenes/maltenes in an aged asphalt binder to its original state [1-7]. Currently the increased use of RAP in hot mix asphalt (HMA) mixtures has caused use of rejuvenators to increase [8]. Literature shows that as the dosage of rejuvenators in RAP extracted and recovered binder increase both high and low performance grade (PG) temperatures decrease linearly [8-12]. However, this decrease assists in restoring the RAP extracted and recovered binder PG grade to virgin un-aged PG grade or better [12]. Due the restorative properties of rejuvenators to RAP and RAP extracted and recovered binder, evaluation of waste products such as recycled motor oil (RO) for use as a rejuvenator has been done in research. This use of RO in RAP and RAP extracted and recovered binder has been shown to lower permanent deformation over time as well as decrease mixing and compaction temperatures [6]. If RO can be successfully used as a rejuvenator of RAP binders, then the same idea could work with vacuum tower bottoms (VTB) through the use of bio-derived materials (BDM). In past studies done at Iowa State University, bio-derived materials (BDM) from linseed oil have been shown to be a softer material that can add value to very stiff VTB. The objective of this study is to examine mix performance of VTB modified with BDM from linseed oil used as rejuvenators at low and intermediate temperatures and compare the performance against that of a control, and VTB modified with a commercially available rejuvenator. Testing methods used will be the semicircular bend (SCB) test and the dynamic modulus test at low and intermediate temperatures. 2. Experimental Materials & Methods 2.1. Materials
Vacuum tower bottoms are a very stiff form of asphalt binder that usually grade out at performance grades (PG) 76-10, 82-10, or 82-16. For this research work one source of vacuum tower bottoms from an Illinois refinery with a penetration grade of 20-30 and a performance grade (PG) of PG 76-10 was used. Two bio-derived materials from linseed oil were used in this research work – Heat Bodied Linseed Oil (HBO), and Partially Hydrogenated Heat Bodied Linseed Oil (PHBO) for the creation of two groups, while a bio-derived commercial modifier (CM) currently in the market was used in the creation of two more groups for comparison purposes. The properties for HBO and PHBO are shown in Table 1. 2
Table 1. Properties of BDMs HBO and PHBO Physical Form Specific Gravity at 25°C (77°F)
HBO Amber liquid 1.02
PHBO Solid paste 1.05
Molecular Weight (Mn) [Da] Tg [°C]a
3,400
3,400
-17.91
-24.89, 16.25
Melting Temp. [°C]
-
42.92
Viscosity @ 25°C (77°F) (Pa·s)b Viscosity @ 55°C (131°F) (Pa·s)b
3.56
42.46
0.82
0.86
a Glass Transition Temperature (Tg) was measured using a TA Q2000 Differential Scanning Calorimeter equipped with a refrigerated cooling system (ECS90). The heating rate used was 10°C/min from -60°C to 100°C. b Viscosity measured at a shear rate of 100 (1/s).
The amount of rejuvenator was determined through an extensive dosage study using the HBO and PHBO materials with the same source VTB material in past work. Looking at the critical high and low temperatures it is seen that the rejuvenator combination of HBO and PHBO perform similarly to the commercial rejuvenator CM at similar dosages as shown in Table 2. Table 2. Performance grades (PG) of control and rejuvenator groups Group Name Control 3% HBO + 3% PHBO 5% HBO + 5% PHBO 6% CM 10% CM
Critical High Temp (°C) 80.5 72.8 68.4 69.86 63.03
Critical Low Temp (°C) -14.05 -22 -25.97 -22.66 -26.46
PG Grade 76-10 70-16 64-22 64-22 58-22
A surface mix with a 10 million ESAL design level from the Iowa Department of Transportation (DOT) was used to construct bulk specific gravity specimens (height – 115 mm, diameter – 150 mm) and dynamic modulus specimens (height – 150 mm, diameter – 100 mm) with air voids at 7% ± 0.5% for five groups (includes the control VTB). The blended aggregate gradation and source information used for this mix design are shown in Table 3. Mix specimens were mixed and compacted at 155°C after two hours of curing for a fixed mass to achieve 7% ± 0.5% air voids; bulk specific gravity specimens (height – 115 mm, diameter – 150 mm) and dynamic modulus specimens (height – 150 mm, diameter – 100 mm) using a Superpave gyratory compacter (SGC) according to AASHTO T 312 and air voids were measured according to AASHTO T 166 [13, 14]. Six semi-circular bend (SCB) test specimens were produced from each Gmb specimen with approximate dimensions of 25 ± 2mm in thickness, and 150 ± 9mm in diameter and notch length of 15 ± 0.5 mm with the notch width being no wider than 1.5 mm. Each SCB specimen underwent preconditioning for two hours at -12°C in the environmental chamber before testing.
3
Table 3. Mix Design Gradation and Supplier Information Source
Aggregate U.S. Sieve 3/4" 1/2" 3/8" #4 #8 #16 #30 #50 #100 #200
Sieve, mm 19.0 12.5 9.5 4.75 2.36 1.18 0.60 0.30 0.15 0.075
Martin Marietta (Ames)
Martin Marietta (Ames)
12.5 mm Limestone 29% % Passing 100.0 79.7 65.8 37.2 18.1 12.5 9.5 7.5 6.2 5.2
9.5 mm Limestone 16% % Passing 100.0 100.0 90.1 20.5 2.1 0.7 0.4 0.3 0.3 0.3
Oldcastle Materials Group (Johnston) Quartzite 15% % Passing 100.0 100.0 71.5 5.1 2.2 2.0 1.9 1.9 1.5 1.2
Hallet (Ames)
Martin Marietta (Ames)
Natural Sand 13% % Passing 100.0 100.0 100.0 96.8 64.2 33.7 11.4 0.9 0.1 0.0
Manuf. Sand 15% % Passing 100.0 100.0 100.0 95.2 65.5 36.3 17.4 6.5 1.9 0.8
Martin Marietta (Ames)
Blend
Agg Lime 12% % Passing 100.0 100.0 100.0 99 97 75 53 38 29 22.3
100% % Passing 100.0 94.1 84.2 53.6 35.7 22.9 13.6 8.2 5.8 4.5
2.2. Mixture Testing Methods 2.2.1. Dynamic Modulus Test
The dynamic modulus test is a linear viscoelastic test used on asphalt mix specimens where the complex dynamic modulus │E*│ is estimated by relating stress to strain at several temperatures with each temperature at several different frequencies. The complex dynamic modulus │E*│ is a very important property because it is used to represent a pavement’s stiffness response under repeated traffic loading (several frequencies) [15]. Asphalt mix stiffness is very temperature dependent when loaded. At high temperatures, stiffer mixtures are less prone to permanent deformation, but at low temperature are more prone to cracking [15]. │E*│ varies with both temperature and load frequency. This means that trying to compare results gained from testing at one temperature to results from another temperature is very difficult. To be able to make comparison between results from different test temperatures dynamic modulus master curves can be developed. They provide a direct means of viewing all the results gained from multiple test temperatures and frequencies in one visual representation [16]. According to research conducted by Li and Williams [17], three test temperatures (4.4, 21.1, and 37.8ºC) could be used instead of five because the results did not change the shape of final master curve developed. This was determined due to there being data from nine frequencies ranging from 25 Hz to 0.1 Hz instead of data from six frequencies ranging from 25 Hz to 0.1 Hz. For this research work │E*│ master curves will be fitted using the sigmoidal function [18]. The number of specimens tested for each group was set at three. The mathematical expression of the sigmoidal function is shown in equations 1 through 3 [18]: 𝛼𝛼 𝑙𝑙𝑙𝑙𝑙𝑙|𝐸𝐸 ∗ | = 𝛿𝛿 + (1) 𝛽𝛽+𝛾𝛾(𝑙𝑙𝑙𝑙𝑙𝑙𝑡𝑡𝑟𝑟 ) where,
𝑎𝑎(𝑇𝑇) =
1+𝑒𝑒
𝑡𝑡
𝑡𝑡𝑟𝑟
log(𝑎𝑎(𝑇𝑇𝑖𝑖 )) = 𝑎𝑎𝑇𝑇𝑖𝑖2 + 𝑏𝑏𝑇𝑇𝑖𝑖 + 𝑐𝑐 4
(2) (3)
tr = Reduced time of loading at reference temperature (s); δ, α, β, γ = Coefficients; a(T) = Shift factor as a function of temperature; t = Time of loading (s); T = Temperature (°C); a(Ti) = Shift factor as a function of Temperature Ti; a, b, c = Coefficients for shift factor. The time-temperature superposition principle must be used to construct a complex dynamic modulus master curve using data gained from testing at several frequencies within several test temperatures through equations 1 through 3. 2.2.2. Semi-circular Bend Test
The semi-circular bend (SCB) test is a HMA fracture test used at low temperatures. Recently the SCB test has become more well known among researchers because specimen fabrication is simple and easily reproducible using both standard laboratory compacted or field cored asphalt concrete samples [19-21]. Within this test two fracture modes can be studied – mode I or mode II. The fracture mode depends on initial notch orientation. Within this research work, mode I fracture will be used for specimen preparation, testing and analysis. Fracture energy (Gf), fracture toughness (KIC), and stiffness (S) are the parameters determined using the SCB test results [22-27]. For this test a vertical compressive load is applied at the top of each specimen so a constant crack mouth opening displacement (CMOD) of 0.0005 mm/s is achieved, as described in AASHTO TP 105 – 13. More details in regards to equipment, test setup and specific test conditions for the SCB test are provided in AASHTO TP 105 - 13. The parameter fracture energy is determined as the area under load-CMOD curve, while toughness and stiffness are determined using load and load line displacement (LLD) results recorded for each tested specimen [28, 29]. A linear variable differential transformer (LVDT) built into the actuator was used to record load line displacement [26]. For this test at least three specimens were used from each group for testing at 12°C and analysis. The results used for further analysis from the SCB test will be fracture energy (Gf). 3. Discussion of Results & Analysis 3.1. │E*│ Master Curves
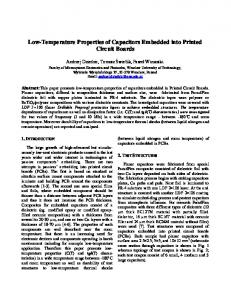
Using the sigmoidal function master curves were created using results gained from testing 3 specimens from each of the five groups at three temperatures – 4°C, 21°C, and 37°C, each at nine frequencies between 25 Hz and 0.1 Hz. The master curves are shown in Figure 1 (a) temperature and (b) reduced frequency. From the results shown in Figure 1 (a) as the temperature decreases the groups diverge from one another with some showing lower dynamic modulus results than others. The groups 10% CM and 5%HBO+5%PHBO show the biggest decrease in their dynamic modulus results when compared to the control, while 6% CM and 3%HBO+3%PHBO show a slightly lower decrease in the dynamic modulus values than the aforementioned two groups when compared to the control. As the temperature increases there appears to be a slope shift for the group 5%HBO+5%PHBO as compared to the other three rejuvenator groups at 33°C, where the rate of stiffness decreasing gradually gets smaller. There might be an error due to extrapolation for the 5
group 3%HBO+3%PHBO as the slope of the curve is very similar to the slope for the group 5%HBO+5%PHBO up until 33°C. Whereas the other groups with CM have a different slope that is more akin to the control, but shifted downward. These results could be interpreted to mean that HBO+PHBO decreases stiffness much more at lower temperatures than at higher temperatures as compared to the commercial rejuvenator CM. This could mean that HBO+PHBO widen the continuous grade range more than CM, and thus could be more valuable as a rejuvenator. The results do not appear different when examining dynamic modulus against reduced frequency as shown in Figure 1 (b). This is also an indication that the rejuvenator HBO+PHBO is working and working better than CM. To further prove this statement statistical analysis must be done. 3.2. Statistical Analysis of │E*│ Results
The measured dynamic modulus values tested at the aforementioned three temperatures (°C) and nine frequencies (Hz) for each of the five groups (three specimens each) are shown in Figure 2. The data trends indicate that dynamic modulus for all five groups increase with increasing frequency and decrease with decreasing temperature. All measured data from each individual specimen was used in statistical analysis (fifteen specimens worth of data at nine frequencies, and three temperatures). Anomalies were not parsed as there were none found during testing. An analysis of variance (ANOVA) using a split-plot/repeated measures (SPRM) design was conducted to examine which factors affect the dynamic modulus values. For the SPRM design the whole plot factor examined was group - A, and the sub plot factors examined were frequency (Hz) – B, and temperature (°C) - C. All the interactions between A, B, and C were examined. The ANOVA for the data shown in Figure 2 is shown in Table 4. For a factor/interaction to be significant under status the p-value must be less than or equal to 0.05 (statistically significant source of variability at the 95% confidence level). From Table 4 the main factors of interest are if the groups are different from one another, and if the interaction between group and temperature is a significant source of variability. These are important when looking at the effect on performance from the modification of the control group with rejuvenators. Both of these factors are significant. To look more closely at the interaction between group and temperature, least square mean differences gained from the student’s t-test are determined as shown in Table 5. When levels (groups) are not connected by the same letter, then this means said levels are statistically significantly different according to a 95% confidence interval. This means that there is a 5% chance that the groups are not found to be different from one another. From the results it is shown that the group 5%HBO+5%PHBO shows the best performance at 4°C in terms of the influence of the rejuvenator and dosage on VTB. At 21°C both groups 10% CM and 5%HBO+5%PHBO show the best performance, while at 37°C no differences are seen between the different rejuvenators/dosage level groups. The only difference at 37°C is from the control which has the highest dynamic modulus value. From the dynamic modulus results it can be said that the rejuvenator dosage combination 5%HBO+5%PHBO shows the biggest improvement with 10% CM close behind.
6
(a)
(b) Figure 1. │E*│ master curves for (a) temperature, and (b) reduced frequency
7
Figure 2. Measured E* data used in statistical analysis Table 4. ANOVA of E*, MPa using split plot repeated measure design Source DF SS MS F-value p-value A 4 4.04E+09 1.01E+09 19.43 0.0001 B 8 4.50E+09 5.62E+08 174.35