Low complexity, high performance neuro-fuzzy system for Internet traffic flows early classification Antonello Rizzi, Silvia Colabrese, Andrea Baiocchi DIET - University of Roma “Sapienza” - Via Eudossiana 18 - 00184 Roma, Italy Email:
[email protected],
[email protected]
pre-defined alternatives.
Abstract—Traffic flow classification to identify applications and activity of users is widely studied both to understand privacy threats and to support network functions such as usage policies and QoS. For those needs, real time classification is required and classifier’s complexity is as important as accuracy, especially given the increasing link speeds also in the access section of the network. We propose the application of a highly efficient classification system, specifically Min-Max neurofuzzy networks trained by PARC algorithm, showing that it achieves very high accuracy, in line with the best performing algorithms on Weka, by considering two traffic data sets collected in different epochs and places. It turns out that required classification model complexity is much lower with Min-Max networks with respect to SVM models, enabling the implementation of effective classification algorithms in real time on inexpensive platforms. Index Terms—Traffic flow classification; machine learning; neurofuzzy networks; features selection; classifier complexity
Among recent works on traffic classification, Li et al. [17] develop a Semi-Supervised Support Vector Machine (SVM) based on flow statistics, to identify and classify network application. They use a radial basis function (RBF) as the kernel function of the SVM and the co-training as a semi-supervised technique. The algorithm is implemented by procedures based on Weka 3.7 [18]. Wang et al. in [19] propose a token-based approach that uses machine learning techniques on statistical features of traffic. They first look for common substrings in the first N bytes of the flow payload for each class, and then apply a features selection algorithm to reduce the size of the token set. Their proposal achieves high classification accuracy with low computational complexity, but it requires payloads and it is not suitable for encrypted flows. In [20] Szabo´ and ¨ propose a novel framework that takes an incremental Szule approach, whereby new features are exploited as packets of a flow are observed and also different flows are correlated, so adapting the abstraction level of the traffic analysis to different purposes. In case of strictly real time, single flow classification, no special advantage is brought about by this approach.
I. I NTRODUCTION Traffic Analysis is the main technique used to exploit information leakage offered by observable features of packet traffic in a ciphered channel and infer as much as possible about the content of the traffic flow. In [1], Raymond et al. provide an overview of all possible attacks that can be carried out using traffic analysis. A large body of literature has grown on the problem of application layer traffic classification by means of traffic analysis and several methods of classification based on statistical analysis of traffic patterns and machinelearning techniques have been proposed and analyzed. For general reviews see [2][3][4][5][6][7]. Besides being an obvious attack on privacy, Traffic Classification can have useful and legitimate goals, as pointed out in [2], such as: identification of user activities in order to enforce traffic filtering and to support quality of service mechanisms; development of diagnostic tools for anomalous network behaviors, in order to identify possible worms or Denial of Service (DoS) attacks. In [8] traffic classification is deemed as a key component of automated QoS management. There is a vast literature presenting techniques that can identify traffic classes based solely on the use of traffic and packet features that remain observable even after encryption, e.g., see [9], [10] for general approaches to traffic flow classifications, [11] for the identification of encrypted Skype traffic within an aggregate traffic stream, [12], [13], [14] for classification of flows carried inside SSH connections, [15], [16] for classification of encrypted web pages among a set of
978-1-4673-2480-9/13/$31.00 ©2013 IEEE
We propose the use of a neuro-fuzzy machine learning system, specifically Min-Max networks trained by PARC algorithm, for real time traffic flow classification relying only on some simple features extracted from the first few packets of each flow. Since observed features are not impaired by encryption, this classification technique can be applied whenever it is possible to delineate individual flows. Key points shown in this paper are: i) accuracy as high as 99% and anyway above 90% can be achieved even with only few initial packets and in any case by using no more than the first ten packets of a flow; ii) complexity of the classification models is sensitively less than best performing ones, notably the Support Vector Machines (SVM). It is important to underline that a low structural complexity is a fundamental requirement in classification model synthesis, enabling the implementation of effective flow classification systems in real time on inexpensive platforms, such as FPGA based embedded systems. The rest of the paper is organized as follows. In Section II a synthetic description of feature extraction procedure from traffic data set is given. Section III gives a brief account of the Min-Max classification neurofuzzy network. Performance results are introduced and discussed in Section IV. Final remarks are given in Section V.
77
to limiting the range of the inter-arrival times from 0.1 µs up to 10 s. To sum up, normalized inter-arrival times are defined as tˆk = {(log10 (tk ) − θmin )/(θmax − θmin )}10 , where {x}10 = max{0, min{1, x}} and tk is measured in seconds. If we consider the first M packets of a flow, we can define a (full) feature vector associated to the flow as x = [d1 `ˆ1 d2 `ˆ2 tˆ2 . . . dM `ˆM tˆM ] ∈ R3M −1 . Given a set of classes C, each one corresponding to one application protocol or a set of application protocols, the flow classification problem consists of synthesizing a classification model φ that takes in input the vector x of features associated to a flow and decides the class the flow belongs to, i.e., φ : x 7→ C. To this aim, we consider machine learning approaches, i.e. data driven (inductive) modeling systems. Let Str and Sts be two sets of input-output pairs (labeled patterns), namely the training set and the test set. We call an instance of a classification problem a given pair hStr , Sts i, subject to the constraint Str ∩Sts = ∅. A classification system is a pair hCM, T Ai, where T A is the training algorithm, i.e. the set of instruction to synthesize, relying only on Str , an ¯ of the classification model CM . The synthesis is instance CM ¯ computed done with the aim to maximize the accuracy of CM ¯ on Sts , as an estimate of the expected performance of CM on unlabeled patterns (generalization capability). Details on the traffic traces used in our experiments are given in Section IV.
II. F LOW DEFINITION AND FEATURE EXTRACTION In this work, a flow is the bi-directional, ordered sequence of packets exchanged during a TCP connection. Ordering is based on time stamps at capture point. Within a TCP connection, application data segments are delivered as well as control segments, such as those related to three way-handshake and TCP ACKs. A regular flow is made up of all packets, orderly appearing from the packet carrying the TCP SYN segment to the one carrying the TCP FIN-ACK segment emitted by the connection initiator. During the extraction of TCP flows from the measured traffic traces (pcap files), we have considered also non complete flows, i.e., those TCP connections whose FIN segment cannot be found in the trace, provided that the number of useful segments composing the extracted flow be at least equal to the value needed for classification purposes. We remove the following packets from each TCP flow: i) TCP SYN and TCP SYN-ACK packets, carrying TCP threeway handshake messages; ii) TCP FIN packets; iii) TCP ACK packets, i.e. those packets carrying only a TCP level ACK and no TCP payload data, that can be recognized because their length is equal to the sum of IP and TCP headers; iv) retransmitted packets, that can be recognized because their RTX flag is set to one. In the following, we use the term flow to denote the sequence of packets left over by the above selection procedure. For a flow made up of N packets, we denote the j-th one as P Kj for j = 1, . . . , N . We consider the following parameters extracted from the traffic trace for each TCP segment of a flow: direction, length and timestamp. Hence the raw description of a flow is characterized as an ordered sequence of tuples (dj , `j , Tj ), with j = 1, . . . , N . Specifically: • dj ∈ {0, 1} where 1 encodes the direction detected for the opening SYN packet and 0 the opposite direction; • `j is the length of TCP segment P Kj payload in bytes; • Tj is the time stamp of P Kj at capture point. According to the definition, the length ranges between 1 byte and a maximum level. The maximum length, denoted as `max , is the MTU (Maximum Transmission Unit) of the interfaces crossed by TCP connections packets decreased by the minimum values of the TCP and IP header, namely 40 bytes overall. In all measured traces, we found out MTU = 1500 bytes has never been exceeded, which is just the largest allowed MTU of most Ethernet LANs and hence most of the Internet traffic. So, we set `max = 1460 bytes. The normalized length feature is evaluated as `ˆ = `/`max for a TCP segment with payload length `. As for the time feature, it is computed as tk = Tk − Tk−1 for the k-th packet of the flow, k ≥ 2. The dynamic range of the inter-arrival times is very large, going from few tens of µs up to several seconds. Yet this can be a significant feature to distinguish different applications, so that we have used a nonlinear compression. Specifically, we use the log10 (·) function. Times are measured in seconds, and we clip the compressed value on θmin = −7 as the lower limit and on θmax = 1 as the upper limit. This amounts
III. N EUROFUZZY M IN -M AX C LASSIFIER The Min-Max classification strategy consists of directly defining the decision regions of the unknown classification process to be modeled by covering the patterns of the training set with hyperboxes (HBs). A HB in IRn is a finite polyhedral region delimited by 2n hyperplanes, each constrained to be parallel to the coordinate axes of the input space reference system. On the basis of these constraints, it is possible to establish univocally the size and the position of each HB by means of two vertices, namely the ‘Min’ point v and the ‘Max’ point w, where v and w are respectively the closest and the farthest vertices to the origin of the reference system. Such a crisp set can be fuzzified by associating a membership function with it. In the following we consider the membership function defined by (1) proposed by Simpson [21], in which the slope outside the HB Hh is established by the fuzziness parameter γ, i.e.: n
µHh (x) =
1X (1 − f (xj − whj ) − f (vhj − xj )) n j=1
(1)
where 1 γz f (z) = 0
γz > 1 0 ≤ γz ≤ 1 γz < 0
x = [x1 , x2 , ..., xn ]
T
(2b) T
vh = [vh1 , vh2 , ..., vhn ]
wh = [wh1 , wh2 , ..., whn ]
78
(2a)
(2c) T
(2d)
computes the membership of the input pattern with respect to that HB. Let Q be the total number of neurons in the hidden layer and let qi be the number of neurons associated with class ci (i = 1, . . . , L). It is q1 + q2 + · · · + qL = Q. The third (output) layer is composed of one neuron for each class. Each neuron of the output layer determines the fuzzy membership of the input pattern with respect to the corresponding class, by computing the fuzzy union of the outputs of all neurons in the hidden layer associated with the corresponding class, i.e: n o µ(ci ) (x) = max µH (ci ) (x) (3) 1≤h≤qi
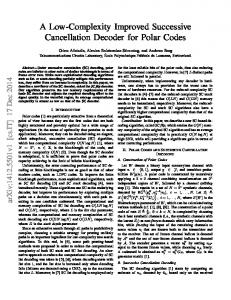
Fig. 1.
The hyperbox membership function with γ = 0.5.
Fig. 1 shows the typical shape of the original Simpson’s membership function in the case of a two dimensional (n = 2) support space for γ = 0.5. This value of γ will be used as default value for all the membership functions. In fact, the sensitivity to the specific value of γ is quite low, since the borders of the space regions found by comparing the membership functions do not change if a same value of γ is chosen for all of them. Since we are facing an exclusive classification problem, each HB is associated with a unique class label in C. Several HBs can be associated with the same class label. The notation (c ) Hh i means that the h-th HB is associated with the class label ci ∈ C. A Min-Max classification model is a feed-forward three layer network (see Fig. 2). H1(c1 )
H
(c1 ) q1
! H 1 !x " q1
! H1(cL )
xn
H (cqLL ) Fig. 2.
1≤i≤L
When feeding an input x to the Min-Max network, a classification error occurs if the obtained ck˜ is different from the target output label (the class label associated with the input pattern x). Starting from a given training set, a constructive learning algorithm for a Min-Max network must establish the number, position and size of each HB. To this aim, we use the Pruning Adaptive Resolution Classifier (PARC) learning algorithm. A detailed description of PARC training procedure can be found in [22]. This algorithm is highly automatic, since it does not depend on pattern presentation order and no critical parameter must be fixed in advance by the user. It produces a succession of candidate classifiers among which a selection procedure will automatically choose the best one according to the Occam’s razor Criterion, by minimizing a convex combination of the complexity and of the classification error on the training set. This classification system is employed in the following as the core inference engine of a more complex machine learning system able to automatically determine both the network optimal structure and the most relevant features’ subset. The whole machine learning procedure implements an automatic feature selection mechanism relaying on a wrapper scheme. A genetic optimization procedure is in charge to evolve a population of features subsets, searching for the best performing one.
! (cH11 ) !x "
! (c1 ) !x "
(c )
x1
(c L ) H1
C1
!x " CL
! (c L ) !x "
W T A
h
Since the input space dimension n and the number of classes L are fixed by the classification problem, it is obvious to state that the structural complexity of a Min-Max network is directly represented by the number Q of neurons in the hidden layer (corresponding to the total number of hyperboxes). From Eqs. (2d), (3) and (4) it is possible to state that the computational complexity of a Min-Max neurofuzzy model is O(Q·n), where n is the number of features making up the description of the ojects to be classified. The storage requirement for the HBs is 2Qn real numbers. When dealing with exclusive classification problems, the class corresponding to the maximum membership value is selected as the output class label (winner takes all strategy): n o ck˜ = argmax µ(ci ) (x) (4)
c ~k
! (cH L ) !x " qL
The structure of a Min-Max neurofuzzy classifier.
IV. P ERFORMANCE ANALYSIS
The first layer is a dummy one, aiming only to supply the input features to each neuron of the second (hidden) layer. Each neuron of the hidden layer corresponds to a HB and it
For the comparison between SVM and our Min-Max Classifier, we decided to take the former as implemented in Weka
79
[18], while the latter is implemented as a C + + application. We have chosen SVM because it is usually employed as benchmarking reference due to its usually high accuracy and it is widely used in papers regarding machine learning based traffic classification. Moreover it is among the best performing algorithms implemented in Weka we have evaluated in a preliminary wide test campaign. The training algorithm implemented in Weka for SVM (SMO) is in charge to synthesize an SVM classification model, characterized by a set of L Support Vectors vi ∈ Rn , i = 1, 2, . . . , L, where n is the number of features. The computational complexity of an SVM model is O(L · n), which is also proportional to the amount of memory needed to store the model. In the synthesis of the SVM model, we have chosen a quadratic polynomial kernel function. Weka offers an automatic feature selection procedure designed as a wrapper scheme, similar to the genetic optimization procedure designed around the hM in − M ax, P ARCi classification system. Specifically we selected the BestFirst algorithm as the search heuristic. In the following tests we focused on the following performance indicators: • •
•
complexity: i) number of selected features, from the initial full feature vector associated to a flow; selection is done by each algorithm as part of its optimization; ii) model structural complexity, i.e., number of support vectors (L) for SVM or number of hyperboxes (Q) for Min-Max; • delay: the number M of packets required to decide on flow classification. As for complexity metric ii), note that a support vector is specified by a vector in Rn , whereas a hyperbox requires two vectors in Rn , where n is the number of selected features (possibly different for SVM and Min-Max). We present the results obtained with Data Set 1 in Subsection IV-A and and with Data Set 2 in Subsection IV-B. In all Tables, we use the abbreviations acc for “accuracy”, nsf for “number of selected features” and msc for “model structural complexity”. •
A. Classification with Data Set 1 Data Set 1 comprises flows belonging to five application protocols: HTTP, FTP-C (control session of FTP), POP3, SSH, Emule. With this data set, we identify classes with application protocols. The first two kinds of flow were collected by means of automated crawlers that visit lists of URL addresses or ftp sites, scattered over different geographical zones. The other flows are collected from the output link of the Department where the NetLab is located at University of Roma. Out of all collected flows, we selected those containing at least 10 packets, obtaining 796 flows for each class. In Table I performance are listed as a function of M . In this and all subsequent performance tables, we report the average performance metrics averaged over ten runs of the feature selection optimization and the corresponding standard deviation of the results in parentheses. What appears from Table I is that the number of hyperboxes is at least an order of magnitude lower than the number of support vectors. Moreover, hyperboxes and support vectors live in Rn , where n is the number of selected features. That number is much lower for Min-Max than for SVM, often saving two orders of magnitude for Min-Max complexity with respect to SVM. Accuracy is comparable, especially for bigger values of M .
accuracy: fraction of test flows correctly classified; complexity: amount of information needed to specify an instance of a classification model. For SVM and Min-Max models, it is proportional to both the amount of memory needed to store the model and to the computational complexity of the associated decision rule; delay: number of useful packets, since flow start, required to assign a classification label.
Since we aim to design real-time classifiers, the last two issues are crucial, besides the first one which is the obvious condition for the classifier to be of any use. Experiments are carried out with real traffic traces. We use traces that have been collected at two different research labs, in two different epochs and places, namely the NetLab at DIET – University of Roma “Sapienza” (so called traffic Data Set 1), collected in 2008, and the networking research group at University of Brescia (so called Data Set 2), collected in 2009 (see http://www.ing.unibs.it/ntw/tools/traces/). Being independent data sets, they allow us to check the consistency of the outcomes of SVM and Min-Max comparison. In the analysis we take into consideration a range of M packets per flow with M that goes from 3 to 10. To maintain the same number of flows per class as M is varied, we have restricted our consideration to flows that consist of at least 10 packets. Given the overall available number of flows, we have devoted half of them to the training phase of classification algorithms and the other half for testing the algorithms capacity to generalize. The performance indicators introduced above translate into the following performance metrics: •
TABLE I C OMPARISON BETWEEN SVM AND M IN -M AX PARC. DATA S ET 1, 5 CLASSES . #pkts M 3 4 5 6 7 8 9 10
acc x ¯(σ) 99.397 (0) 97.69 (0.16) 97.55 (0.76) 93.61 (0.78) 97.01 (2.92) 93.99 (3.28) 95.05 (3.42) 97.20 (3)
SVM nsf x ¯(σ) 7.90 (0.32) 10.10 (0.56) 11.80 (1.32) 12.20 (1.04) 12.20 (1.82) 14.50 (2.54) 12.70 (2.46) 13.10 (2.14)
msc x ¯(σ) 203.80 (0.64) 179.50 (2.54) 172.40 (9.74) 160.70 (8.28) 156.20 (9.76) 153 (9.5) 152.60 (14.18) 141.40 (17.66)
acc x ¯(σ) 96.13 (0) 96.13 (0) 94.32 (3.74) 94.35 (3.28) 97.22 (2.74) 96.25 (3.24) 97.45 (2.72) 96.83 (3.4)
Min-Max PARC nsf x ¯(σ) 2 (0) 2 (0) 2.40 (0.52) 2.40 (0.52) 3.30 (0.94) 3.40 (1.08) 3.50 (0.84) 3.70 (1.06)
msc x ¯(σ) 15 (0) 15 (0) 13.70 (2.22) 13.70 (2.26) 10.10 (4.02) 11 (3.66) 9.90 (3.52) 10.60 (3.02)
B. Classification with Data Set 2
accuracy: weighted average of the classification accuracy for each class, calculated as the ratio of the number of correctly classified flows belonging to class c and the overall number of flows of class c in the test set;
We have used the data set provided by the University of Brescia. Traces were collected at their Campus during three working days (06/16, 06/17 and 06/24 in 2009). Among
80
the available applications, we decided to consider only those shown in Table II, by grouping flows belonging to some different applications under the same protocol-application ID. Each row reports the protocol application ID and the corresponding number of flows that contain a number of packets at least equal to the value shown on top of each column (2, 5, 10 or 15). It is noted that the ground truth information for these traces was collected with gt, an ad hoc tool realized at the University of Brescia. The description of its functioning and the way it is possible to obtain protocol and application labels is described in [23].
differentiated Quality of Service. Our classification can be seen as a rough split, but the aim is to distinguish among flows with real-time needs, those that an ISP may want to limit or can be dealt with as background traffic (P2P) and other flows that deserve an intermediate priority. The final division is reported in Table IV, while Table V illustrates the results. Since we are dealing with only three classes, we get definitely higher values of accuracy with respect to Table III. Moreover, MinMax PARC exhibits the same accuracy as SVM, though with much lower complexity. TABLE IV F LOWS EMPLOYED IN THE EXPERIMENTS , DATA S ET 2, 3 CLASSES ; THE NUMBER OF FLOWS APPEAR WITHIN PARENTHESES .
TABLE II P ER CLASS DIVISION OF THE FLOWS EXTRACTED FROM DATA S ET 2. Protocol-application Bittorrent-bittorent Bittorrent-Transmission Edonkey-amule Skype-skype HTTP SSL-Mail SSL-Others IMAP-thunderbird POP3-Mail SMTP-Mail
> 2 pkts 1429 3197 13970 993 45360 3606 1736 78 775 125
> 5 pkts 700 2925 13902 852 28445 3602 1726 78 775 125
> 10 pkts 232 1949 5217 449 17626 3589 1326 74 747 118
> 15 pkts 229 1685 1443 427 13380 3518 811 74 18 118
The number of available flows greatly varies among these 10 classes and, within the same class, with the minimum number of packets. In our analysis we have decided to limit such an imbalance among these 10 classes. So, the number of flows employed in the experiments has been chosen as the minimum between 2000 and the number of available flows having at least 10 packets. Results of the comparison are illustrated in Table III. The average accuracy of both classifiers is somewhat lower than with Data Set 1 (see Table I). This is to be expected since those results have been obtained for five classes, while in Table III we are dealing with a more critical experiment, where we define ten different classes.
3 4 5 6 7 8 9 10
acc x ¯(σ) 84.48 (0.01) 87.57 (0.06) 92.37 (0) 93.80 (0.30) 94.10 (0.46) 94.42 (0.39) 94.31 (0.27) 94.18 (0.33)
SVM nsf x ¯(σ) 7.80 (0.42) 10.20 (0.42) 14 (0) 15.70 (0.95) 17.30 (1.34) 19.60 (1.08) 22.90 (0.74) 24.80 (1.40)
msc x ¯(σ) 2047.60 (7.16) 1602 (42.16) 1010 (0) 1038 (78.70) 1019.50 (88.15) 939.10 (16.84) 960.30 (21.12 ) 990 (20.88 )
acc x ¯(σ) 90.91 (0) 91.07 (0) 91.07 (0) 91.07 (0) 91.30 (0.12) 91.13 (0.12) 91.32 (0.22) 91.48 (0.22)
Min-Max PARC nsf x ¯(σ) 2 (0) 3 (0) 3 (0) 3 (0) 4.60 (0.84) 3.40 (0.84) 4.50 (1.08) 4.90 (0.74)
Skype (448) Other (2592)
Composition Bittorrent (232), Bittorrent-Transmission (400), Edonkey (400) Skype (448) POP3 (400), SSL-Mail (400), SSL-Other (400), IMAP (74), SMTP (118), HTTP (1200)
TABLE V C OMPARISON BETWEEN SVM AND M IN -M AX PARC. DATA S ET 2, 3 CLASSES . #pkts M 3 4 5 6 7 8 9 10
acc x ¯(σ) 93.90 (0.15) 97.36 (0.02) 98.16 (0) 98.20 (0.32) 97.99 (0.34) 98.13 (0.34) 97.61 (0.66) 97.91 (0.24)
SVM nsf x ¯(σ) 7.43 (0.53) 9.43 (0.53) 14(0) 15.30 (0.82) 15.70 (1.82) 18.40 (1.72) 18.80 (1.82) 21.80 (1.88)
msc x ¯(σ) 627.43 (3.21) 480.71 (12.83) 244 (0) 184.20 (20.32) 199.60 (30.86) 194 (11.86) 191.90 (12.12) 175.40 (14.18)
acc x ¯(σ) 94.93 (0) 95.75 (0) 95.75 (0) 97.79 (0) 97.72 (0.20) 97.79 (0) 97.66 (0.42) 97.69 (0.72)
Min-Max PARC nsf msc x ¯(σ) x ¯(σ) 2 (0) 30 (0) 3 (0) 20 (0) 3 (0) 20 (0) 3 (0) 13 (0) 3 (0) 13.10 (0.32) 3 (0) 13 (0) 3.10 (0.32) 12.70 (0.94) 3.70 (0.48) 10.80 (1.76)
What if we try to infer what application travels inside an encrypted flow? To this purpose we have used a set of different traces, again collected at the University of Brescia. A full account of the measurement is given in [24]. The entire traffic of a given subnet in the campus of University of Brescia was routed through a SSH tunnel during three working days (06/16, 06/17 and 06/24 in 2009). To this purpose, they developed SSHgate, that is a tool freely available. The presence of SSHgate helped the collection of ground truth information during the experiments, but did not change the way the regular SSH implementations work. In this case also we started from the pcap traces and applied the processes described in Section II. To find the first data packet within a SSH connection, we used the procedure described in [24]. Also in this case we have defined three classes, with the same meaning as in Table IV. Table VI summarizes the aggregated application protocols and the number of flows used for each one.
TABLE III C OMPARISON BETWEEN SVM AND M IN -M AX PARC. DATA S ET 2, 10 CLASSES . #pkts M
Macroclasses P2P (1032)
msc x ¯(σ) 69 (0) 47 (0) 47 (0) 47 (0) 36.6 (5.48) 44.40 (5.48) 38.10 (6.22) 35.80 (4.16)
In general, the Min-Max classifier loses by a tiny bit against SVM in terms of accuracy, while it requires a much lower complexity, on the average, by two orders of magnitude. This is the result of the optimization procedure of the MinMax synthesis algorithm, where complexity is traded off with accuracy. In a second experiment, we have divided the protocols of Table II into three macro-classes: P2P, Skype and ’Other’. Such a classification could be of interest to an ISP for the provision of
TABLE VI F LOWS EMPLOYED IN THE EXPERIMENTS , DATA S ET 2, ENCRYPTED TRAFFIC ; THE NUMBER OF FLOWS APPEAR WITHIN PARENTHESES . Macroclasses P2P (2000) Skype (40) Other (1474)
81
Composition Bittorrent-Transmission (2000) Skype (40) HTTP, HTTPS, Mail, SSL-Mail
Results are illustrated in table VII.
[3] H. Kim, K. C. Claffy, M. Fomenkov, D. Barman, M. Faloutsos, and K. Lee, “Internet traffic classification demystified: myths, caveats, and the best practices,” in CoNEXT, 2008, p. 11. [4] T. Nguyen and G. Armitage, “A survey of techniques for internet traffic classification using machine learning,” Communications Surveys Tutorials, IEEE, vol. 10, no. 4, pp. 56 –76, quarter 2008. [5] M. Mellia, A. Pescap`e, and L. Salgarelli, “Traffic classification and its applications to modern networks,” Computer Networks, vol. 53, no. 6, pp. 759–760, Apr. 2009. [6] A. Dainotti, A. Pescap`e, and K. Claffy, “Issues and future directions in traffic classification,” Network, IEEE, vol. 26, no. 1, pp. 35 –40, January-February 2012. [7] K. P. Dyer, S. E. Coull, T. Ristenpart, and T. Shrimpton, “Peek-a-Boo, I Still See You: Why Efficient Traffic Analysis Countermeasures Fail,” in IEEE Symposium on Security and Privacy, 2012. [8] T. T. T. Nguyen, G. Armitage, P. Branch, and S. Zander, “Timely and continuous machine-learning-based classification for interactive ip traffic,” Networking, IEEE/ACM Transactions on, vol. 20, no. 6, pp. 1880 –1894, dec. 2012. [9] C. V. Wright, F. Monrose, and G. M. Masson, “On Inferring Application Protocol Behaviors in Encrypted Network Traffic,” Journal of Machine Learning Research, vol. 6, pp. 2745–2769, 2006. [10] L. Bernaille, R. Teixeira, and K. Salamatian, “Early application identification,” in CoNEXT, 2006, p. 6. [11] D. Bonfiglio, M. Mellia, M. Meo, D. Rossi, and P. Tofanelli, “Revealing skype traffic: when randomness plays with you,” SIGCOMM Comput. Commun. Rev., vol. 37, no. 4, pp. 37–48, Aug. 2007. [Online]. Available: http://doi.acm.org/10.1145/1282427.1282386 [12] R. Alshammari and A. N. Zincir-Heywood, “A flow based approach for SSH traffic detection,” in SMC, 2007, pp. 296–301. [13] ——, “Generalization of Signatures for SSH Encrypted Traffic Identification,” in IEEE Symposium on Computational Intelligence in Cyber Security, CICS 2009, 2009. [14] M. Dusi, A. Este, F. Gringoli, and L. Salgarelli, “Using GMM and SVMBased Techniques for the Classification of SSH-Encrypted Traffic,” in ICC, 2009, pp. 1–6. [15] M. Liberatore and B. N. Levine, “Inferring the source of encrypted HTTP connections,” in ACM Conference on Computer and Communications Security, 2006, pp. 255–263. [16] S. Chen, R. Wang, X. F. Wang, and K. Zhang, “Side-Channel Leaks in Web Applications: A Reality Today, a Challenge Tomorrow,” in IEEE Symposium on Security and Privacy, 2010, pp. 191–206. [17] X. Li et al., “An Internet Traffic Classification Method Based on SemiSupervised Support Vector Machine,” in IEEE International Conference on Communications (ICC), 2011. [18] “Weka 3: Data Mining Software in Java,” http://www.cs.waikato.ac.nz/ ml/weka/. [19] Y. Wang, Y. Xiang et al., “Internet Traffic Classification Using Machine Learning: A Token-based Approach,” in 14th IEEE International Conference on Computational Science and Engineering, 2011. [20] G. Szab´o, Sz¨ule et al., “Multi-Level Machine Learning Traffic Classification System,” in ICN 2012: The Eleventh International Conference on Networks, 2012, pp. 69–77. [21] P. K. Simpson, “Fuzzy min-max neural networks - part 1: Classification,” IEEE Trans. on Neural Networks, vol. 3, no. 5, pp. 776–786, 1992. [22] A. Rizzi, M. Panella, and F. Frattale Mascioli, “Adaptive resolution minmax classifiers,” IEEE Transactions on Neural Networks, vol. 13, no. 2, pp. 402 – 414, March 2002. [23] F. Gringoli, L. Salgarelli, M. Dusi et al., “GT: Picking up the Truth from the Ground for Internet Traffic,” in ACM SIGCOMM Computer Communication Review, 2009. [24] M. Dusi, A. Este et al., “Using GMM and SVM-based Techniques for the Classification of SSH-Encrypted Traffic,” in IEEE ICC, 2009. [25] A. Cinti and A. Rizzi, “Neurofuzzy min-max networks implementation on fpga,” in IJCCI (NCTA), K. Madani, J. Kacprzyk, and J. Filipe, Eds. SciTePress, 2011, pp. 51–57.
TABLE VII C OMPARISON BETWEEN SVM AND M IN -M AX PARC. DATA S ET 2, ENCRYPTED TRAFFIC . #pkts M 3 4 5 6 7 8 9 10
acc x ¯(σ) 93.45 (0) 94. 55 (0.02) 95.92 (0.16) 98.96 (0.42) 98.98 (0.08) 99.24 (0.16) 99.11 (0.22) 99.16 (0.12)
SVM nsf x ¯(σ) 4.60 (0.84) 7.40 (0.96) 10.10 (0.88) 9.30 (2.36) 10.50 (1.26) 12.70 (1.64) 11.50 (1.50) 11.80 (1.98)
msc x ¯(σ) 447.30 (12.98) 392.20 (1.76) 264.40 (5.04) 110.70 (35.86) 79.90 (4.58) 64.80 (7.82) 71 (7.10) 71.50 (8.14)
Min-Max PARC acc nsf msc x ¯(σ) x ¯(σ) x ¯(σ) 92.94 (0) 1 (0) 15 (0) 98.80 (0) 2 (0) 5 (0) 98.83 (0.07) 2 (0) 5 (0) 98.82 (0.06) 2 (0) 5 (0) 98.80 (0) 2 (0) 5 (0) 98.86 (0.08) 2 (0) 5 (0) 98.86 (0.08) 2 (0) 5 (0) 98.87 (0.08) 2 (0) 5.20 (0.64)
V. F INAL REMARKS AND WORK IN PROGRESS The availability of effective and reliable traffic classification systems is a key topic in designing intelligent network management tools, designated, e.g., to support Quality of Service mechanisms and to implement automatic diagnostic procedures for anomaly network behavior. Since such systems should work also inside encrypted connections, it is mandatory to relay on flows properties observable also in presence of encrypted payloads. To this aim we have adopted a machine learning neurofuzzy approach to traffic classification based on simple features extracted from the very first flow packets. Tests have been carried out on two different data sets, defining four distinct classification problem instances. We considered the SVM Weka implementation for performance comparison, since it is commonly used as a benchmarking reference, due to its high generalization capability. Our results shows that MinMax models trained by PARC algorithm can achieve accuracy very close to the ones reached by SVM models, with structural (and computational) model complexity much more suited in traffic analysis applications on high data rate links. Indeed, although the most important property of a classification model is its generalization capability (i.e. the accuracy on test set as a measure of the expected performance in true working conditions), when designing devices for intelligent network management, a key issue is the structural model complexity. In fact, a limited complexity is a fundamental requisite for the development of custom circuits dedicated to real time classification tasks, when a complete traffic control on fast links is needed, without relying on random sampling flows approaches. To this aim we have designed an FPGA based embedded system where the core classification model is a MinMax neurofuzzy network [25], potentially able to work on 100 Mbit/s or higher rates links. Future works will be focused on system design and implementation on an Altera FPGA board, pushing on sustainability of higher link rates. R EFERENCES [1] J.-F. Raymond, “Traffic Analysis: Protocols, Attacks, Design Issues, and Open Problems,” in Workshop on Design Issues in Anonymity and Unobservability, 2000, pp. 10–29. [2] A. C. Callado, C. A. Kamienski, G. Szabo, B. P. Gero, J. Kelner, S. F. L. Fernandes, and D. F. H. Sadok, “A Survey on Internet Traffic Identification,” IEEE Communications Surveys and Tutorials, vol. 11, no. 3, pp. 37–52, 2009.
82