Accepted Article
DR. DAISUKE Article type
KUKIDOME (Orcid ID : 0000-0002-8414-8349) : Original Article
Low glucose induces mitochondrial reactive oxygen species via fatty acid oxidation in bovine aortic endothelial cells
Nobuhiro Kajihara1, Daisuke Kukidome1*, Kiminori Sada1, Hiroyuki Motoshima1, Noboru Furukawa1, 2, Takeshi Matsumura1, Takeshi Nishikawa1, 3, Eiichi Araki1
1
Department of Metabolic Medicine, Kumamoto University, 1-1-1 Honjo, Chuo-ku, Kumamoto 860-8556, Japan
2
Center for Medical Education and Research, Faculty of Life Sciences, Kumamoto University, 1-1-1 Honjo, Chuo-ku, Kumamoto 860-8556, Japan
3
Department of Diabetes and Endocrinology, National Hospital Organization Kumamoto Medical Center, 1-5 Ninomaru, Chuo-ku, Kumamoto 860-0008, Japan
*
Corresponding author
Daisuke Kukidome, MD, PhD Department of Metabolic Medicine, Kumamoto University, 1-1-1 Honjo, Chuo-ku, Kumamoto 860-8556, Japan Tel.: +81 (96) 373-5169 Fax: +81 (96) 366-8397 Email:
[email protected] Short running title: Low glucose increases mitochondrial ROS This article has been accepted for publication and undergone full peer review but has not been through the copyediting, typesetting, pagination and proofreading process, which may lead to differences between this version and the Version of Record. Please cite this article as doi: 10.1111/jdi.12678 This article is protected by copyright. All rights reserved.
Accepted Article
Abstract Aims/Introduction: Overproduction of reactive oxygen species (ROS) in endothelial cells (ECs) plays a pivotal role in endothelial dysfunction. Mitochondrial ROS (mtROS) is one of the key players in the pathogenesis of diabetic vascular complications. Hypoglycemia is linked to increased ROS production and vascular events; however, the underlying mechanisms remain unclear. In this study, we aimed to determine whether and how low glucose (LG) mediates mtROS generation in ECs and to examine the impact of LG-induced mtROS on endothelial dysfunction. Materials and Methods: Metabolomic profiling, cellular oxygen consumption rate, mtROS, endothelial nitric oxide synthase (eNOS) phosphorylation, and the expression of vascular cell adhesion molecule-1 (VCAM-1) or intercellular adhesion molecule-1 (ICAM-1) were evaluated in bovine aortic ECs. Results: We found that LG increased mtROS generation in ECs; which was suppressed by overexpression of manganese superoxide dismutase (MnSOD). Comprehensive metabolic analysis using capillary electrophoresis-mass spectrometry and oxygen consumption rate assessment revealed that the pathway from fatty acid to acetyl-CoA via fatty acid oxidation (FAO) was upregulated in ECs under LG conditions. In addition, etomoxir, a specific inhibitor of the free fatty acid transporter, decreased LG-induced mtROS production. These results suggested that LG increased mtROS generation through activation of FAO. We further revealed that LG inhibited eNOS phosphorylation and increased the expression of VCAM-1 and ICAM-1. These effects were suppressed either by overexpression of MnSOD or by treatment with etomoxir. Conclusions: The activation of FAO followed by mtROS production could be one of the causes for endothelial dysfunction during hypoglycemia.
This article is protected by copyright. All rights reserved.
Accepted Article
Key words: fatty acid oxidation, low glucose, mitochondrial reactive oxygen species
Introduction Overproduction of reactive oxygen species (ROS) caused by several factors, such as diabetes, obesity, hypertension, hyperlipidemia, and smoking, plays a pivotal role in the pathogenesis of cardiovascular diseases. Excess production of ROS can promote endothelial dysfunction, which is thought to play an important role not only in the initiation of atherosclerosis but also in the etiology of diabetic vascular complications1-4. Therefore, to prevent diabetic vascular complications, it is essential to elucidate the mechanisms of ROS generation in the context of diabetes. The Diabetes Control and Complications Trial (DCCT)5, the United Kingdom Prospective Diabetes Study (UKPDS)6, and our Kumamoto Study7 provide strong evidence that hyperglycemia plays an important role in the pathogenesis of microvascular complications in both type 1 and type 2 diabetes. In addition, hyperglycemia-induced ROS generation has been reported to be involved in vascular endothelial dysfunction in patients with diabetes4. Consistent with these reports, Nishikawa et al proposed that mitochondrial ROS (mtROS) is the major cause of diabetes-induced oxidative stress in endothelial cells (ECs)8. Recent large randomized clinical trials have shown that intensive glycemic control may fail to reduce macrovascular events9. Along with improvements in diabetes management with insulin or insulin secretagogues, there has been an increase in the prevalence of hypoglycemia with efforts to achieve better glycemic control. Severe hypoglycemia is strongly associated with an increased risk for vascular events and death. However, it is not clear whether there is a causal relationship between hypoglycemia and these outcomes10. Hypoglycemic events may trigger inflammation, blood coagulation abnormalities, the
This article is protected by copyright. All rights reserved.
Accepted Article
sympathoadrenal response, and endothelial dysfunction, and these responses are interdependent. As a result, endothelial dysfunction mediated by hypoglycemic abnormalities could contribute to cardiovascular risk11. Previous studies have reported that hypoglycemia induces oxidative stress in type 1 diabetes12 and that recurrent hypoglycemia potentiates long-term hyperglycemia-mediated impairment of hippocampal mitochondria and increases the oxidative stress13. Therefore, oxidative stress in ECs may be a common factor linking hyperglycemia, hypoglycemia, and the vascular complications of diabetes. Therefore, the aims of the present study were to evaluate whether low glucose (LG) conditions exacerbated mtROS in ECs, similarly to high glucose conditions, and to evaluate whether the suppression of LG-induced mtROS could ameliorate endothelial dysfunction. Elucidation of the mechanisms of through which hypoglycemia promotes endothelial dysfunction may help to prevent diabetic complications.
Materials and Methods Cell culture conditions and materials Bovine aortic endothelial cells (BAECs) were purchased from TOYOBO (Osaka, Japan). Cells were cultured in Dulbecco’s modified Eagle’s medium (Wako, Osaka, Japan) with 10% fetal bovine serum and 1.0, 2.5, 4.0, 5.5, or 25 mM glucose in an atmosphere containing 5% CO2 and 95% air at 37°C. Etomoxir, 1-(2,3,4-trimethoxybenzyl) piperazine dihydrochloride (trimetazidine), bis-2-(5-phenylacetamido-1,3,4-thiadiazol-2-yl) ethyl sulfide (BPTES), and carbonyl cyanide 3-chlorophenylhydrazone (CCCP) were from Sigma-Aldrich (St. Louis, MO, USA).
This article is protected by copyright. All rights reserved.
Accepted Article
Adenoviral vectors Human manganese superoxide dismutase (MnSOD) adenoviral vectors were provided by Dr. M. Brownlee (Albert Einstein College of Medicine, Bronx, NY, USA)8. Cells were infected with MnSOD adenovirus or lacZ control adenovirus 48 h before experiments. MnSOD overexpression was confirmed using western blot analysis, as previously described14.
Measurement of mtROS generation To evaluate the direct generation of mtROS, we used the reduced MitoTracker Red CM-H2XRos probe (ThermoFisher Scientific, Waltham, MA, USA), which specifically detects the ROS generation in mitochondria15. Cells were incubated with 300 nM MitoTracker Red CM-H2XRos at 37°C for 30 min before the end of the experiment.
Measurement of MnSOD activity MnSOD activity was measured using a SOD assay kit-WST (Dojindo, Kumamoto, Japan), according to the manufacturer’s instructions.
Measurement of metabolites Measurement of metabolites was performed according to the manufacturer’s instructions (Human Metabolome Technologies, Inc., Tsuruoka, Japan) as follows. Culture cells (8 × 10⁶ cells/sample) were used for the extraction of intracellular metabolites. Culture medium was aspirated from the dish, and cells were washed twice with 5% mannitol solution (10 mL first and then 2 mL). Cells were then treated with 800 µL methanol and left to rest for 30 s to inactivate enzymes. Next, the cell extract was treated with 550 µL Milli-Q water containing internal standards (H3304-1002; Human Metabolome Technologies, Inc.) and left to rest for another 30 s. The extract was obtained and centrifuged at 2300 × g and 4°C for 5 min, and
This article is protected by copyright. All rights reserved.
Accepted Article
700 µL of the upper aqueous layer was then filtered by centrifugation through a Millipore 5-kDa cutoff filter at 9100 × g and 4°C for 120 min to remove proteins. The filtrate was concentrated by centrifugation and resuspended in 50 µL Milli-Q water for capillary electrophoresis-mass spectrometry.
Respirometry (extracellular flux analysis) The oxygen consumption rate (OCR) and extracellular acidification rate (ECAR) were measured using an intact cell respirometer designed for adherent cells (XF-24 Extracellular Flux Analyzer; Seahorse Bioscience, North Billerica, MA, USA). BAECs were seeded at a density of 10000 cells/well in 24-well plates designed for respirometer analysis. Cells reached confluency and were subjected to respirometry at 2 days after seeding.
Mitophagy detection Mitophagy was evaluated using a Mitophagy Detection Kit (Dojindo, Kumamoto, Japan), according to the manufacturer’s instructions.
Western blot analysis Western blot analysis was performed as previously described14. Polyclonal antibodies for phosphorylated acetyl CoA carboxylase (ACC; Ser79), ACC, phosphorylated endothelial nitric oxide synthase (eNOS; Ser1177), and CPT1A were from Cell Signaling Technologies (Beverly, MA, USA). Polyclonal antibodies for eNOS and CPT1B were from Abcam (Cambridge, UK).
This article is protected by copyright. All rights reserved.
Accepted Article
RNA extraction and quantitative reverse transcription polymerase chain reaction (RT-PCR) analysis After incubation for 1 h under each experimental condition, total cellular RNA was extracted with an RNeasy Mini Kit (Qiagen, Hilden, Germany). All PCR analyses were performed with a LightCycler System (Roche Molecular Biochemicals, Indianapolis, IN, USA) using SYBR Green I master mix. Specific primers for PCR were as follows: vascular cell adhesion molecule-1 (VCAM-1) forward, 5′-TTGCGCAGATTGGTGACTCT-3′; VCAM-1 reverse, 5′-CCACTCGGATTGCTTTCTCC-3′; intercellular adhesion molecule-1 (ICAM-1) forward, 5′-GGACCATGGCACCAATTTCT-3′; 5′-GAGGCTGGGAACAGTCCATC-3′; GGTCGACTTCCAGCTCAGTC-3′;
ICAM-1 CPT1B CPT1B
reverse, forward,
5′-
reverse,
5′-
AGTAGGAGGAACCCGCTGTT-3′; 18S forward, 5′-CTCAACACGGGAAACCTCAC-3′; and 18S reverse, 5′-AGACAAATCGCTCCACCAAC-3′. Expression of 18S was used for normalization in gene expression analysis.
Statistical analysis Data are presented as means ± standard deviations (SDs). Statistical analysis was performed using unpaired Student’s t-tests for two-group comparisons and one-way analysis of variance (ANOVA) followed by Tukey’s multiple comparison tests or Games-Howell multiple comparison tests for more than two groups using SPSS software (ver. 21; IBM, Armonk, NY, USA). A P-value of less than 0.05 was considered statistically significant.
This article is protected by copyright. All rights reserved.
Accepted Article
Results LG induced mtROS production in ECs To determine whether LG could induce mtROS production, we used the reduced MitoTracker Red CM-H2XRos probe in ECs. The fluorescence intensity of the MitoTracker Red CM-H2XRos probe was significantly increased in ECs cultured with 2.5 mM glucose (149.4% ± 11.5% that of 5.5 mM glucose) compared with that of 5.5 mM glucose. MitoTracker Red CM-H2XRos fluorescence was suppressed with overexpression of MnSOD, a specific SOD targeting mtROS (Figure 1a, b). Additional experiments confirmed that lower glucose levels induced greater MitoTracker Red CM-H2XRos fluorescence in ECs independent of osmotic pressure (Figure 1c, d). In contrast, MnSOD activity and the glutathione-to-glutathione disulfide ratio in ECs did not change under LG conditions (Figure 1e, Table 1). We also investigated the dose-dependent effects of glucose on mtROS generation. The fluorescence intensity of the MitoTracker Red CM-H2XRos probe was significantly increased in ECs cultured with 2.5 mM glucose compared with that of 4.0 mM glucose and was comparable to that of 1.0 mM glucose. In contrast, the MitoTracker Red CM-H2XRos fluorescence of 25 mM glucose was significantly higher than that of 2.5 mM glucose (Figure 1f, g). In addition, we investigated whether fluctuations in glucose levels influenced mtROS generation. The fluorescence intensity of the MitoTracker Red CM-H2XRos probe was significantly increased in ECs cultured with 25 mM glucose for 1 h and 2.5 mM glucose for 1 h compared with that in ECs cultured with 5.5 mM glucose for 1 h and 2.5 mM glucose for 1 h (Figure 1h, i).
This article is protected by copyright. All rights reserved.
Accepted Article
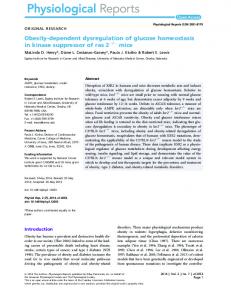
LG stimulation increased fatty acid oxidation in ECs To investigate the mechanism through which LG induces mtROS, metabolomic profiling was performed using capillary electrophoresis-time-of-flight mass spectrometry in ECs treated with either 2.5 or 5.5 mM glucose (Figure 2a). Metabolome analysis revealed that levels of intermediate metabolites in glycolysis, such as fructose 1,6-diphosphate, 3-phosphoglyceric acid, 2-phosphoglyceric acid, phosphoenolpyruvic acid, pyruvic acid, and lactic acid, decreased with 2.5 mM glucose treatment for 1 h compared with that of normal glucose treatment (Table 1). However, treatment of ECs with 2.5 mM glucose did not alter the levels of ATP, GTP, or tricarboxylic acid cycle metabolites, such as citric acid, isocitric acid, and succinic acid. Interestingly, acetyl-CoA levels were not altered with LG stimulation. Acetyl-CoA can be synthesized through fatty acid oxidation (FAO) as well as glycolysis (Figure 2a, Table 1). The levels of metabolic intermediates of glutamine did not change in ECs under LG conditions (Table 1). These results indicate that the pathway from fatty acid to acetyl-CoA via FAO was upregulated in ECs during LG stimulation. To characterize FAO-associated metabolic changes, an extracellular flux analyzer was used to assess the OCR, which mainly reflects mitochondrial oxidative phosphorylation activity. Without palmitic acid, there was no significant difference between the basal OCR under normal glucose conditions and that under LG conditions. In contrast, compared with that in ECs under normal glucose conditions, treatment with 100 μM palmitic acid increased the basal OCR in ECs under LG conditions (189.8 ± 10.4 versus 225.9 ± 9.2 pmol/min, respectively; P < 0.01), suggesting a high rate of FAO under LG conditions (Figure 2b). Carnitine palmitoyltransferase I (CPT1) is the rate-limiting enzyme that transfers long-chain fatty acyl-CoA to the mitochondria for beta-oxidation and is inhibited by unphosphorylated ACC16. When treated with etomoxir, a CPT1 inhibitor, enhancement of the basal OCR in ECs under LG conditions with palmitic acid treatment was reduced to the level
This article is protected by copyright. All rights reserved.
Accepted Article
observed with normal glucose conditions (213.5 ± 6.1 versus 168.6 ± 11.0 pmol/min, respectively; P < 0.01; Figure 2c). Moreover we evaluated the ECAR, which is used as a measure of anaerobic glycolysis as it mainly reflects the production of lactate, under LG conditions. Without palmitic acid, the basal ECAR in ECs under LG conditions decreased compared with that in ECs under normal glucose conditions (8.0 ± 0.9 versus 9.0 ± 1.0 mpH/min, respectively; P < 0.01), suggesting a decrease in glycolytic metabolism to lactate (Figure 2d). In contrast, with palmitic acid, there was no significant difference between the basal ECAR under normal glucose conditions and that under LG conditions. When treated with etomoxir, ECARs in ECs under normal glucose and LG conditions decreased compared with those in ECs that were not treated with etomoxir. However, when treated with palmitic acid and etomoxir, there was no significant difference between the basal ECAR under normal glucose conditions and that under LG conditions (Figure 2e). We next examined the effects of LG conditions on ACC activity. Treatment with LG increased the phosphorylation of ACC at Ser79 after 30 and 60 min of incubation, which indicated the inactivation of ACC (Figure 2e). Therefore, LG stimulation increased the rate of mitochondrial beta-oxidation through inhibition of ACC and activation of CPT1 in ECs. Moreover, we investigated CPT1 expression by western blot analysis and RT-PCR and evaluated the mitophagy status of BAECs. LG conditions had no significant effect on CPT1 expression or mitophagy status compared with normal glucose conditions (Figure S1).
LG increased mtROS generation through activation of FAO To confirm the source of mtROS production during LG stimulation, ECs under LG conditions were supplemented with etomoxir or trimetazidine. When ECs were cultured under normal or high glucose conditions, there were no significant differences in the reduced MitoTracker
This article is protected by copyright. All rights reserved.
Accepted Article
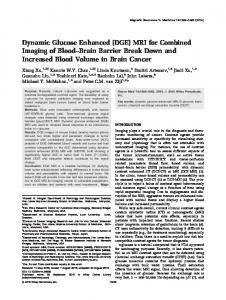
Red CM-H2XRos fluorescence intensities of cells treated with vehicle or etomoxir (Figure 3a, c, d, f, g). In contrast, treatment of cells with LG conditions increased the fluorescence of MitoTracker Red CM-H2XRos, which was completely suppressed by etomoxir (Figure 3b, e, g). In addition, we evaluated the effects of trimetazidine, another pharmacological FAO inhibitor, on LG-induced mtROS generation. Trimetazidine is a competitive inhibitor of 3-ketoacyl CoA thiolase, a key enzyme in beta-oxidation. Trimetazidine suppressed LG induced mtROS generation as with etomoxir (Figure 3h–n). We also evaluated the effects of BPTES, a selective inhibitor of glutaminase. Glutaminase converts glutamine to glutamate and can be further oxidized to α-ketoglutarate to feed the tricarboxylic acid cycle. BPTES had no effect on mtROS production under LG conditions (Figure 3o–s).
LG inhibited eNOS activation and increased the expression of vascular adhesion molecules. To determine whether LG stimulation affected endothelial function, we examined eNOS activation by measuring its phosphorylation at Ser1177. As shown in Figure 4a, LG stimulation inhibited the phosphorylation of eNOS, and this effect was suppressed by MnSOD overexpression or etomoxir treatment. We next examined the expression of the vascular adhesion molecules VCAM-1 and ICAM-1 in ECs. VCAM-1 and ICAM-1 mRNA expression levels were significantly increased by incubation with LG compared with those in cells cultured under normal glucose conditions. In addition, LG-induced mRNA induction was suppressed by MnSOD overexpression or incubation with etomoxir (Figure 4b, c). These results suggested that activated FAO induced by LG stimulation caused endothelial dysfunction.
This article is protected by copyright. All rights reserved.
Accepted Article
Discussion In the present study, we found that LG conditions increased the production of mtROS in ECs. Although downregulation of intermediate metabolites in glycolysis was observed in ECs under LG conditions by metabolome analysis, there were no changes on intracellular acetyl-CoA, ATP, or tricarboxylic acid cycle metabolites, suggesting that other pathways without glycolysis were involved in maintaining the tricarboxylic acid cycle. Additionally, we found that blockade of FAO prevented the increased oxygen consumption rate with palmitic acid stimulation and decreased LG-mediated mtROS production. In general, FAO generates only 5% of the total amount of ATP of ECs under normal glucose conditions17, and many cancer cells increase glucose and glutamine uptake to fuel the tricarboxylic acid cycle18, 19. However, our novel findings suggested that the tricarboxylic acid cycle was maintained by increasing FAO, thereby increasing mtROS production in ECs under LG conditions. Accelerated beta-oxidation of palmitate caused excess electron flux in the mitochondrial respiratory chain, resulting in increased ROS generation in H4IIEC3 hepatocytes20. Taken together, these findings suggested that excess fatty acid oxidation may, at least in part, induce ROS generation in ECs. On the other hand, Nakamura et al reported that palmitate may induce the CPT1 gene expression20, and LG conditions had no significant effect on CPT1 expression in the present study. Therefore the mechanism for increasing FAO under LG conditions remains unclear, and further studies are necessary to determine this mechanism. Acute infusion of free fatty acids (FFAs) induces oxidative stress and reduces endothelium-dependent vasodilation in humans in vivo21. Moreover, treatment with FFAs impairs endothelial function by several mechanisms, including increased production of ROS, stimulation of pro-inflammatory signaling, and reduction of eNOS activity and nitric oxide (NO) production22–24. Furthermore, overexpression of uncoupling protein-2, an important regulator of intracellular ROS production, improves the endothelial dysfunction induced by This article is protected by copyright. All rights reserved.
Accepted Article
ROS-mediated FFA toxicity25. Therefore, accumulation of FFAs may mediate endothelial dysfunction under hypoglycemic condition. Hypoglycemia, mediated by intensive glucose-lowering interventions, is a common side effect in patients with diabetes and may increase the risk of poor outcomes26,
27
.
Additionally, ECs play important roles not only as vessel barriers but also in the regulation of vascular tone, coagulation, leukocyte adhesion, and vascular permeability. Vascular tone is modulated by various factors, such as NO. The earliest and most important factor mediating endothelial dysfunction is a reduction in NO bioactivity, which is mediated by ROS. Therefore, ROS generation in vascular cells plays a key role in endothelial dysfunction and subsequent atherosclerotic lesion formation23. Moreover, hypoglycemia induces endothelial dysfunction through the production of several inflammatory factors, including VCAM-1, ICAM-1, vascular endothelial growth factor, interleukin (IL)-8, IL-6, endothelin-1, and tumor necrosis factor-alpha, resulting in increased risk of diabetic macro-angiopathy11,
28-30
. In
particular, Jin et al reported that hypoglycemia increases serum adrenaline and levels of adhesion molecules, such as VCAM-1 and ICAM-1, in the endothelium of the rat aorta31. In addition, increased ROS also activates nuclear factor-κB, which mediates the overexpression of adhesion molecules, such as VCAM-1, ICAM-1, and E-selectin32. In the present study, we observed that LG stimulation decreased the bioavailability of NO and increased the expression of VCAM-1 and ICAM-1 in ECs. Moreover, blockade of FAO or suppression of mtROS ameliorated the LG-induced bioavailability of NO and expression of VCAM-1 and ICAM-1. These results suggested that hypoglycemia-induced reduction of NO bioactivity and overproduction of VCAM-1 and ICAM-1 mRNA were mediated by the overproduction of mtROS and activation of FAO in ECs. Our findings may have implications in both diabetic macro-angiopathy and diabetic micro-angiopathy. In fact, our preliminary data showed that etomoxir decreased ROS
This article is protected by copyright. All rights reserved.
Accepted Article
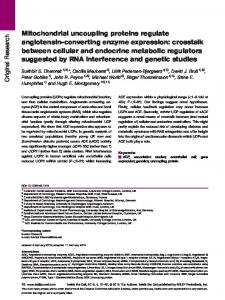
generation and prevented vascular permeability caused by recurrent hypoglycemia in the retinas of diabetic mice (unpublished data). Interestingly, Schoors et al reported that etomoxir also reduces pathological angiogenesis in a model of oxygen-induced retinopathy33. We therefore speculate that mtROS and FAO may be involved in the progression of microvascular complications caused by recurrent hypoglycemia. Our analysis was limited by the fact that we did not examine whether LG induced ROS generation and whether ROS-mediated endothelial dysfunction was inhibited by blockade of FAO in animal models. Therefore, further studies are needed to evaluate the association of hypoglycemia and diabetic complications in vivo. Moreover, ketone bodies play an important role as alternative energy sources to neurons during hypoglycemia34. Rains et al reported that hyperketonemia increases monocyte adhesion to ECs35. Based on these previous reports, additional studies are also needed to investigate the effects of ketone bodies on ECs during hypoglycemia in vivo. Such studies are necessary to determine whether arteriosclerosis progression due to monocyte adhesion or macrophage infiltration is mediated by enhancement of fatty acid metabolism in the context of recurrent hypoglycemia in diabetic mice in vivo. In conclusion, we demonstrated that LG conditions exacerbated mtROS production through activation of FAO in ECs (Figure 5). In addition, we revealed that blockade of FAO suppressed LG-mediated mtROS production and ameliorated LG-induced endothelial dysfunction. Collectively, our findings suggested that inhibition of FAO and subsequent suppression of mtROS generation could be novel therapeutic approaches for prevention of endothelial dysfunction and diabetic macrovascular complications under hypoglycemic conditions.
This article is protected by copyright. All rights reserved.
Accepted Article
Acknowledgments This work was supported by a Grant-in-Aid for Scientific Research from the Japan Society for the Promotion of Science, Japan (grant nos. 15K09393 to D.K. and 26461340 to T.N.).We thank Professor Shokei Kim-Mitsuyama (Department of Pharmacology and Molecular Therapeutics, Graduate School of Medical Sciences, Faculty of Life Sciences, Kumamoto University) and Professor Motohiro Takeya (Department of Cell Pathology, Graduate School of Medical Sciences, Faculty of Life Sciences, Kumamoto University) for helpful discussions.
Disclosure The authors declare that they have no conflicts of interest.
References 1.
Panth N, Paudel KR, Parajuli K. Reactive oxygen species: a key hallmark of cardiovascular disease. Adv Med 2016; 2016: 9152732.
2.
Ceriello A, Testa R, Genovese S. Clinical implications of oxidative stress and potential role of natural antioxidants in diabetic vascular complications. Nutr Metab Cardiovasc Dis 2016; 26: 285–292.
3.
Schalkwijk CG, Stehouwer CD. Vascular complications in diabetes mellitus: the role of endothelial dysfunction. Clin Sci (Lond) 2005; 109: 143–159.
4.
Sheetz MJ, King GL. Molecular understanding of hyperglycemia's adverse effects for diabetic complications. JAMA 2002; 288: 2579–2588.
5.
The Diabetes Control and Complications Trial Research Group. The relationship of glycemic exposure (HbA1c) to the risk of development and progression of retinopathy in the diabetes control and complications trial. Diabetes 1995; 44: 968–983.
This article is protected by copyright. All rights reserved.
Accepted Article
6.
UK Prospective Diabetes Study (UKPDS) Group. Intensive blood-glucose control with sulphonylureas or insulin compared with conventional treatment and risk of complications in patients with type 2 diabetes (UKPDS 33). Lancet 1998; 352: 837–853.
7.
Ohkubo Y, Kishikawa H, Araki E, et al. Intensive insulin therapy prevents the progression of diabetic microvascular complications in Japanese patients with non-insulin-dependent diabetes mellitus: a randomized prospective 6-year study. Diabetes Res Clin Pract 1995; 28: 103–117.
8.
Nishikawa T, Edelstein D, Du XL, et al. Normalizing mitochondrial superoxide production blocks three pathways of hyperglycaemic damage. Nature 2000; 404: 787–790.
9.
Skyler JS, Bergenstal R, Bonow RO, et al; American Diabetes Association.; American College of Cardiology Foundation.; American Heart Association. Intensive glycemic control and the prevention of cardiovascular events: implications of the ACCORD, ADVANCE, and VA Diabetes Trials: a position statement of the American Diabetes Association and a Scientific Statement of the American College of Cardiology Foundation and the American Heart Association. J Am Coll Cardiol 2009; 53: 298–304.
10.
Zoungas S, Patel A, Chalmers J, et al; ADVANCE Collaborative Group. Severe hypoglycemia and risks of vascular events and death. N Engl J Med 2010; 363: 1410–1418.
11.
Desouza CV, Bolli GB, Fonseca V. Hypoglycemia, diabetes, and cardiovascular events. Diabetes Care 2010; 33: 1389–1394.
12.
Ceriello A, Novials A, Ortega E, et al. Evidence that hyperglycemia after recovery from hypoglycemia worsens endothelial function and increases oxidative stress and inflammation in healthy control subjects and subjects with type 1 diabetes. Diabetes
This article is protected by copyright. All rights reserved.
Accepted Article
2012; 61: 2993–2997. 13.
Cardoso S, Santos RX, Correia SC, et al. Insulin-induced recurrent hypoglycemia exacerbates diabetic brain mitochondrial dysfunction and oxidative imbalance. Neurobiol Dis 2013; 49: 1–12.
14.
Kukidome D, Nishikawa T, Sonoda K, et al. Activation of AMP-activated protein kinase reduces hyperglycemia-induced mitochondrial reactive oxygen species production and promotes mitochondrial biogenesis in human umbilical vein endothelial cells. Diabetes 2006; 55: 120–127.
15.
Esposti MD, Hatzinisiriou I, McLennan H, et al. Bcl-2 and mitochondrial oxygen radicals. New approaches with reactive oxygen species-sensitive probes. J Biol Chem 1999; 274: 29831–29837.
16.
Saha AK, Ruderman NB. Malonyl-CoA and AMP-activated protein kinase: an expanding partnership. Mol Cell Biochem 2003; 253: 65–70.
17.
De Bock K, Georgiadou M, Schoors S, et al. Role of PFKFB3-driven glycolysis in vessel sprouting. Cell 2013; 154: 651–663.
18.
Vander Heiden MG. Exploiting tumor metabolism: challenges for clinical translation. J Clin Invest 2013; 123: 3648–3651.
19.
DeBerardinis RJ, Mancuso A, Daikhin E, et al. Beyond aerobic glycolysis: transformed cells can engage in glutamine metabolism that exceeds the requirement for protein and nucleotide synthesis. Proc Natl Acad Sci U S A 2007; 104: 19345–19350.
20.
Nakamura S, Takamura T, Matsuzawa-Nagata N, et al. Palmitate induces insulin resistance in H4IIEC3 hepatocytes through reactive oxygen species produced by mitochondria. J Biol Chem 2009; 284: 14809–14818.
21.
Tripathy D, Mohanty P, Dhindsa S, et al. Elevation of free fatty acids induces inflammation and impairs vascular reactivity in healthy subjects. Diabetes 2003; 52:
This article is protected by copyright. All rights reserved.
Accepted Article
2882–2887. 22.
Brownlee M. The pathobiology of diabetic complications: a unifying mechanism. Diabetes 2005; 54: 1615–1625.
23.
Potenza MA, Gagliardi S, Nacci C, et al. Endothelial dysfunction in diabetes: from mechanisms to therapeutic targets. Curr Med Chem 2009; 16: 94–112.
24.
Wang XL, Zhang L, Youker K, et al. Free fatty acids inhibit insulin signaling-stimulated endothelial nitric oxide synthase activation through upregulating PTEN or inhibiting Akt kinase. Diabetes 2006; 55: 2301–2310.
25.
Lee KU, Lee IK, Han J, et al. Effects of recombinant adenovirus-mediated uncoupling protein 2 overexpression on endothelial function and apoptosis. Circ Res 2005; 96: 1200–1207.
26.
Action to Control Cardiovascular Risk in Diabetes Study Group., Gerstein HC, Miller ME, Byington RP, et al. Effects of intensive glucose lowering in type 2 diabetes. N Engl J Med 2008; 358: 2545–2559.
27.
Duckworth W, Abraira C, Moritz T, et al; VADT Investigators. Glucose control and vascular complications in veterans with type 2 diabetes. N Engl J Med 2009; 360: 129–139.
28.
Sommerfield AJ, Wilkinson IB, Webb DJ, et al. Vessel wall stiffness in type 1 diabetes and the central hemodynamic effects of acute hypoglycemia. Am J Physiol Endocrinol Metab 2007; 293: E1274–E1279.
29.
Fisman EZ, Motro M, Tenenbaum A, et al. Is hypoglycaemia a marker for increased long-term mortality risk in patients with coronary artery disease? An 8-year follow-up. Eur J Cardiovasc Prev Rehabil 2004; 11: 135–143.
30.
Joy NG, Tate DB, Younk LM, et al. Effects of acute and antecedent hypoglycemia on endothelial function and markers of atherothrombotic balance in healthy humans.
This article is protected by copyright. All rights reserved.
Accepted Article
Diabetes 2015; 64: 2571–2580. 31.
Jin WL, Azuma K, Mita T, et al. Repetitive hypoglycaemia increases serum adrenaline and induces monocyte adhesion to the endothelium in rat thoracic aorta. Diabetologia 2011; 54: 1921–1929.
32.
Kim SR, Bae YH, Bae SK, et al. Visfatin enhances ICAM-1 and VCAM-1 expression through ROS-dependent NF-kappaB activation in endothelial cells. Biochim Biophys Acta 2008; 1783: 886–895.
33.
Schoors S, Bruning U, Missiaen R, et al. Fatty acid carbon is essential for dNTP synthesis in endothelial cells. Nature 2015; 520: 192–197.
34.
Amaral AI. Effects of hypoglycaemia on neuronal metabolism in the adult brain: role of alternative substrates to glucose. J Inherit Metab Dis 2013; 36: 621–634.
35.
Rains JL, Jain SK. Hyperketonemia increases monocyte adhesion to endothelial cells and is mediated by LFA-1 expression in monocytes and ICAM-1 expression in endothelial cells. Am J Physiol Endocrinol Metab 2011; 301: E298–306.
Supporting information Figure S1; CPT1 expression and the mitophagy status of bovine aortic endothelial cells under low glucose conditions
Figure Legends Figure 1 Low glucose induced mitochondrial reactive oxygen species (mtROS) production (a) mtROS production in bovine aortic endothelial cells (BAECs) and effects of manganese superoxide
dismutase
(MnSOD)
overexpression
on
mtROS
production.
BAECs
overexpressing MnSOD (lower panel) or control adenovirus (upper panel) were incubated under the indicated conditions for 1 h and treated with 300 nM MitoTracker Red CM-H2XRos (red) for 30 min. Scale bars represent 30 µm. (b) The relative fluorescence This article is protected by copyright. All rights reserved.
Accepted Article
intensity of MitoTracker Red CM-H2XRos was measured. Control Adeno, control adenovirus; MnSOD Adeno, MnSOD adenovirus. Data are four independent experiments performed in duplicate (means ± SDs). ** P < 0.01 compared with 5.5 mM glucose and control adenovirus; ## P < 0.01 compared with 2.5 mM glucose and control adenovirus. White bars = 5.5 mM glucose; black bars = 2.5 mM glucose; gray bars = 25 mM glucose. (c) Effects of osmotic pressure on mtROS generation under low glucose conditions. BAECs were incubated under the indicated conditions for 1 h and treated with 300 nM MitoTracker Red CM-H2XRos (red) for 30 min. Scale bars represent 30 µm. (d) The relative fluorescence intensity of the MitoTracker Red CM-H2XRos probe was measured. Data are four independent experiments performed in duplicate (means ± SDs). ** P < 0.01 compared with 5.5 mM glucose. (e) Manganese superoxide dismutase (MnSOD) activity in BAECs. BAECs were incubated under the indicated conditions for 1 h. MnSOD activity was measured using a SOD assay kit-WST. Data are means ± SDs (n = 5/group). (f, h) The mtROS production in bovine aortic endothelial cells (BAECs) and the effects of dose-dependent glucose levels (f) or the fluctuation of glucose levels (h) on mtROS production. BAECs were incubated under the indicated conditions and treated with 300 nM MitoTracker Red CM-H2XRos (red) for 30 min. Scale bars represent 30 µm. (g, i) The relative fluorescence intensity of MitoTracker Red CM-H2XRos was measured. Data are four independent experiments performed in duplicate (means ± SDs). ** P < 0.01 compared with 5.5 mM glucose; ## P < 0.01 compared with 2.5 mM glucose.
Figure 2 Low glucose increased fatty acid oxidation in endothelial cells (a) Metabolome analysis. Intracellular concentrations (pmol/million cells) of key metabolites involved in glycolysis are shown. Error bars indicate SDs (n = 3/group). Total metabolites were extracted with methanol from bovine aortic endothelial cells (BAECs) with 5.5 mM
This article is protected by copyright. All rights reserved.
Accepted Article
glucose (white) or 2.5 mM glucose (black) for 1 h. * P < 0.05, ** P < 0.01 versus 5.5 mM glucose.
G6P,
glucose
6-phosphate;
F6P,
fructose
6-phosphate;
F1,6P,
fructose
1,6-diphosphate; 3-PG, 3-phosphoglyceric acid; 2-PG, 2-phosphoglyceric acid; PEP, phosphoenolpyruvic acid; 2-OG, 2-oxoglutaric acid. (b) Basal oxygen consumption rates (OCRs) of BAECs treated with palmitic acid (100 μM) or left untreated. BAECs were incubated under the indicated conditions for 1 h. (c) Basal OCRs of BAECs treated with palmitic acid in the presence of DMSO control or etomoxir (100 μM). (d) Basal extracellular acidification rates (ECARs) of BAECs treated with palmitic acid (100 μM) or left untreated. BAECs were incubated under the indicated conditions for 1 h. (e) Basal ECARs of BAECs treated with palmitic acid in the presence of DMSO control or etomoxir (100 μM). White bars = 5.5 mM glucose; black bars = 2.5 mM glucose. Data are means ± SDs (n = 3–4/group). ** P < 0.01. (f) Representative images of protein expression determined by western blotting of BAECs cultured under the indicated conditions for 1 h. ACC, acetyl CoA carboxylase; pACC, phosphorylated ACC.
Figure 3 Low glucose increased mtROS generation using fatty acid oxidation (a–f) Effects of etomoxir (100 µM) on mtROS generation under low glucose conditions. Cells were incubated under the indicated conditions. Scale bars represent 30 µm. (g) The relative fluorescence intensity of the MitoTracker Red CM-H2XRos probe was measured. (h–m) Effects of trimetazidine (50 µM) on mtROS generation under low glucose conditions. Cells were incubated under the indicated conditions. Scale bars represent 30 µm. (n) The relative fluorescence intensity of the MitoTracker Red CM-H2XRos probe was measured. (o–r) Effects of BPTES (10 µM), a selective inhibitor of glutaminase, on mtROS generation under low glucose conditions. Cells were incubated under the indicated conditions. Scale bars represent 30 µm. (s) The relative fluorescence intensity of the MitoTracker Red CM-H2XRos
This article is protected by copyright. All rights reserved.
Accepted Article
probe was measured. White bars = 5.5 mM glucose; black bars = 2.5 mM glucose; gray bars = 25 mM glucose. Data are four independent experiments performed in duplicate (means ± SDs). * P < 0.05, ** P < 0.01 compared with 5.5 mM glucose; # P < 0.05, ## P < 0.01 compared with 2.5 mM glucose; †† P < 0.01 compared with 25 mM glucose.
Figure 4 Etomoxir and MnSOD overexpression ameliorated the endothelial dysfunction induced by low glucose (a) Representative images of protein expression determined by western blotting in BAECs under the indicated conditions for 1 h. eNOS, endothelial nitric oxide synthase; p-eNOS, phosphorylated eNOS (Ser1177). (b, c) Effects of etomoxir and MnSOD overexpression on VCAM-1 (b) and ICAM-1 (c) mRNA expression. Cells were incubated under the indicated conditions for 1 h. The expression levels of VCAM-1 and ICAM-1 mRNA were measured by quantitative RT-PCR analysis. Control Adeno, control adenovirus; MnSOD Adeno, MnSOD adenovirus. White bars = 5.5 mM glucose; black bars = 2.5 mM glucose. Data are six independent experiments performed in duplicate (means ± SDs). ** P < 0.01 compared with 5.5 mM glucose and control adenovirus; # P < 0.05, ## P < 0.01 compared with 2.5 mM glucose and control adenovirus.
Figure 5 Schematic model of the proposed mechanisms of mtROS induction by low glucose conditions Low glucose conditions increased mtROS generation through fatty acid oxidation in ECs. Low glucose-induced mtROS inhibited the phosphorylation of eNOS and increased the expression of VCAM-1 or ICAM-1. CTP1, carnitine palmitoyltransferase I; ROS, reactive oxygen species.
This article is protected by copyright. All rights reserved.
Accepted Article
Supplementary Figure Legends Figure S1 CPT1 expression and the mitophagy status of bovine aortic endothelial cells under low glucose conditions (a, b) Representative images of protein expression determined by western blotting of bovine aortic endothelial cells (BAECs) cultured under the indicated conditions for 1 h. CPT1A, carnitine palmitoyltransferase IA; CPT1B, carnitine palmitoyltransferase IB. (c) Effects of low glucose conditions on CPT1B mRNA expression. Cells were incubated under the indicated conditions for 1 h. The expression levels of CPT1B mRNA were measured by quantitative RT-PCR analysis. Data are six independent experiments performed in duplicate (means ± SDs). (d) The mitophagy status of BAECs. BAECs were incubated under the indicated conditions for 1 h. Mitophagy status was evaluated using a Mitophagy Detection Kit. Mitophagy signal (red), lysosome signal (green). CCCP, carbonyl cyanide 3-chlorophenylhydrazone. Scale bars represent 30 µm.
This article is protected by copyright. All rights reserved.
Accepted Article
Table 1. Metabolites examined during metabolome analysis 5.5 mM glucose
2.5 mM glucose
P value
Glucose 6-phosphate
39.3 ± 8.0
31.1 ± 20.9
0.58
Fructose 6-phosphate
10.7 ± 1.4
10.3 ± 5.4
0.92
158.2 ± 18.5
120.8 ± 15.8
0.06
3-Phosphoglyceric acid
70.4 ± 4.8
46.1 ± 9.3
0.03
2-Phosphoglyceric acid
7.0 ± 0.6
4.9 ± 0.8
0.03
20.6 ± 3.6
9.5 ± 4.7
0.03
286.8 ± 23.0
242.3 ± 18.4
0.06
Lactic acid
2344.3 ± 223.9
1263.7 ± 144.6
< 0.01
Acetyl CoA
0.24 ± 0.03
0.30 ± 0.07
0.23
753.5 ± 50.7
809.1 ± 42.5
0.22
cis-Aconitic acid
12.0 ± 1.1
13.2 ± 1.3
0.28
Isocitric acid
14.2 ± 3.4
15.6 ± 2.2
0.58
2-Oxoglutaric acid
715.9 ± 25.3
786.5 ± 87.2
0.29
Succinic acid
144.9 ± 4.4
198.3 ± 38.3
0.14
Fumaric acid
462.6 ± 35.0
447.3 ± 14.5
0.54
Malic acid
1967.1 ± 59.6
1838.9 ± 84.9
0.11
ATP
5386.2 ± 140.3
5635.0 ± 266.4
0.25
GTP
1185.1 ± 24.2
1204.8 ± 59.9
0.64
48806.0 ± 680.1
51153.4 ± 1815.9
0.14
Glutathione (GSSG)
2257.7 ± 217.2
2493.4 ± 170.6
0.22
Glutathione (GSH)
1860.5 ± 248.0
1644.0 ± 184.2
0.30
Fructose 1,6-diphosphate
Phosphoenolpyruvic acid Pyruvic acid
Citric acid
Glutamate
Data are means ± SDs (n = 3/group).
This article is protected by copyright. All rights reserved.
Accepted Article This article is protected by copyright. All rights reserved.
Accepted Article
Accepted Article This article is protected by copyright. All rights reserved.
Accepted Article This article is protected by copyright. All rights reserved.
Accepted Article