David J. Darkow, William P. Marshak, George S. Woodworth, Michael D. ..... E. 3. 10. 8- o o o. First Identification Distribution o o o. CM co o o o co. CO o o o. CO ...... OHR c as. « ^ o a-3 o. â¡3 -I 1. U " I. J â f-. U JJ ^. 0 c = *J O I. O "3 I. i a. Cl I u.
AFRL-HE-WP-TR-1998-0056
UNITED STATES AIR FORCE RESEARCH LABORATORY LOW-LEVEL COGNITIVE MODELING OF AIRCREW FUNCTION USING THE SOAR ARTIFICIAL INTELLIGENCE ARCHITECTURE
David J. Darkow William P. Marshak SYTRONICS, INC. 4433 DAYTON-XENIA ROAD BUILDING 1 DAYTON OH 45432
George S. Woodworth Michael McNeese HUMAN EFFECTIVENESS DIRECTORATE CREW SYSTEM INTERFACE DIVISION WRIGHT-PATTERSON AFB OH 45433-7022
APRIL 1998
FINAL REPORT FOR THE PERIOD 1 MARCH 1997 T01 OCTOBER 1997
19990318 046 Approved for public release; distribution is unlimited. Human Effectiveness Directorate Crew System Interface Division Wright-Patterson AFB OH 45433-7022 Mm f ÖÄLITY INSPECTED 4
NOTICES When US Government drawings, specifications, or other data are used for any purpose other than a definitely related Government procurement operation, the Government thereby incurs no responsibility nor any obligation whatsoever, and the fact that the Government may have formulated, furnished, or in any way supplied the said drawings, specifications, or other data, is not to be regarded by implication or otherwise, as in any manner licensing the holder or any other person or corporation, or conveying any rights or permission to manufacture, use, or sell any patented invention that may in any way be related thereto. Please do not request copies of this report from the Air Force Research Laboratory. Additional copies may be purchased from: National Technical Information Service 5285 Port Royal Road Springfield, Virginia 22161 Federal Government agencies registered with the Defense Technical Information Center should direct requests for copies of this report to: Defense Technical Information Center 8725 John J. Kingman Road, Suite 0944 Ft. Belvoir, Virginia 22060-6218
TECHNICAL REVIEW AND APPROVAL AFRL-HE-WP-TR-1998-0056 This report has been reviewed by the Office of Public Affairs (PA) and is releasable to the National Technical Information Service (NTIS). At NTIS, it will be available to the general public, including foreign nations. This technical report has been reviewed and is approved for publication. FOR THE COMMANDER
dtMi
HENDRICK W. RUCK, PhD Chief, Crew System Interface Division Air Force Research Laboratory
Form Approved OMB No. 0704-0188
REPORT DOCUMENTATION PAGE
Public reporting burden for this collection of information is estimated to average 1 hour per response, including the time for reviewing the collection of information. Send comments regarding this burden estimate or any other aspect of this collection of information, including suggestions for reducing this burden, to Washington Headquarters Services, Directorate for Information Operations and Reports, 1215 Jefferson Davis Highway, Suite 1204, Arlington, VA 22202-4302, and to the Office of Management and Budget, Paperwork Reduction Project (0704-0188), Washington, DC 20503.
1. AGENCY USE ONLY (Leave Blank)
REPORT DATE
REPORT TYPE AND DATES COVERED
Final Report (1 March 1997 -1 October 1997)
April 1998
FUNDING NUMBERS
4. TITLE AND SUBTITLE
Low-Level Cognitive Modeling of Aircrew Function Using The Soar Artificial Intelligence Architecture 6. AUTHOR(S)
c PE PR TA WU
DAAL01-96-: 63231F 2829
01 11
David J. Darkow, William P. Marshak, George S. Woodworth, Michael D. McNeese 8. PERFORMING ORGANIZATION REPORT NUMBER
7. PERFORMING ORGANIZATION NAME(S) AND ADDRESS(ES)
SYTRONICS, Inc. 4433 Dayton-Xenia Road; Bldg 1 Dayton OH 45432-1949 . SPONSORING/MONITORING AGENCY NAME(S) AND ADDRESS(ES)
Air Force Research Laboratory, Crew System Interface Div Air Force Materiel Command Wright-Patterson AFB OH 45433-7022
10. SPONSORING/MONITORING AGENCY REPORT NUMBER
AFRL-HE-WP-TR-1998-0056
11. SUPPLEMENTARY NOTES
12b. DISTRIBUTION CODE
12a. DISTRIBUnON/AVAILABILnY STATEMENT
Approved for public release; distribution unlimited 13. ABSTRACT (Maximum 200 words) Pilot vehicle interface (PVI) testing usually requires extensive human-in-the-loop (HITL) simulation. An alternative to HITL testing is to model human computer interaction with an automated cognitive engineering tool. This study used Soar cognitive modeling to compare the effectiveness of an existing and proposed PVI for air-to-ground Maverick missile missions. The baseline interface used a Forward-Looking Infrared Radar (FLIR) to detect and designate targets. The improved PVI had an enhanced FLIR and added Real-Time Information in the Cockpit (RTIC) with annotated overhead imagery of the target area. The Soar software architecture was chosen to model pilot cognition, although target acquisition was more dependent on the pilot's visual and motor functions than cognition. The Soar model accurately predicated faster target acquisition for the RTIC PVI and faster target acquisition for reduced scene complexity. Although not statistically significant, the Soar model correctly indicated that increased scene complexity caused larger increases in target acquisition time for the RTIC PVI condition as compared to the baseline condition (HITL 179% increase, Soar 47% increase). Furthermore, Soar was the only model that accurately predicted increased latency in the RTIC condition while both Cognitive and Traditional Task Analyses predicted decreased latencies.
14. SUBJECT TERMS
IS. NUMBER OF PAGES
Cognitive Modeling, Soar, Human Factors, Human Performance Modeling
16. PRICE CODE
109
17. SECURITY CLASSIFICATION OF REPORT
UNCLASSIFIED NSN 7540-01-280-5500
18. SECURITY CLASSIFICATION OF THIS PAGE
UNCLASSIFIED
19. SECURITY CLASSIFICATION OF ABSTRACT
UNCLASSIFIED
20. LIMITATION OF ABSTRACT UNLIMITED Standard Form 298 (Rev 2-89) Prescribed by ANSI Std 239-18
ABSTRACT Automated testing is an engineering tool used to test designs by exposing them to a variety of conditions and combination of conditions in an efficient manner. While guidelines exist for designing human computer interfaces (HCIs) or in the special case of aviation, the pilot vehicle interface (PVI), testing these interfaces usually requires extensive human-in-the-loop (HITL) testing. An alternative to HITL testing is to model human computer interaction in software and employ the model as an automated cognitive engineering tool for testing HCI/PVI design for the purpose of understanding the impacts on human performance and mission effectiveness. The present study used computer simulation to compare the effectiveness of an existing and proposed PVI for air-to-ground strike missions employing the Maverick missile.
The baseline interface involved using Forward-Looking Infrared Radar
(FUR) to detect and designate targets. The improved PVI enhanced FLIR contrast and added Real-Time Information in the Cockpit (RTIC) overhead imagery of the target area with targets marked. These PVIs had been previously tested by HITL simulations and several software models. Keeping this effort blind to the results of the previous efforts, the Air Force only provided task analyses and measures used in the earlier efforts so comparisons could be made. The Soar software architecture was chosen to model pilot cognition because of its human-like cognitive capabilities. As it turned out, target acquisition for this particular mission scenario was more dependent on the parameters chosen for the pilot's visual and motor functions than cognitive processing.
However, the Soar results pre-
sented here were comparable to HITL data and the other cognitive modeling simulations. Even though the visual and motor parameters chosen for the Soar model had limited correlation to the HITL data, the Soar model did accurately predict faster target acquisition for the RTIC PVI and faster target acquisition for sparser scene density. Although not statistically significant, the Soar model correctly indicated that increased scene complexity would have a greater increase on target acquisition for the RTIC PVI condition as compared to the baseline condition (HITL 179% increase, Soar 47% increase). However, the previous models failed to indicate the increased target acquisi-
m
tion times for increased scene complexity for the RTIC condition when compared to the baseline condition (Cognitive Task Analysis (CTA) 105% decrease, Traditional Task Analysis (TTA) 124% decrease).
IV
ACKNOWLEDGMENTS Completion of this project would not have been possible without the cooperation of several individuals. Mr. David Hoagland, an engineer at the Air Force Research Laboratory, provided management assistance through the Crew-Centered Cockpit Design Technology (CCDT) Program Office. Mr. Tom Hughes of Veda Inc., provided data from the previously run simulations for comparison. Ms. Holly Bautsch of Logicon Technical Services provided valuable insights and a partial copy of her Masters thesis which was based on some of the previously run simulations. Dr. John Laird of the University of Michigan provided suggestions about Soar, its operations, and how it could be manipulated to create cognitive behaviors during an air-to-ground strike mission. SYTRONICS' President, Barry Myers, encouraged this project as it was coincident with his company goal of creating leading-edge research. We would also like to thank all the other SYTRONICS employees who assisted in this work; Vince Schmidt and Brian Cooper for their technical assistance and Becky Rogers and Debbie Winner for assistance in preparing this document. This work was done for the Air Force using a contractual agreement with the CCDT under a U.S. Army Research Laboratory Federated Laboratory Cooperative Agreement DAAL01-96-2-0003. We wish to express our appreciation to Mr. Bernie Corona, Agreement Manager, who made this work possible through the Army fiscal instrument.
TABLE OF CONTENTS TITLE
PAGE NO.
List of Illustrations List of Tables Introduction Architecture Selection Background Simulation Design and Methods Summary of Requirements Mission Soar Behaviors Visual Model Motor Model Randomization Program Description Results Analysis of Soar Model Comparison of Soar Simulation Results to HITL, TTA, and CTA Simulations Discussion Choosing Tasks Suitable for Cognitive Modeling Enhancing Soar's Similarity to Human Cognition Making Comparisons Among Competing Cognitive Models Comparison of Cognitive Models to Human Performance Recommendations Appendices 1.1 Final Data 1.2 Complete Set of Pixelated Views of KC-10 and B-52 1.3 Selected Text Output from Baseline Condition 1.4 Selected Text Output from Baseline RTIC Condition 1.5 Snapshot of a ModSAF Screen of a Plane Firing on Targets 1.6 ANOVA Results 1.7 Soar Source Code
vii viii 1 2 4 6 6 ...6 11 11 16 17 17 18 18
References
101
VI
24 32 32 35 37 38 39 41 42 51 64 66 68 70 84
LIST OF ILLUSTRATIONS FIGURE
TITLE
1. 2. 3. 4.
ModSAF Aerial View of Ground Attack Mission 8 Flowchart of Baseline Behaviors 9 Flowchart of RTIC Behaviors 10 Diagram of WFOV Angels and Pixels Used to Calculate Slant-Range Detection Limit 12 Estimation of an Aircraft's Length in Pixels vs Range for WFOV and NFOV FLIRs 12 One Recognition Test Plate for KC-10 Viewed 60° Off-Axis from the Nose View 13 Ability of Novice Human Subjects to Discrimination Between KC-10s and B-52s Based Upon Pixel Density 14 First Detection Distribution for RTIC Condition 15 First Identification Distribution for the Baseline Condition 15 Airfield Area (from Holly Bautsch, 1997 pg. 27) 19 Summary of Soar Simulation Times for Different Scene Complexities and Different PVIs 22 Summary of Soar Simulation Performance Measurements for Different Scene Complexities and Different PVIs 22 Distribution of Launch Ranges for Soar Model of Baseline Configuration 23 Distribution of Launch Ranges for Soar Model of RTIC Configuration i 24 Comparison of HITL First Lock Times to Soar, TTA, and CTA Base Simulations 25 Comparison of HITL Second Lock Times to Soar, TTA, and CTA Base Simulations 28 The Effect of Presentation Order on HITL RTIC Performance ...28 Comparison of HITL Launch Times to Soar, TTA, and CTA Base Simulations 30 Comparison of HITL Launch Ranges to Soar, TTA, and CTA Base Simulations 31
5. 6. 7. 8. 9. 10. 11. 12. 13. 14. 15. 16. 17. 18. 19.
PAGE NO.
vu
LIST OF TABLES TABLE
TITLE
1.
The Associative Mapping Between Soar Supplied RTIC Information and Plane Layout Sou reed at the ModSAF Parser Summary of Simulated Motor Activity and Corresponding Programmed Delay Arrangement of Independent Measures Used in Prior Efforts and the Soar Model Data Summary of Soar HITL, TTA, and CTA Data Differential Comparison of Second Lock Times Scene Complexity Average Differences for Second Lock Times Performance Measurements
2. 3. 4. 5. 6. 7.
PAGE NO.
vm
16 17 20 26 29 29 32
INTRODUCTION A growing number of accidents and incidents can be directly or indirectly attributed to mental errors made by human system operators (O'Hare, Wiggins, Batt, and Morrison, 1994). These errors are particularly disturbing to the engineers who build these systems because the hardware and software all worked as intended, but the result was still tragic failure. Clearly, there is a pressing need to be able to predict the circumstances leading to and ultimately diminishing the possibility of such mental errors. One approach to predicting such errors is to perform high-fidelity, HITL simulations and observe where cognitive breakdowns appear. Unfortunately, there are drawbacks to this approach which make thorough testing impractical. The combination of high-fidelity simulation costs, limits in skilled operator availability, behavior differences between simulation and real flying, and the limitless combinations of events capable of triggering cataclysmic accidents make thorough HITL testing impractical. An alternative approach to HITL testing is to model the operator's cognitive performance, subject the model to the broadest range of possible circumstances, and record where the cognitive failures occur. This is analogous to automated testing which is already extensively used by engineers to increase product reliability. Although modeling human cognition is a fledgling science, modeling methods do exist, such as ACT* and Soar, which can serve as the basis for automated testing. Cognitive automated testing of user interfaces has both advantages and disadvantages. On the down side, automated cognitive testing lacks the face validity of HITL and the quality of the outcome is dependent on the quality and scope of the model. However, such testing can investigate large numbers of circumstances, especially unusual circumstances, at a lower cost and in less time. Furthermore, models can be readily changed and adapted as additional information and test runs become available. This kind of modeling could be used to predict which unusual circumstances cause these low frequency mental errors. Cognitive modeling could become a primary tool for designing and evaluating user interfaces, and potentially decrease the occurrence of metal errors.
Architecture Selection Marshak, Pohlenz (now Wesler), and Smith (1996) considered how cognitive modeling could be employed in the crewstation design process and speculated on how best to implement such a model for Armstrong Laboratory's CCDT Program. A survey covered the existing cognitive modeling literature and identified the bases for a predictive aircrew cognitive model. The literature revealed two leading candidates in which to implement the cognitive model.
The first is Anderson's ACT* (1983) architecture
(current version ACT-R) which grew out of cognitive psychological theory; and Laird, Rosenblum, and Newell's (1985) State, Operator, and Result (Soar) architecture based on an artificial intelligence architecture which mimics human performance. The following explanation borrows heavily from Marshak, et al. (1996). Anderson's (1983) ACT* model for cognition tries to provide a comprehensive explanation for high-level cognitive control behavior. There are three distinct memory structures in Anderson's model: working, declarative, and production. Working memory (WM) holds relevant information from declarative memory, sensory inputs, and the actions of productions (explained in the following). Declarative memory (DM) contains a tangled hierarchy of information clusters, each with no more than five elements. Production memory (PM) contains IF-THEN condition-action pairs with conditions drawn from DM and actions inserted in WM. Anderson's theory is based on empirical findings of human learning and memory studies and as such, has been elaborated to match the theoretic thinking in that domain. This introduces elaborations as separating memories into temporal, spatial, and abstract classes. ACT* offers six kinds of interactions in WM and five different mechanisms for conflict resolution. Although these theoretic elaborations match the complexity of human cognitive processing theory, they also increase parameterization and allow multiple predictions based on which combinations of processes are operating. A somewhat simpler human cognitive modeling scheme was proposed by Card, Morgan, and Newell (1983). The Model Human Processor (MHP) was a general model for human problem-solving.
MHP postulated three interacting subsystems
(perceptual, motor, and cognitive) each with their own processor and memories. Per-
ceptual stores include visual arid auditory memories. Motor stores have the ability to store sequences of motor behaviors. Cognitive stores include working and long-term memory.
Operation of the MHP model is based on the Recognize-Act cycle, where
productions are drawn from long-term memory into WM and the results of their firing modifying WM. Operations are governed by the principles of discrimination (retrieval based on uniqueness), uncertainty (decision processes slow with uncertainty), and rationality (goal-orientation). The MHP model has evolved into what is now called Soar. Soar is an advanced expert system software architecture which employs a decision engine modeled after human problem-solving. However, Newell (1990,1992) asserts that Soar is a candidate for a unified theory of human cognition instead of being just another computational expert system.
Newell supports his claim based on a common mental chronometery
(similarities in timing), a common architecture with perception and motor function, and a convergence of Soar's behavior with data on human operations and learning. Newell eloquently supports the relationship between Soar and human cognition by pointing out Soar can predict or explain many human learning and memory phenomenon. Under NewelPs urging, Soar incorporated human intelligence strategies as part of its software architecture. The first feature added was universal sub-goaling äs a means of overcoming impasses. If Soar cannot initially achieve a solution to a problem, it defines more attainable sub-goals which are attainable. Once these sub-goals are attained, the final goal is tested again and if not yet achieved, new sub-goals are defined.
This process continues until the ultimate goal can be attained from the last
achieved sub-goal. Universal sub-goaling circumnavigates impasses without arbitrary assumptions or ineffective trial-and-error processes. Another important feature of Soar is the use of chunking as a learning process during problem-solving.
Chunking, the phenomenon reported by Miller (1959) that
overcomes the limitations of short-term or WM, allows combination of IF-THEN production rules into related groups. The chunking hypothesis is that "A human acquires and organizes knowledge of the environment by forming and storing expressions, called chunks, which are structured collections of the chunks existing at the time of learning"
(pg. 142; Rosenbloom in Laird, Rosenbloom, and Newell, 1986). It uses a stimulusresponse relationship between contents of chunks and follows from human learning theory.
Chunking enables Soar to manage the complexity of large production rule
bases by organizing them into chunks of increasing complexity. Rosenbloom goes on to show how Soar behavior seems to mimic human performance on memory and problem-solving tasks. The Soar approach has certain advantages that favored its application in simulations over ACT-R.
First, Soar is an extremely parsimonious approach to cognitive
modeling; lower model complexity means a more deterministic approach.
Perhaps
even more important is that Soar is already being employed in modeling aircrew behaviors. The Defense Advanced Research Project Agency (DARPA) funded both Drs. Laird and Rosenbloom to develop intelligent forces (IFORs) for the Synthetic Theater of War (STOW) combat simulation. The Soar architecture had already been ported into the Modular Semi-Automated Forces (ModSAF) software system. ModSAF provides aircraft flight dynamics and weapons models while Soar provides the intelligence to "fly" IFOR aircraft autonomously. By using Soar, this substantial existing DARPA effort could be leveraged to create a working model with a minimum of time and effort. Another advantage to the Soar-ModSAF approach is that it is distributed interactive simulation (DIS) compatible. Models developed using Soar-ModSAF could be tested in complex DIS scenarios and improvements made by cognitive modeling could enhance Soar performance in STOW. Background The CCDT Program had already conducted a HITL simulation and created two different models to predict the effectiveness of cockpit display and control changes in the F-15 based fighter and its ability to deliver multiple Maverick missiles during a single attack run. The baseline configuration consisted of a F-16 cockpit simulation using the Low Altitude Night Targeting and Infrared Navigation (LANTIRN) targeting pod to deliver two fire-and-forget Maverick air-to-surface missiles. The LANTIRN pod provides a wide 6° and a narrow 1.69° field-of-view display through which the pilot must detect, identify, and designate the target vehicles. Targets were KC-10 tankers parked among
multiple (2 or 4) B-52 bombers on an airfield's ramps and taxiways. In a typical LANTIRN attack, the pilot will fly at medium altitude (7500 feet or 2286 meters) and airspeed (480 knots or 247 m/s) directly toward the target. The LANT1RN targeting pod FLIR display is used to view the target area and to designate targets for Maverick launch. When the target is within the Maverick's optimum range, the pilot fires one or more weapons at the designated targets. The second configuration evaluated by the CCDT Program is an enhanced cockpit which was also HITL simulated and modeled. The enhanced cockpit contained two significant improvements. First, the RTIC provided a satellite view' of the attack area with all targets marked. Second, the FLIR was improved to provide 30% better contrast than the baseline FLIR image. It was anticipated that the advanced knowledge of the target location coupled with the improved LANTIRN FLIR contrast would reduce the target acquisition time and increase target designation accuracy. The CCDT Program had already developed two other models of the baseline and enhanced configurations which were created to determine how well the models predicted the HITL simulation performance. One model was built using the Extended Air Defense Simulation (EADSIM) while the other was developed using MicroSaint™ modeling software. The CCDT Program wished to compare the Soar model with all three of the previous efforts. Thus, the present modeling effort was informed only of the dependent measures used in the other simulations and was otherwise kept "in the blind" to the results of the HITL, EADSIM, and MicroSaint™ simulations so that a fair comparison could be made. The performance of the other simulations was provided only after the Soar simulation was created and data collection runs were complete. One problem identified early on about using Soar to model the CCDT Maverick launch mission is that this particular mission is very sequential in nature. Hence, the mission was not particularly mentally challenging and could not utilize the advanced cognitive modeling features of Soar, i.e., sub-goaling and chunking. The mission outcome is largely based on perception rather than cognition and calls for a modeling approach more suited to discrete event simulations rather than Soar's cognitive approach. Hence, the bulk of the results reflect the ability to predict the perceptual tasks. Under-
Standing this lack of stress on Soar's capability, approval to build a Soar model of the Maverick launch mission was granted. The goal was to determine whether Soar could be used to micro-model pilot behaviors (STOW programming is at a tactical level), perceptual input, and motor output processes. This limited effort could be followed by a more comprehensive one which modified the mission with more cognitively-taxing characteristics which would completely test Soar's ability to cognitively model pilots with the hopes of developing a cognitive engineering tool for automatic testing of mentallydemanding, human computer interfaces.
SIMULATION DESIGN AND METHODS Summary of Requirements Mission The ground attack mission begins with the pilot and vehicle at an altitude of 7500 feet, flying at a speed of 480 knots, and heading east toward the first waypoint, waypoint one. As indicated in Figure 1, the pilot then turns 90 degrees left and heads due North to the IP point and then continues due North to the target area where the pilot will designate, lock, and fire two Maverick missiles at two KC-10 aircraft on the ground (there are also four to eight B-52 aircraft on the ground and in the proximity of the KC10s which serve as distracters). The starting point is at least 5.1km from waypoint one and waypoint one is 5.1km from the IP. All reported times are relative to the time the pilot reaches the IP point. All reported distances are relative to the target or target area. The pilot knows there are four possible plane groupings for each trial, but only two of the four groupings will be populated in a given trial. The pilot knows that in each of the populated groups there will be only one target aircraft, a KC-10.
Hence, once
the pilot has identified and designated the KC-10 in the first group, the pilot can assume all the remaining, yet to be identified aircraft for that group are B-52s. Thus, the pilot will not identify the remaining aircraft in that group and the pilot can switch its attention to the second group. If the pilot miss identifies the KC-10 as a B-52 and identifies all the planes in a grouping as B-52s, then the pilot, knowing there must be one KC-10 in
the group, will "look" again at each plane until one plane is identified as a KC-10. After the pilot designates the second aircraft, the pilot switches to locking each of the Mavericks. The pilot then watches the range icon until the range is less than 58,000 feet. When the range is less than 58,000 feet, the pilot then pushes the fire button.
I ,
—■?' :■■■■:■■.•.
File
.'I TV , ~;.- —,.
Map Scale
.
-,-V: -
■■
■—-r---
.
Map Features
—■ - ■ . - —.
Show As
. . —-~r-'■■,-■-,-:
..— ■■.- .J.?t- — I ■—' I ~ .
Special
V
: j5|£j
1:246,036
T^get
t
& © ,- ^■a'ST.
g^-g 38
Jf
IM
3_ *
f Slew cursor onto far target cluster (motor delay)
Lock Target 2 (motor delay)
\
Identify target clusters on airfield
I
Go to
\
Designate RTIC indicated target for Maverick Store Time/Range Accuracy
/ 4
No Range icon
Yes
Slew cursor onto near target cluster (motor delay)
Launch Mavericks (motor delay)
Figure 3. Flowchart of RTIC Behaviors.
In the second scenario, the RTIC condition, the pilot is given a satellite view of the aircraft on the ground and the target aircraft, i.e., the KC-10 is highlighted. The solution to representing this graphical intelligence information was to calculate the centroid for each group and then to calculate the polar position of each aircraft in the group relative to the centroid. The target was then the aircraft that matches the relative angle and distance to the group's centroid. Hence, after detecting all the planes in the first group, the pilot designates the plane that matches this intelligence information. After the pilot detects all of the planes in the second group, the pilot designates the plane that matches that intelligence information. After the pilot has designated two aircraft, the pilot then switches to locking each of the Mavericks. Finally, the pilot watches the range icon and when the pilot was within 58,000 feet, the pilot pushed the fire button.
10
After the pilot pushed the fire button, the program recorded the trial number, the number of hits, misses, false alarms, and correct rejections. The program also records the time elapsed since the IP point and the range to the target and range to the pseudo airfield for the following parameters: •
First detection
•
First identification (0 for the RTIC scenario)
•
First and second designation
•
First and second Maverick lock
•
Launch
Soar Behavior Design Visual Model The existing Soar visual model had a range of seven nautical miles with perfect visibility, i.e., at distance of 7.001 nautical miles, the Soar pilot had no information about an object. However, at 6.999 nautical miles, the Soar pilot knew all it could about the object: lateral range, slant range altitude, heading, speed, location, call-sign, and vehicle type. To simulate WFOV and NFOV characteristics, the existing Soar behaviors were enhanced. First, the Soar visual lateral-range was increased to 32,000 meters (104,918 feet). After an aircraft was detected, the object was then assigned a detection slant-range and an identification slant-range. The detection range assigned was designed to have an average value of about 28.6 km with a standard deviation of about 1.0 km. The distance of 28.6 km was chosen because at this range, both the KC-10 and B-52 would subtend about five pixels on a 300x300 pixel screen of a 6.0° WFOV sensor as indicated by Equation 1 and Figure 4. sinG = opp/hyp or sin(0.05°)=25m/28.6km EQ .1
li
150 pixels 2.5pixels=25m
Figure 4. Diagram of WFOV Angels and Pixels Used to Calculate Slant-Range Detection Limit.
Determining the range at which a pilot could discriminate between a KC-10 and a B-52 required human subject data. Image pixelation was calculated based on aircraft size and range. The pixel subtense is plotted in Figure 5. Range vs pixel count 10000000
1000000
Number of pixels (in a 300x300 image)
Figure 5. Estimation of an Aircraft's Length in Pixels vs Range for WFOV and NFOV FLIRs. The angles used were 6.0 and 1.69 degrees for WFOV and NFOV sensors respectively. The aircraft were estimated to have a 163 foot wingspan.
12
These calculations were the basis for creating pictures with the Image Processing Toolbox of Matlab (Thompson and Shure, 1995); an example of the output is shown in Figure 6. Human subjects were asked to identify pixelated reproductions of KC-10s and B-52s viewed from 15° angle above the horizon to approximate the medium altitude approach.
Figure 6. One Recognition Test Plate for KC-10 Viewed 60° Off-Axis from the Nose View. See Appendix 1.2 for a complete set of B-52 and KC-10 pixelated images.
As seen in Figure 7, D' did not reach the 90% level until the plane subtended 25 pixels. The NFOV sensor has a 1.69° field-of-view. Thus, the minimum identification range can be calculated similarly to the WFOV calculations for detection range. The identification range is 20.3 km = 25m/sin(1.69 ° X25/300/2).
13
KC-10 Detection vs Pixel Density 4.5 -
^^*
4 3.5 3 ♦ ^^ \s^
2.5 D-
♦
2 1.5 • 1 -
D' D' linear regression
♦
0.5 ■ 0 ■ C)
10
20
30
40
50
Number of Pixels in Length of Plane
Figure 7. Ability of Novice Human Subjects to Discrimination Between KC-10s and B-52s Based Upon Pixel Density. Thus, in the baseline scenario, the Soar pilot models discrimination between KC10 and B-52 aircraft by the ability to see 25 pixels of the aircraft's length. However, an image subtending 25 pixels did not give the Soar model perfect vision. Behaviors were added so that at a displayed image of 25 pixels or slant range of 20 km, the pilot had a 90% chance of correctly discriminating between a KC-10 and a B-52. To model human behavior, the identification accuracy was dependent upon distance according to the following equations
•identification
«
Pidentif,cation = 2.93-3.045E-5*range "identification
—
'
Slant Range > 96,000 feet
EQ . 2
96,000 < Slant Range > 63,000 feet
EQ . 3
Slant Range > 63,000 feet
EQ . 4
As seen in Figures 8 and 9, identification distance had an element of chance associated with both the RTIC and baseline behaviors.
14
First Detection Distribution 30 T
25 0)
o P
20
u O
15
v st E 3 z
10 --
5T o o o
CM 0>
o o o
o o o
CD O)
o o o
O O O O
CO
CM O
o
05
Slant Range (feet)
Figure 8. First Detection Distribution for RTIC Condition.
First Identification Distribution 16 14
1 12 c o
3 Ü U
O
10 8-
m
SI
E
3
o o o
o o o CM
co
o o o co CO
o o o CO
o o o in CO
o o o CO CO
o o o
!■» CO
o o o oo CO
o o o o)
CD
o o o o
o o o
o o o CN
t^
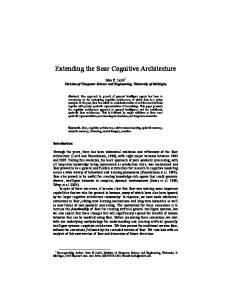
Slant Range (feet)
Figure 9. First Identification Distribution for the Baseline Condition.
15
In the RTIC scenario, the pilot did not need to visually discriminate between the KC-10 and the B-52. The pilot only needed to determine where the group of planes were, match the NFOV sensor image of the planes to the intelligence image, and then recognize the relative position of the target plane relative to the other planes in the group and then designate this same plane in the NFOV sensor image. The solution to representing this graphical intelligence information was to calculate the centroid for each group of aircraft. Then, the polar position of each aircraft relative to the centroid was calculated. The target was then the aircraft that was both within 20 meters and 0.1 radians of the calculated distance between the centroid and KC-10 given in the intelligence information. Since the target position changed twice and the number of distracters changed twice, this caused the location of the centroid to be changed four times which required four sets of intelligence information. This mapping between the Soar supplied data located in files rl.soar, r2.soar, r3.soar and r4.soar and the plane layout configurations are seen in Table 1. Table 1. The Associative Mapping Between Soar Supplied RTIC Information and Plane Layout Sourced at the ModSAF Parser FILE NAME r1 .soar r2.soar r3.soar r4.soar
PLANES PER GROUP 3 3 5 5
TARGET POSITION 1 2 1 2
PLANE LAYOUT (Corresponding file sourced at ModSAF parser) 1 - 6 7-12 13-18 19-24
Motor Model Since the Soar language does not have any inherent mechanism for generating delays, the top-state attribute current-time was used as a timer. The resolution of the current-time attribute was one second. Hence, a delay set for one second has a theoretical delay of greater than zero but less than or equal to one second. Behavioral motor delays were added to prevent immediate execution of behaviors where motor delays were required. A summary of motor delays and the value of the programmed delays are seen in Table 2.
16
Table 2. Summary of Simulated Motor Activity and Corresponding Programmed Delay MOTOR ACTIVITY Engage WFOV Switch to NFOV Decide Hit, Miss, FA or CR Designation and Confirm Switch from Designation to Locking Locking and Confirm Launch
PROGRAMMED MOTOR DELAY 1 1 1 1 3 1 2
Randomization Since Soar does not have a random number generator, random numbers were generated by calculating the sine value for the current-time value. To obtain a distribution that was not flat and had similarities to a gaussian distribution, three random numbers were averaged.
To calculate the detection and identification ranges for each
plane, the average of three random numbers were subtracted from 0.5 and this difference was multiplied by the variance for that parameter.'' This result was then added to the expected mean for that parameter. As seen in Figure 8 and 9, the distribution of detection and identification ranges have a gaussian-like distribution. After the Soar pilot is focused on a particular plane and the slant range is less than the calculated identification range for that plane, then the probability for accurately identifying the focused vehicle is calculated as seen in equations 2, 3, and 4. This calculation is based upon the slant-range between the Soar pilot and the aircraft in question and a randomly-generated number having a flat distribution. If the calculated probability was greater than the randomly-generated number, then a hit or correct rejection was recorded. If the calculated probability was less than the randomly-generated number, then a miss or false alarm was recorded.
Program Description As seen in Figures 2 and 3 (Flowcharts for Baseline and RTIC Behaviors) and Appendices 1.3 and 1.4 (selected text outputs from execution of baseline and RTIC behaviors), the mission starts with the Soar pilot flying toward waypoint one.
17
After
achieving waypoint one, the Soar pilot turns north and flies to the IP. After achieving the IP waypoint, a timer is started, the pilot continues North at an altitude of 7,500 feet and speed of 480 knots and engages the WFOV. After a cluster of objects is detected, the Soar pilot switches to NFOV. The pilot continues to focus on one object in the cluster until it is both detected as a plane and identified. After identification, the validity of the identification is calculated and recorded as a hit, miss, false alarm, or correct rejection. Once a KC-10 is believed to be identified, a hit or false alarm, then the object is designated and the second cluster is processed. If a miss occurs, then all of the identification information for that group is erased after all the planes are identified and the identification process is repeated until a hit or false alarm occurs. After two aircraft are designated, the pilot switches to the launch procedures. The launch procedures consist of locking and confirming both of the Mavericks. After locking both Mavericks, if the slant range is greater than 58,000 feet, then the pilot watches the range icon. After locking both Mavericks, if the slant range is less than 58,000 feet, the pilot presses the fire button. The RTIC behavior scenario differs from the baseline behavior outlined above in the identification process. In the RTIC behaviors the planes are not identified. After the cluster is detected in WFOV and the pilot switches to NFOV, the pilot focuses on each target and calculates the polar coordinates for that plane. If the plane's polar coordinates are not within the limits input by the intelligence information, then a correct rejection is recorded and the pilot proceeds to focus on the next plane in the group. If the plane's polar coordinates are within the limits input by the intelligence information, then a hit is recorded, the plane is designated and the pilot proceeds to the next group or to launch procedures if this was the second group. RESULTS Analysis of Soar Model The experiment contained two major variables, scene density and pilot vehicle interface. The scene was further complicated in that only two of the four possible vehicle locations were occupied. A bird's eye view of the field arrangement is presented in Figure 10. This requirement resulted in six different possible groupings (1-2,1-3,1-4,
18
2-3, 2-4, 3-4). Furthermore, the location of the target vehicle, the KC-10, was also varied between two locations within each group. Hence, the experimental matrix was a 2x2x6x2 which was repeated five times for a total of 240 trials. Table 3 summarizes these independent measures.
Figure 10. Airfield Area (from Holly Bautsch, 1997 pg. 27).
19
Table 3. Arrangement of Independent Measures Used in Prior Efforts and by the Soar Model Variable Pilot Vehicle Interface
Levels 2
Variations Baseline Enhanced (RTIC)
Cluster Size
2
Three aircraft Five aircraft
Groupings
6
Two out of four possible airfield positions 1-2,1-3,1-4,2-3,2-4,3-4
Position in Cluster
2
Two positions used each in groups size three or five
The dependent variables measured included: detection time and range, identification time and range, designation time and range, lock time and range, launch time and range, and recognition accuracy. As seen in Figures 8 and 9, the modeling of detection and identification ranges did have a distribution that appears gaussian. The intended detection range average was 93,500 feet with a standard deviation of about 3,200 feet. The actual detection slant-range for all trials was 93,989 with a standard deviation of 3,247 feet. Similarly, the intended identification range average was 66,500 feet with a standard deviation of about 1,600 feet. The actual identification slant-range for all trials was 67,030 with a standard deviation of 1,729 feet. As expected from analysis of the visual model, the Soar-simulated RTIC interface resulted in significantly earlier designation and lock times compared to the baseline condition (first designation time: p=0.001, F=3352, N=60; first lock time:
p=0.0001,
F=3872, N=60). As seen in Figure 15, the first lock time for the RTIC condition with a scene complexity of three averaged only 21.25 seconds. The RTIC condition with a scene complexity of five was 2.2 seconds higher, due to the increased scene complexity. Conversely, the baseline condition with a scene complexity of three had an averaged first lock time of 54.72 seconds, 33. 47 seconds longer than the RTIC condition. Similarly, scene complexity increased baseline first lock time by 1.58 seconds.
Al-
though the PVI and scene complexity interaction was not statistically significant, the increased effect for the RTIC condition should have resulted because in the RTIC condi20
tion, the Soar pilot must process each of the planes prior to identifying the target. However, in the baseline condition, the Soar pilot can terminate processing a group after the KC-10 is identified. Thus, in the baseline condition, the average number of vehicles expected to be processed with a scene complexity of three is two and with a scene complexity of five is three.
Hence, increasing the scene complexity in the baseline
condition will not increase the average lock time as much as the RTIC condition, but the variation should be much larger in the baseline condition. The variation in RTIC first lock times are about 4.5 seconds regardless of scene complexity. However, baseline lock time variation is 3.37 seconds for a scene complexity of three and increases to 4.04 seconds for a scene complexity of five. Although this time difference in variance is not significant (F=1.44, N=60), the difference in variance for first lock range for baseline condition between scene complexities is significant (F=1.88, N=60). The explanation for the significance is that the time has an increased variance due to the different times it takes to reach the same slant range from each group since the target groups are located at different distances from the IP. Overall accuracy of performance was comparable for the four experimental conditions. Categories of responses for each condition are plotted in Figure 11. The most marked difference is the increased number of correct rejections when more B-52s appeared in target clusters.
21
60.00 ■,
I 50.00 SRTIC-3
40.00
eRTIC-5 ■ Baseline-3
30.00
D Baseline-5 20.00
10.00 -
0.00 o a •J2-
CO
3. o co
c ? «