International Journal of Industrial Engineering and Management (IJIEM), Vol.3 No 4, 2012, pp. 25-31 Available online at http:// www.iim.ftn.uns.ac.rs/ijiem_journal.php ISSN 2217-2661 UDK: 004.4:338.465
Research paper
Low-Overhead Continuous Monitoring of Service Level Agreements Dušan Okanović Assistant, Faculty of Technical Sciences, Novi Sad, Serbia,
[email protected]
Milan Vidaković Full professor, Faculty of Technical Sciences, Novi Sad, Serbia,
[email protected]
Zora Konjović Full professor, Faculty of Technical Sciences, Novi Sad, Serbia,
[email protected] Received (22 December 2011.); Revised (24 January 2012.); Accepted (06 February 2012.)
Abstract Constant monitoring and verification of the software are required in order to assure the software meets service levels required by the service consumer are met by the service provider. We propose a new XML schema for defining service level parameters. In documents based on this schema we define parts of application to be monitored, which metric is going to be used and what are expected values. We present the DProf tool for adaptive continuous monitoring of software performance, which is based on Kieker framework. The overhead generated by this system is lower then that of the other tools or Kieker framework extensions. The system is implemented in Java, but, with minor modifications, it can be used for .NET applications. Key words: software monitoring, continuous monitoring, service level agreement
1. INTRODUCTION It is necessary to monitor software in its operational stage and environment, if we want to determine whether the quality of service and service level agreements are on a satisfactory level. While not all errors show up during testing phase, it is a common phenomenon for software performance and quality of service to degrade over time [1], too. Software testing, debugging, and profiling in development environments hardly allow to detect errors and unpredicted events that can occur after the software is deployed and used in its production environment. Service level agreement (abr. SLA) [2] is usually a part of an agreement between service consumer and service provider. Based on this document, service provider is obliged not only to provide service, but also to provide certain quality level of the service, too. SLAs specify permanent monitoring and verification of IT service levels. It specifies metrics to be used, service management and reactions to agreement breaches. It also contains time constraints, e.g. period of validity of contract and frequency of measurements. The life cycle of SLA [3] begins with the agreement definition. It is then passed to the service provider. Within service provider organization, duties are assigned, and monitoring phase can begin. During this phase, SLA parameters are monitored and data is gathered. This data is analyzed and used for 1) detection of violation of SLA and 2) service level
improvement. After data analysis, SLA is revised, and the whole process continues from the beginning. Graphic representation of this process' cycle is shown in Fig. 1.
Figure 1. SLA lifecycle
To determine how software behaves under production workload, continuous monitoring of that software is a valuable option. Continuous monitoring of software is a technique that provides a picture of the dynamic behaviour of software under real usage, but often results in a large amount of data. In the process of the analysis, the obtained data can be used to reconstruct architectural models and perform their visualization (e.g., employing UML). In the development phase, software developers usually utilize tools such as debuggers and profilers. Although they provide a picture of the software behaviour, they typically induce a significant performance overhead – something which is unacceptable for production use.
IJIEM
26
Okanović et al.
In order to check if software performance is in compliance with SLA, we have developed the DProf system. It performs continuous monitoring of software and analyses gathered data. Based on this data and our DProfSLA XML schema, DProf can find which part of application is not in accordance with SLA. This reduces time needed by developers to identify the source of the problem and to solve it. DProfSLA schema based documents are used to define required service-levels in various metrics. System is extensible so that users can define their own metrics and implement measuring techniques. The rest of the paper is structured as follows. Chapter 2 presents related work in the field. In chapter 3 we present DProfSLA XML schema, while in chapter 4 we give short description of our DProf system. Fifth chapter gives an example of how DProf can be used, while chapter 6 provides conclusion and guidelines for future work.
2. RELATED WORK Related work focuses on existing standards for SLA documents definition (chapter 2.1) and monitoring tools (chapter 2.2). 2.1 Overview of existing SLA standards In order to automate service level management process, SLAs must be defined in machine-readable format. As shown by Tebbani et al. [4], there are only few formal SLA specification languages. SLAs are usually written in some spoken language. Authors propose GXLA – XML specification for GSLA (Generalized Service Level Agreement). GSLA is defined by authors as a contract signed between two or more parties, which is designed to create a measurable common understanding of each party role. A role presents the set of rules which define the minimal service level expectations and obligations the party has. GXLA is a XML schema which implements GSLA information model. GXLA is composed of following sections: schedule (temporal parameters of contract), party (models involved parties), service package (an abstraction used to describe services) and role (as described). Creation and use of GXLA allows automation of service-management process. WSLA described in [5] is XML based and it is used to specify service levels for web services. WSLA document defines interested parties, metrics, measuring techniques, responsibilities and courses of action. Authors state that every SLA (and WSLA, too) contain 1) information regarding agreeing parties and their roles, 2) SLA parameters and measurement specification and 3) obligations for each party. Paschke et al [6] performed categorization scheme for SLA metrics with the goal to support the design and implementation of automatable SLAs. Standard elements of each SLA are identified and shown in: technical (service descriptions, service objects, metrics and actions), organizational (roles, monitoring parameters, reporting and change management) and legal (legal obligations, payment,
additional rights, etc.). Authors categorized service metrics in accordance with standard IT objects: hardware, software, network, storage and help desk. SLAs are grouped according to their intended purpose, scope of application or versatility (using categorization by Binder [7]). According to this categorization, DProfSLA documents are operation level documents (by intended purpose) to be used in-house (by scope of application). By versatility categorization, they belong to standard agreements. The schema provides subset of elements defined by already existing GXLA or WSLA, and documents can be translated into these schemas using XSLT. 2.2 Overview of application monitoring tools Study shown in [8] shows that, while service levels and performance of applications are of critical importance in practice, application level monitoring tools are rarely used. Java application monitoring tools are usually developed using either JVMTI/JVMPI [9, 10] or aspect-oriented programming (AOP) [11]. JVMTI and JVMPI APIs require knowledge of C/C++ in addition to Java, and also yield significant overhead [1]. COMPASS JEEM [12] can be used to monitor JEE applications, but every application layer needs different set of probes. Tools developed by Briand et al. [13] can be used only for UML diagram reconstruction, and it cannot be used for monitoring of web-services. There are also commercial application monitoring tools, such as DynaTrace and JXInsight. AOP is used for instrumentation of code. Separation of concerns allows for monitoring code to be separated from application code. There are several monitoring tools based on AOP. The Kieker framework [1] is a framework for continuous monitoring and analysis of all types of Java applications, that uses aspects to define and implement monitoring probes.The HotWave framework [14] tool allows run-time reweaving of aspects and creation of adaptive monitoring scenarios, but it is still in development phase. The DProf system presented in this work is based on the Kieker framework [1] and the JMX technology [14]. It can be used for adaptive and reconfigurable continuous monitoring of JEE applications, as presented in this paper. Use of Kieker grants low overhead, and separation of monitoring code from application code by using the AOP. JMX is used for controlling of monitoring process at run-time. Together with DProfSLA schema, DProf system can be used to monitor how SLA is executed and where problems occur.
3. DPROFSLA XML SCHEMA Monitoring process goals are defined using a special XML schema – DProfSLA schema. Schema is specified in accordance with categorizations and existing schemas shown in related work. Root element of this schema is shown in Fig. 2.
IJIEM
27
Okanović et al.
The root element (DProfSLA) has three sub elements: Parties (parties in the agreement), Trace (call-traces to be monitored) and Timing (time constraints of this agreement). The Parties element represents interested parties in the agreement. This element is presented in Fig. 3. The Parties element has two sub elements: Provider (representing service provider) and Consumer (representing service consumer). Both of these sub elements contain contact data regarding service provider and service consumer, respectively – i.e. interested parties in this agreement. Each sub element is represented using the OrganizationType (Fig. 4) complex type.
Figure 5. ContactType complex type defined in the DProfSLA schema
ContactDataType contains (optional) attributes for address, e-mail address, web address and contact phone for each interested party in the agreement. The Trace element (Fig. 6) represents a performance information for one call trace. It is of the TraceType complex type.
Figure 2. Root element of the DProfSLA schema
Figure 3. Parties element in the DProfSLA schema
Figure 6. TraceType complex type defined in the DProfSLA schema
Figure 4. OrganizationType complex type defined in the DProfSLA schema
The OrganizationType element contains the following attributes: name (organization name) and otherInfo (some other information regarding that organization). Contact information for that organization is stated in the ContactData sub element which is presented using the ContactDataType (Fig. 5) complex type. The Timing element (Fig. 7) is used to specify time constraints for this agreement. Sub elements StartTime
The Trace element has two mandatory attributes. The name attribute is used to specify a part of application to be monitored. String representation of a call tree is used for this. The metric attribute specifies which metric is used, i.e. which aspect of application performance is going to be monitored. Sub elements of the Trace element can be other Trace elements, e.g. methods that are invoked from other (parent) method, described in parent Trace element. Furthermore, there are four optional attributes for specification of expected performance values in designated metric. The nominalValue represents expected average value, while the upperTolerance and lowerTolerance are maximal and minimal average values in designated metric, respectively. The anomalyPct is used to define allowed number of extreme values in obtained results. and EndTime define period to which this document applies. Both times are in milliseconds (XML schema
IJIEM
28
Okanović et al.
long values), starting from midnight, January 1, 1970 UTC (as in Java specification).The SamplingPeriod element denotes time (in milliseconds, long values) between two analyses of obtained results.
Figure 7. Timing element defined in the DProfSLA schema
4. DPROF MONITORING SYSTEM In order to continuously monitor software applications we have developed the DProf monitoring system. It is mainly designed for continuous monitoring of JEE applications. With minor modifications it can be used for applications developed for other platforms. This system is based on Kieker framework for continuous monitoring and analysis of software systems. We have developed additional components in order to allow changing of monitoring parameters while the application is still running. The Kieker framework consists of the Kieker.Monitoring and the Kieker.Analysis components. The Kieker.Monitoring component collects and stores monitoring data. The Kieker.Analysis component performs analysis and visualization of this monitoring data. The component diagram of Kieker framework is shown in Fig. 8.
The Kieker.Monitoring component is executed on the same computer where the monitored application is
being run. This component collects data during the execution of the monitored applications. The Monitoring Probe compoenent is a software sensor that is inserted into the observed application and takes various measurements. For example, Kieker includes probes to monitor control-flow and timing information of method executions. Probes are most commonly implemented using AOP aspects, and additional probes can be added to support different measurements (e.g. for adding support for new metrics). Monitoring Log Writers store the collected data, in the form of Monitoring Records, in a Monitoring Log. The framework is distributed with Monitoring Log Writers that can store Monitoring Records in file systems, databases, or JMS queues. Additionally, users can implement and use their own writers. The Monitoring Controller component controls the work of this part of the framework. The data in the Monitoring Log is analyzed by the Kieker.Analysis component. A Monitoring Log Reader reads records from the Monitoring Log and forwards them to Analysis Plugins. Analysis Plugins may, for example, analyze and visualize gathered data. Control of all components in this part of the Kieker framework is performed by the Analysis Controller component. The DProf system uses Kieker's infrastructure for data acquisition, but with some additional components. Architecture of DProf system and its connection to Kieker is shown on Fig. 9. The DProfWriter is the new Monitoring Log Writer. It sends Monitoring Records to the ResultBuffer component. The ResultBuffer sends data (periodically or on demand) to the RecordReceiver component, which, in turn, stores data into the database. This combination of ResultBuffer, RecordReceiver and database plays the role of the Monitoring Log. Received data is periodically analyzed by the Analyzer component. The Analyzer can create new monitoring parameters (based on data analysis) and send these parameters to the DprofManager component. The DProfManager compoenent passes these parameters to the ResultBuffer compoenent (if the command requires change in data sending period) or to the AspectController component (if the command requires change in aspects or join points).
Figure 8. Component diagram of DProf monitoring system Application
MonitoringProbe
AspectController
Analyzer
aop.xml
DProfManagerService
MonitoringController
DProfManager AspectControllerMBean
Database server DBMS
DProfWriter ResultBufferMBean Timer Service
RecordReciever
ResultBuffer RecordRecieverService
Figure 9. Component diagram of DProf monitoring system
IJIEM
29
Okanović et al.
While using the DProfManager and these additional components we can change monitoring parameters at run-time. This allows us to reduce monitoring overhead by shutting off of monitoring in some parts of software, and obtain more accurate results. Setting of new parameters can be performed either manually, by a person in charge or by the Analyzer component. The Analyzer component, provided with document based on the DProfSLA XML schema, can check if service levels read from gathered data, are not in accordance with SLA and which part of the software causes this. More detailed information about DProf system and in depth explanation of its architecture can be found in [16]. Since the RecordReceiver component is designed as a web-service, this component can be used for receiving monitoring records from application developed for platforms other then Java/Java EE. In order to use this system with some other platform, such as .NET, all we need is Kieker and DProfManager implementation in .NET. This, although it seems complicated, can be reduced to rewriting these in corresponding * * programming language, using existing AOP and JMX implementations for .NET.
5. CASE STUDY The Case study of our solution will be described on the JEE application shown in [17]. It is a simple software configuration management (SCM) application, based on EJB and JAX-WS. The DProf was configured to monitor memory usage during execution of a method that creates organizations (OrganizationFacade.createOrganization(...)) and methods invoked from this method (OrganisationFacade.checkName(...) and City.getId(...) methods). Activity diagram for the part of the application which is going to be monitored is shown on Fig. 10. Listing 1. shows a part of DProfSLA document.
1 2 ... 3 ... 4 7 8 43200000 9 Listing 1. DProfSLA document for this example
Maximal values for memory usage during executions of these methods are given in the DProfSLA document. Measurement of memory usage in monitoring probes was performed using JMX platform MemoryMXBean. The analysis of the obtained data will be performed every 12 hours (43200000ms). First, only createOrganization() method is monitored and then, if there is deviation from values in DProfSLA, only methods invoked from this one are monitored. If there is a deviation from SLA values in one of these methods, that particular method needs to be reengineered. If there's no problem with any of them, parent method – createOrganization() – needs reengineering. Classes from kieker.*, java.* and javax.* packages are not monitored – we only look for problems in this application classes. After 12 hours results were analyzed by the Analyzer component, and they show increased memory consumption during the execution of the createOrganization(...) method (consumption 52.25557% of memory was used). To find the source of the problem, the Analyzer component changed monitoring parameters and included monitoring of City.getId(...) and Organization.checkName(…) methods. Analysis of the data gathered after another 12 hours, showed that checkName(...) method exceeds expected amount of memory (52.55579%). Results from first and second iteration are shown in Table 1. Based on these results, it can be said that checkName(...) method requires refactoring in order to be optimized and in accordance to the SLA.
Figure 10. Activity diagram for the part of the test application
IJIEM
30
Okanović et al.
Monitored Method Monitored Levels Level 1
Organization. createOrganization()
City. getId()
Organization. checkName()
52.25557
N/A
N/A
52.25658
52.25657
52.55579
Levels 1 and 2
Table 1. Obtained monitoring data
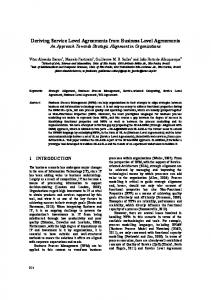
6. MONITORING OVERHEAD ANALYSIS Measurment of response times has been performed in order to determine the DProf on the monitored application. A comparison of response times for different test scenarios is shown in box-and-whisker diagram in Fig. 11.
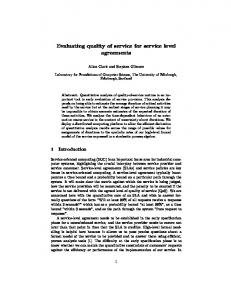
Turning on monitoring of an application yields monitoring overhead, as expected. Turning on monitoring in additional levels, has even more overhead as a consequence, but more detailed information can be obtained. Monitoring results for DProf can be compared with other Kieker writers, as shown in Fig. 12.
Figure 11. Comparison of response times of Organisation.createOrganisation(…) method in different scenarios
Figure 12. Comparison of response times of Organisation.createOrganisation(…) method for DProf and different Kieker writers
We can see that DProf has lower overhead than that of AsyncFSWriter and AsyncDBWriter, which store data into file system and relational database, respectively. It was already shown in [1] that Kieker framework has very low overhead. DProf reduces this overhead even further, which makes it very useful for continuous monitoring of software.
This reduction of overhead comes from the fact that obtained data is not immediately stored into database. The data is stored in bulks, through ResultBuffer, periodically, so only occasional response time spikes can be experienced. Other writers (and tools) store data immediately, so during every application call response time are increased.
IJIEM
31
Okanović et al.
7. CONCLUSION In this paper we presented a XML schema for creating SLA documents and extensible system for continuous monitoring of applications and automatic evaluation of software against expected values, defined in SLA – DProf. Using this system we can search for problems in honoring an agreement between service provider and consumer. The system can gather data on application execution, compare these results with the expected results and find which part of application causes deviations and problems. Expected values are defined in a document based on DProfSLA XML schema. The schema is designed with existing SLA schema standards (such as GXLA and WSLA) and with categorizations of these schemas in mind. Its main use is for standard intra-organizational agreements, but it can be used for inter-organizational agreements, too. The system supports various metrics and additional metrics can be added as needed. As a proof-of-concept, the DProf system was used for monitoring of memory usage of one SCM application based on EJB and web services technologies. The analysis of performance overhead shows that DProf has lower overhead than existing writers from Kieker framework and other monitoring tools. Future work on this system will focus on implementation of the DProf Analyzer component as Kieker.Trace Analysis module and improvement of integration of the DProf component into the Kieker distribution. We will also work on extending of the system with additional monitoring probes for different and more complex measurements.
[2] [3] [4] [5]
[6] [7] [8] [9] [10] [11] [12] [13]
[14]
ACKNOWLEDGEMENT
[15]
The research presented in this paper was supported by the Ministry of Science and Technological Development of the Republic of Serbia, grant III-44010, Title: Intelligent Systems for Software Product Development and Business Support based on Models.
[16]
7. REFERENCES [1]
[17]
University of Kiel, Germany, available at: http://www.informatik.unikiel.de/uploads/tx_publication/vanhoorn _tr0921.pdf (accessed: 11 June 2011) Benyon, R. (2006), Service Agreements: A Management Guide, Van Haren Publishing, Netherlands Sturm, R., Morris, W. (2000), Foundations of Service Level Management, Sams, Indianapolis, USA. Tebbani, B., Aib, I. (2006), GXLA a Language for the Specification of Service Level Agreements, Springer Lecture Notes in Computer Science, Vol. 4195/2006, pp. 201-214. Keller, A., Ludwig, H. (2003), "The WSLA Framework: Specifying and Monitoring Service Level Agreements for Web Services", Journal of Network and Systems Management, Vol. 11, No. 1, pp. 57-81. Paschke, A., Schnappinger-Gerull, E. (2006), "A Categorization Scheme for SLA Metrics" in Multi-Conference Information Systems (MKWI 2006), Passau, Germany Binder, U. (2001), "Ehevertrag für IT Dienstleistungen" Infoweek 34(4) Snatzke, R. G. (2009), "Performance survey 2008" http://www.codecentric.de/export/sites/homepage/__resources/p df/studien/performance-studie.pdf (accessed: 11 June 2011) Java Virtual Machine Tool Interface, http://download.oracle.com/javase/6/docs/technotes/guides/jvmti (accessed: 11 June 2011) Java Virtual Machine Profiler Interface, http://download.oracle.com/javase/1.4.2/docs/guide/jvmpi/jvmpi. html,(accessed: 11 June 2011) Laddad, R., Johnson, R. (2009), Aspectj in Action: Enterprise AOP with Spring Applications, Manning Publications, USA Parsons, T., Mos, A., Murphy, J. (2006), "Non-intrusive end-toend Runtime Path tracing for J2EE Systems", IEEE Proceedings - Software, Vol. 153, No. 4, pp. 149–161. Briand, L. C., Labiche, Y., Leduc, J. (2006), "Toward the reverse engineering of UML sequence diagrams for distributed Java software", IEEE Transactions on Software Engineering, Vol. 32, No. 9, pp. 642–663. Villazon, A., Binder, W., Ansaloni, D., Moret, P. (2009), "HotWave: Creating adaptive tools with dynamic aspect-oriented programming in Java", in Proceedings of the 8th International Conference on Generative Programming and Component Engineering (GPCE ’09), ACM, pp. 95–98. Sullins, B. G., Whipple, M. B (2002), JMX in Action, Manning Publications, USA Okanović, D., van Hoorn, A., Konjović, Z., Vidaković, M. (2011), "Towards Adaptive Monitoring of Java EE Applications", International Conference on Information Technology – ICIT, Amman, Jordan Okanović, D., Vidaković, M. (2008), "One implementation of the system for application version tracking and automatic updating", in Proceedings of the IASTED International Conference on Software Engineering 2008 (SE 2008). ACTA Press, pp. 62–67.
*
v. Hoorn, A., Rohr, M., Hasselbring, W., Waller, J., Ehlers, J., Frey, S., Kieselhorst, D. (2009), Continous Monitoring of Software Services: Design and Application of Kieker Framework, Technical Report TR-0921, Department of Computer Science,
e.g. Spring.Net (http://www.springframework.net/), LOOM.NET (http://www.dcl.hpi.uni-potsdam.de/research/loom/) * e.g. NetMX (http://www.codeproject.com/KB/library/NetMX.aspx)
Kontinualno praćenje ugovora o nivou usluga sa manjim opterećenjem Dušan Okanović, Milan Vidaković, Zora Konjović Primljen (22 decembar 2011.); Recenziran (24 januar 2012.); Prihvaćen (06 februar 2012.)
Rezime: Stalno praćenje i verifikacija softvera su potrebni da bi se osiguralo da softver ispunjava očekivane nivoe usluge. U ovom radu dat je predlog nove XML sheme za definisanje nivoa usluga. U dokumentima na osnovu ove sheme definišu se delovi aplikacije koji se prate, koje mere treba da se koriste i koje su očekivane vrednosti za te mere. Prikazan je i DProf alat za stalno adaptivno praćenje softverskih performansi, koji se zasniva na Kieker okruženju. Opterećenje koje DProf dodaje na softver koji se prati je manje nego kod drugih alata ili ekstenzija Kieker okruženja. Sistem je implementiran u Javi, ali uz manje modifikacije može da se koristi za NET aplikacije. Ključne reči: praćenje softvera, kontinualno praćenje, ugovor o nivou usluga IJIEM