May 19, 2014 - A. Illana,1 A. Jungclaus,1 R. Orlandi,1,* A. Perea,1 C. Bauer,2 J. A. Briz,1 J. L. Egido,3 R. Gernhäuser,4 J. Leske,2 D. Mücher,4. J. Pakarinen,5, ...
PHYSICAL REVIEW C 89, 054316 (2014)
Low-velocity transient-field technique with radioactive ion beams: g factor of the first excited 2+ state in 72 Zn A. Illana,1 A. Jungclaus,1 R. Orlandi,1,* A. Perea,1 C. Bauer,2 J. A. Briz,1 J. L. Egido,3 R. Gernh¨auser,4 J. Leske,2 D. M¨ucher,4 J. Pakarinen,5,† N. Pietralla,2 M. Rajabali,6,‡ T. R. Rodr´ıguez,2 D. Seiler,4 C. Stahl,2 D. Voulot,7 F. Wenander,7 A. Blazhev,8 H. De Witte,6 P. Reiter,8 M. Seidlitz,8 B. Siebeck,8 M. J. Vermeulen,9 and N. Warr8 1 Instituto de Estructura de la Materia, CSIC, E-28006 Madrid, Spain Institut f¨ur Kernphysik, Technische Universit¨at Darmstadt, D-64289 Darmstadt, Germany 3 Departamento de F´ısica Te´orica, Universidad Aut´onoma de Madrid, E-28049 Madrid, Spain 4 Physik Department E12, Technische Universit¨at M¨unchen, D-85748 Garching, Germany 5 PH Department, CERN 1211, Geneva 23, Switzerland 6 Instituut voor Kern- en StralingsFysica, K.U. Leuven, B-3001 Heverlee, Belgium 7 AB Department, CERN 1211, Geneva 23, Switzerland 8 Institut f¨ur Kernphysik, Universit¨at zu K¨oln, D-50937 K¨oln, Germany 9 Department of Physics, University of York, United Kingdom (Received 19 November 2013; revised manuscript received 22 April 2014; published 19 May 2014) 2
The g factor of the first excited 2+ state in 72 Zn has been measured using the transient-field (TF) technique in combination with Coulomb excitation in inverse kinematics. This experiment presents only the third successful application of the TF method to a short-lived radioactive beam in 10 y, highlighting the intricacies of applying this technique to present and future isotope separator on-line facilities. The significance of the experimental result, g(2+ 1 ) = +0.47(14), for establishing the structure of the Zn isotopes near N = 40 is discussed on the basis of shell-model and beyond-mean-field calculations, the latter accounting for the triaxial degree of freedom, configuration mixing, and particle number and angular momentum projections. DOI: 10.1103/PhysRevC.89.054316
PACS number(s): 23.20.En, 21.10.Ky, 21.60.Cs, 27.50.+e
I. INTRODUCTION 68
The region around Ni has been the subject of numerous experimental and theoretical studies in recent years. The spherical neutron shell gap at N = 40 is responsible for the high excitation energy of the first excited 2+ state, E(2+ 1 ), and the small reduced transition probability, B(E2), in 68 Ni, but, as has been discussed in detail, it is not strong enough to stabilize the nuclei in a spherical shape as soon as protons are added to or removed from the 68 Ni core [1–3]. No discontinuity at N = 40 has been observed in Fe, Zn, Ge, or Se isotopes for any of the standard observables indicating shell gaps. Magnetic moments of excited states are known to provide valuable complementary information as compared to excitation energies and B(E2) values. They directly probe the composition of the wave function of a single excited state, for example, the first excited 2+ state, and thus make it possible to study the importance of particular single-particle orbits in its formation. In deformed nuclei, the g factor of the first excited 2+ state, g(2+ 1 ), is usually close to the hydrodynamical limit, Z/A, characteristic of collective states in which the magnetic moment is dominated by the orbital motion of the protons. In the case of strong spin contributions of the nucleons, however, deviations from Z/A are expected and indeed experimentally observed in many nuclei close to shell closures. Gyromagnetic ratios of first excited 2+ states have been measured for a number of nuclei
*
Present address: ASRC, JAEA, Tokai, Japan. Present address: JYFL, Finland. ‡ Present address: TRIUMF, Canada. †
0556-2813/2014/89(5)/054316(11)
around N = 40 just above the Ni isotopes, among them the stable even 30 Zn isotopes 62–70 Zn (Ref. [4] and references therein). All these values are close to the Z/A estimate in accordance with the already mentioned disappearance of the N = 40 shell gap above Ni. However, very recently the measurement of a value of g(2+ 1 ) = +0.18(17) in radioactive 72 Zn (T1/2 = 46.5 h) was reported [5]. In that experiment the high-velocity transient-field (HVTF) technique was employed for the first time to measure an excited-state g factor in a nucleus with proton number as high as 30. This result, which was shown to be in agreement with modern large-scale shellmodel calculations, and its deviation from the collective Z/A estimate were interpreted as being indicative of a transition in the structure of the Zn isotopes near N = 40. Obviously the experimental uncertainty of nearly 100% is too large to allow for any strong conclusion. However, the question of whether a significant deviation from Z/A is indeed observed in 72 Zn is certainly of considerable interest and, consequently, it would be important to determine this g factor with a better precision. At this point it is important to keep in mind that the measurement of g factors of excited states using radioactive ion beams is a very challenging adventure. Therefore, only very few successful experiments of this type have been reported so far [6–11]. Three different techniques are, in principle, applicable to the measurement of g factors of short-lived (in the region of a few picoseconds) excited states: recoil in vacuum (RIV) and the transient-field (TF) technique with low-velocity isotope separator on-line (ISOL) or high-velocity fragment beams (HVTF). The application of the RIV method to radioactive ion beams is straightforward from the feasibility point of view because the same thin target
054316-1
©2014 American Physical Society
A. ILLANA et al.
PHYSICAL REVIEW C 89, 054316 (2014)
foils are used as in standard Coulomb excitation experiments. However, it has to be taken into account that careful and time-consuming calibration measurements are required to extract information on magnetic moments from the observed attenuations of the angular correlations. The potential and limitations of the TF techniques when applied to nonstable beams are not yet fully explored. In the case of HVTF, the main uncertainty is attributable to the not-yet-parametrized TF strength for higher-Z nuclei [5], apparently weaker than expected. However, the inherent problem when employing the TF method with ISOL beams is related to the unavoidable use of very thick targets, leading to a severe straggling of the radioactive beam and consequently a larger background owing to a partial activation of the region around the target. Only the realization of a number of experiments employing the different techniques will allow us to gain the experience necessary to optimally exploit their potential at future radioactive beam facilities. We present here the measurement of the g factor of the first excited 2+ state in 72 Zn employing the TF technique performed at REX-ISOLDE (CERN). This experiment had the twofold aim of reducing the experimental uncertainty of the previous measurement and at the same time permitting a direct comparison of the advantages and disadvantages of the two TF techniques applied to the same case. The experimental setup including a newly developed target chamber is discussed in Sec. II, followed by the presentation of the data preparation, analysis, and results in the following two sections. The results are then discussed and compared to theoretical calculations in Sec. V before the article is closed by some concluding remarks. II. THE EXPERIMENTAL DESIGN
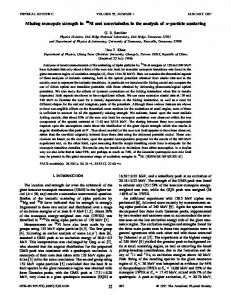
While the TF technique after Coulomb excitation in inverse kinematics is well established with stable ion beams [12], only a few experiments have been reported so far using radioactive beams [6,9,10]. The main problem when applying the TF technique to radioactive beams is the unavoidable buildup of activity in the target area owing to the straggling of the beam in the thick multilayer targets which have to be employed in these experiments. To establish this technique at REX-ISOLDE and in the future also at HIE-ISOLDE, a new target chamber was built. A schematic diagram of the device is shown in Fig. 1. The radioactive ion beam is impinging on the target, which is mounted between the pole tips of an electromagnet. The target in TF experiments typically consists of a first C layer in which the beam ions are Coulomb excited (mainly excitation of the 2+ 1 state), followed by a ferromagnetic Gd layer, in which the excited ions experience the transient magnetic field. Finally, the excited ions are usually stopped in a last, nonmagnetic Cu layer to avoid any effects owing to static hyperfine fields after the nuclei come to rest. For the present experiment we used a thicker Gd layer instead of the Cu to increase the precession effect and a thin third Ta layer necessary in the production process as a substrate for the evaporation of the Gd. In the case of this thick target (referred to as Run I in the following) the excited 72 Zn ions came to rest in the interface between the Gd and the Ta layers. This target has the advantage of maximizing the effect to be measured but at the same time its total thickness of more than 13 mg/cm2 leads to a significant
flange
segmented Si detectors
PCB board (feedthrough)
magnet yoke target support structure (Cu) FIG. 1. (Color online) Sketch of the new target chamber which has been constructed for TF experiments using low-energy radioactive beams at REX-ISOLDE and HIE-ISOLDE.
straggling of the radioactive beam in the target and therefore unavoidably to an activation of the target chamber. Therefore, a second target with a much thinner ferromagnetic Gd layer and a total thickness of less than 9 mg/cm2 was used in a separate run (Run II), thus avoiding to a large extent the problem of activation at the expense of a smaller precession effect. When this thinner target is used, γ -ray emission from the decay of the excited state of the beamlike ions occurs in flight. Therefore, Doppler correction has to be applied and the line of interest will show a broadening as compared to the thick target case. In addition, if the moving ion is not fully ionized, vacuum deorientation may reduce the anisotropy of the γ -ray angular correlation and therefore diminish the sensitivity to the precession effect. It has been one aim of the present experiment to study the advantages and disadvantages of the different target choices to set the frame for future TF experiments. The most important parameters for the two different runs performed in this experiment are summarized in Table I.
TABLE I. Main parameters of the runs performed with the two different targets. Included are the thicknesses of the different target layers, the measuring time, the average velocity, v, of the ions during their passage through the Gd layer in units of the Bohr velocity, v0 , and the effective interaction time, teff , between the excited-state magnetic moment and the transient magnetic field. Run
I II
054316-2
Thickness (mg/cm2 )
Duration
C
Gd
Ta
(h)
0.48 1.0
11.8 6.7
1.0 1.0
28 42
v/v0
teff (ps)
2.84 5.01
2.4 0.77
LOW-VELOCITY TRANSIENT-FIELD TECHNIQUE WITH . . .
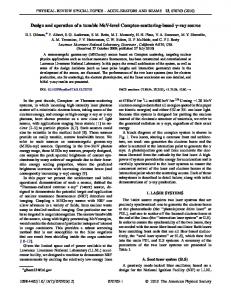
In the new target chamber the targets are mounted on a Cu target holder which is cooled to about 110 K using flowing liquid nitrogen. In this way the targets were kept well below the Curie temperature of Gd. A vertically polarizing magnetic field of about 0.1 T is provided by an electromagnet with two coils in air outside the target chamber. The field direction was inverted periodically to minimize systematic uncertainties. Instead of stopping the non-reacted beam behind the target and detecting the target recoils in a Si detector in forward direction (including the 0◦ direction) as is usually done in stable beam experiments, two square 20 × 20-mm2 doublesided silicon strip detectors (DSSD) with 16 horizontal and 16 vertical strips were positioned above and below the beam axis to allow as much as possible of the radioactive beam to leave the target area. The DSSDs were placed 30 mm behind the target at a vertical distance of about 11 mm from the beam axis, covering an angular range for the ion detection from about 20◦ to 45◦ . Four MINIBALL detectors [13,14] were used to detect the γ rays emitted in the decay of excited states. Each of these detectors consists of three individual Ge crystals with sixfold segmentation. The high granularity of these detectors allows for the measurement of the γ -ray angular correlation without the need to move the detectors. The detectors were positioned close to the horizontal plane at a distance of 10 cm from the target at the angles with highest sensitivity to the precession effect, namely at ±60◦ and ±120◦ with respect to the beam axis. To build a setup as compact as possible, all four detectors had to be slightly inclined by 5◦ . A diagram of the Ge-detector setup is shown in Fig. 2.
FIG. 2. Diagram of the geometry of the four MINIBALL cluster detectors used in the experiment. The surfaces of the MINIBALL detectors are shown as seen from the target position. The centers of the cluster surfaces were positioned at angles of ±60◦ and ±120◦ with respect to the beam axis close to the horizontal plane (out-of-plane angles ±5◦ ). In the lower part of the figure the classification of the segments into 14 segment groups on each side of the beam axis is indicated by different shades of gray.
PHYSICAL REVIEW C 89, 054316 (2014) III. EXPERIMENTAL DETAILS AND DATA PREPARATION
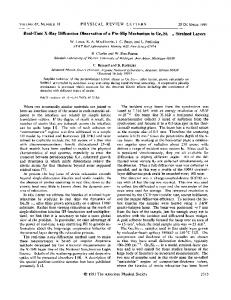
A radioactive 72 Zn beam with an energy of 2.94 MeV/u was produced at the REX-ISOLDE facility [15] at CERN bombarding a UCx target with 1.4-GeV protons delivered by the PS Booster. The beam preparation using the RILIS ion source, REXTRAP, the EBIS ion source, and finally the REX linear accelerator is described in detail in Ref. [16]. The beam intensity was varied during the experiment in the range between 2 × 10⁶ and 107 pps, limited by the buildup of activity in the target area rather than by the available primary beam intensity or the REX performance. The maximum energy that could be delivered by REX was chosen to maximize both the excitation cross section and the expected precession effect. Because the experiment was not aiming for the measurement of transition probabilities based on the observed Coulomb excitation yields, it has not been mandatory to stay below the safe limit for collisions of 72 Zn ions with the carbon target nuclei. The isobaric composition of the beam could not be directly measured during our experiment for technical reasons (incompatibility between the ionization chamber usually employed for this purpose and our target chamber). However, only a few weeks before the present experiment, another MINIBALL run was performed with the same 72 Zn beam during which the beam composition was measured. At that time only a very small 72 Ga contamination was found and we can assume a similar beam composition during our experiment. The data acquisition was triggered by particle-γ coincidences. A time-difference spectrum for signals registered in one of the DSSDs and one of the Ge detectors is shown for Run II in Fig. 3(b). A prompt peak, which corresponds to the coincident detection of a recoiling target ion after Coulomb excitation and the γ -ray emitted in the decay of the excited state, is clearly visible. The significant background level has its origin in random coincidences between elastically scattered ions and γ rays emitted in the β-decay chain 72 Zn → 72 Ga →
FIG. 3. (Color online) (a) Energy vs strip number matrix for the horizontal strips of the Si detector placed above the beam axis. (b) Particle-γ -ray time-difference spectrum. The prompt and background time windows used to construct clean γ -ray spectra are indicated. (c) Particle energy spectrum obtained as projection of the matrix shown in (a).
054316-3
A. ILLANA et al.
PHYSICAL REVIEW C 89, 054316 (2014)
72
Ge. In the next step, Si energy spectra were constructed, requiring a prompt coincidence with a γ ray and subtracting random coincidences using the prompt and background time windows indicated in Fig. 3(b). The resulting two-dimensional matrix obtained for the segmented Si detector positioned above the beam axis is shown in Fig. 3(a). The energy spectra are shown for each of the 16 horizontal strips, with the first being the one closest to the beam axis corresponding to a scattering angle of roughly 20◦ . Three different structures can be distinguished: the diagonal band corresponding to a decreasing energy of the detected particles as a function of the scattering angle and two additional bands with rather constant energies. The first is the typical behavior expected for the target recoils, in this case C ions, after Coulomb excitation in inverse kinematics. However, to understand the origin of the other two structures, prompt particle energy vs γ -ray-energy matrices as shown in Fig. 4(b) have been inspected. As anticipated, the γ rays of 653 and 846 keV corresponding to + + + 72 the 2+ Zn, respectively, 1 → 01 and 41 → 21 transitions in are observed in coincidence with particles over a wide energy range corresponding to recoiling C ions from the Coulomb
excitation reactions. Four additional γ rays with energies of 614, 889, 1044, and 885 keV are observed in the projection of the matrix as shown in Fig. 4(a). These energies correspond to + + + + + + + the 2+ 1 → 01 , 41 → 21 , 61 → 41 , and 02 → 21 transitions 78 in Se. The most probable explanation for the observation of γ rays belonging to 78 Se is the incomplete fusion reaction between the 12 C target ion and the 72 Zn beam. In this reaction, the 12 C ion breaks up into an α particle and 8 Be, the 8 Be fuses with the 72 Zn ion, and 78 Se is populated via the 2n evaporation channel. The high-energy α particle from the breakup is detected in the particle detector. Note that also in our previous experiments using Coulomb excitation in inverse kinematics on a carbon target [17] incomplete fusion reaction channels have been observed. Finally, in prompt coincidence with the low-energy particles we observe one line at 276 keV (compare Fig. 4), which most probably corresponds to the 5/2− → 3/2− transition in 81 Br, populated in the fusion-evaporation reaction 72 Zn + 12 C → 84 Kr∗ → 81 Br + p2n, with the evaporated proton being detected in the Si detector. Completely clean 72 Zn γ -ray spectra can be produced by applying an energy threshold of about 27 MeV in the Si detectors. However, in this case part of the statistics for the + 72 transition of interest, the 653 keV 2+ 1 → 01 transition in Zn, is lost. Because none of the additional lines observed in the spectrum shown in Fig. 4 overlaps with the 653-keV line the full statistics could be used in the analysis of the γ -ray angular correlation and the precession effect discussed below. In total, 1940 and 11 450 counts in the 653-keV line were obtained in the two runs with the thick (Run I) and the thin (Run II) target, + respectively. The intensity of the 846-keV, 4+ 1 → 21 transition, + which feeds the 21 state under study, was determined to be as low as 5% of that of the 653-keV transition depopulating this state. It has therefore been neglected in the determination of g(2+ 1 ) described in the following section. IV. DATA ANALYSIS AND RESULTS
Given the geometry of the Ge-detector setup shown in Fig. 2 it is evident that the analysis of the data, with respect to both the angular correlations and the determination of the precession effect, can be performed in different ways. Each of the three crystals in each MINIBALL detector can be treated as one unit (12 units in the setup), the six segments of each crystal can be considered as units (72 units) or, as a compromise between angular resolution and statistics, the segments can be divided into groups according to their angle θ with respect to the beam axis. The chosen classification of the segments into 28 segment groups comprising either two (20 cases) or four (8 cases) segments each is illustrated in Fig. 2. Obviously, all three approaches, which are called “cores”, “segments”, and “segment groups” in the following, should lead to the same result. Nonetheless, we pursued all three of them as an internal consistency check. FIG. 4. (Color online) (a) Prompt random-subtracted and Doppler-corrected γ -ray spectrum observed in the four MINIBALL detectors in Run II. (b) Prompt random-subtracted and Doppler-corrected particle energy vs γ -ray-energy matrix obtained in Run II.
A. Angular correlations
For the determination of angular correlation coefficients, the data were sorted into spectra containing either the γ rays
054316-4
LOW-VELOCITY TRANSIENT-FIELD TECHNIQUE WITH . . .
Run I
W( )
smaller the size of the considered detector unit is. Limiting the analysis to the cores clearly leads to a smaller anisotropy and consequently lower sensitivity as compared to the analysis in which full advantage is taken of the segmentation of the MINIBALL detectors. The second observation concerns the small differences found between the angular correlations measured in the two runs using the two different targets. For all three analysis methods the resulting anisotropy is smaller when the thinner target is used (Run II). This reduction can be attributed to vacuum deorientation effects which, although relatively small owing to the low average velocity of the 72 Zn ions when leaving the target (about 1.6% of the velocity of light), are still present.
Run II
2
cores
1.5 1 0.5
W( )
0 2
PHYSICAL REVIEW C 89, 054316 (2014)
segment groups
1.5 1 0.5
B. Precession angles
W( )
0 2
In the present analysis, the precession angles are deduced from the double counting ratios, � N ↑ (+θ ) N ↓ (−θ ) ρD (θ ) = , (1) N ↓ (+θ ) N ↑ (−θ )
segments
1.5 1 0.5 0 -180
-90
0 90 (degrees)
180
-90
0 90 (degrees)
180
FIG. 5. (Color online) Angular correlation functions for the + 72 Zn observed in coincidence with C ions 2+ 1 → 01 transition in detected in one of the two Si detectors. Both experimental points (black circles) and fits (red curves) are normalized to a0 = 1 for a better comparison.
observed in a core or an individual segment or a segment group in coincidence with the 12 C target recoils in one of the two Si detectors. The polar angle θ of each core, segment, or segment group was determined from the observed Doppler-shift of the 1017-keV γ ray emitted in the decay of the first excited state in 23 Ne populated in the d(22 Ne,23 Ne)p neutron pickup reaction. For Run I the angular correlation of + the 653-keV, 2+ 1 → 01 transition was directly obtained from the spectra after applying a proper efficiency correction. The resulting curves are shown on the left-hand side of Fig. 5. In Run II the excited 72 Zn ions decayed only after having left the target so that the 653 keV γ -ray is emitted in flight. Therefore, both a Doppler correction of the energy as well as a transformation of angles and counting rates from the laboratory into the rest frame of the nucleus is required, as discussed in detail in Ref. [17]. The angular correlations of + the 2+ 1 → 01 transition after a proper treatment of the data are shown on the right-hand side of Fig. 5. The angular correlation coefficients a2 and a4 are then determined from a fit of the function W (θ ) = a0 {1 + a2 P2 [cos(θ )] + a4 P4 [cos(θ )]} to the data shown in Fig. 5. A closer inspection of this figure leads to two observations. First, for each of the two targets, the observed anisotropy of the angular correlation is larger the higher the angular granularity used in the analysis is. This observation is in agreement with expectations because the geometrical attenuation of the anisotropy, caused by the finite opening angle of the detector, becomes smaller the
where N ↑,↓ (±θ ) are the peak areas of the relevant γ transition observed in a pair of cores, segments, or segment groups positioned at ±θ for the field directions “up” and “down”. The values ρD (θ ) are defined in such a way that they only depend on peak areas and are independent of other experimental factors such as detector efficiencies and integral beam currents for the two field directions. However, knowing that our setup was not perfectly symmetric with respect to the beam axis (compare Fig. 2), we also followed an alternative approach and determined in addition also single counting ratios for all cores, segments, and segment groups which are defined as ρS (θ ) =
N ↑ (+θ ) F, N ↓ (+θ )
(2)
where F is a statistical factor correcting for small differences in the integral number of beam ions for the two different field directions. This correction factor has been determined as the ratio of C ions detected in the Si detectors for field “down” and “up”. The values F = 1.0283(42) and F = 0.9958(15) were obtained for Run I and Run II, respectively. Although the double and single counting rate ratios contain the same information, the data were analyzed both ways for completeness and as an additional consistency check. Finally, so-called symmetric double ratios were calculated that combine the counting rates from pairs of cores, segments, or segment groups positioned at angles differing by 180◦ with respect to the beam axis, � N ↑ (+θ ) N ↓ (θ − 180◦ ) c . (3) ρ (θ ) = N ↓ (+θ ) N ↑ (θ − 180◦ ) These ratios are identical to unity by definition and therefore provide an excellent criterion to judge the quality of the data [18]. The ρ c (θ ) values obtained in the two runs and using the three different analysis methods are summarized in Fig. 6. In all cases the average value is very close to one, indicating that although the geometry of the setup is not perfect, precession
054316-5
A. ILLANA et al.
PHYSICAL REVIEW C 89, 054316 (2014)
Run I
Run II
Run I
Run II 0.1
cores (rad)
0
1.5
c
( )
2
cores 0
-0.15 -0.1
1
-0.3
0.5
-0.2 0.3
0 (rad)
2 1.5
c
( )
segment groups
segment groups
0 -0.4
-0.3
-0.8 0.5
0.4
1 0.5
1.5
c
( )
(rad)
segments
2
-0.6 segments 0.2
0 -0.5
0
-1
-0.2
1 -1.5 -180
0.5 0
45
90 135 (degrees)
45
180
90 135 (degrees)
180
angles can be determined in a reliable way, as described in the following. Based on the experimentally determined single and double counting ratios, the measured effect �(θ ) for the γ transition of interest can now be expressed as ρ(θ ) − 1 . ρ(θ ) + 1
180
-90
-0.4 180
0 90 (degrees)
lation coefficients a2 and a4 and their errors (given in Table II) determined from a fit of the experimental angular correlation functions as discussed in the last section. Maximum slope values of 2.4(1.0) and 1.8(4) are obtained for the thick (Run I) and thin (Run II) target runs, respectively. The precession angles � deduced for the two different runs and using either the spectra of the cores, the individual segments, or the segment groups are shown in Fig. 7. Also included in this figure is an angle-dependent figure of merit defined as
(4)
Finally, the precession angles are calculated from the measured effects �(θ ) and the logarithmic slopes S(θ ) using the relation � = �(θ )/S(θ ).
0 90 (degrees)
FIG. 7. (Color online) Experimental precession angles � for both runs and the three different analysis methods used. The mean values (red) and their uncertainties (gray) are indicated by horizontal lines. The case of nonobservation of any effect (� = 0 mrad) is marked by black horizontal dashed lines. Dotted lines indicate the relative angle-dependent figure of merit, M (see text for details). The values of M have been scaled differently in each of the six cases to maximize the legibility of the figure.
FIG. 6. (Color online) Symmetric double ratios ρ c as a function of the angle θ for both runs and the three different analysis methods used.
�(θ ) =
-90
(5)
The logarithmic slopes S(θ ) = and their corresponding uncertainties are calculated using the angular corre1 dW (θ) W (θ) dθ
M = S 2 (θ )W (θ ).
(6)
+ 72 TABLE II. Angular correlation coefficients a2 and a4 and average precession angles � for the 653-keV, 2+ Zn 1 → 01 transition in observed in the two runs with a thick or a thin target, respectively (compare to Table I). Included are the values obtained using either the spectra of the cores, the individual segments, or the segment groups. For the precession angles, both the values obtained using the formula for the single ratio (SR) [Eq. (2)] and the double ratio (DR) [Eq. (1)] are given (see text for details).
Run I
Cores Groups Segments Modified
� (mrad)
Run II
� (mrad)
a2
a4
SR
DR
a2
a4
SR
DR
0.52(26) 0.74(20) 0.70(21) —
−0.53(30) −0.50(24) −0.62(27) —
−71(20) −67(17) −69(16) −65(17)
−75(23) −71(18) −69(17) —
0.61(25) 0.61(9) 0.73(10) —
−0.32(27) −0.46(11) −0.40(13) —
−30(10) −37(10) −31(9) —
−32(11) −37(10) −33(9) —
054316-6
LOW-VELOCITY TRANSIENT-FIELD TECHNIQUE WITH . . .
M quantifies the sensitivity to the precession of the angular correlation of a detector positioned at the angle θ with respect to the beam axis, taking into account both the logarithmic slope and the counting rate. Figure 7 demonstrates the correlation between the sensitivity (or M) and the uncertainty of the individual data points. Runaway values are mainly observed for detectors positioned at angles with very low sensitivity to the precession. The mean values calculated from the individual data points shown in Fig. 7 are summarized in Table II. This table shows first that the three different analysis methods, based on either the core, the segments, or the segment groups, provide very consistent results for both runs. In the same manner also the use of either single or double counting ratios in the determination of the precession effect does not influence the final result. For the calculation of the g factor in the next section, the precession angles obtained using the individual segments and the single ratios as defined in Eq. (2) are employed. The second observation concerns the magnitude of the measured precession angle. With the thick target used in Run I the induced effect is more than twice as large as with the thinner target employed in Run II. This is, of course, expected because the effective interaction time between the magnetic moment 72 of the 2+ 1 state in Zn and the transient magnetic field during the passage through the ferromagnetic Gd target layer is significantly extended in the case of the thick as compared to the thin target. At this point one more test of the robustness of the experimental result has been performed. In the lower left part of Fig. 5 there may be an indication of nonstatistical effects in the experimental data because the data points taken at most forward angles are systematically lying above the fitted curve. We therefore repeated the fit of the angular correlation as well as the successive analysis steps towards the precession angle for this case, the segment analysis of Run I, neglecting these data points. The resulting value for the precession angle, � = −65(17) mrad (last line of Table II), is slightly different from the value obtained in the standard analysis, � = −69(16) mrad. As briefly mentioned in Sec. II, in the case of the thick target used in Run I a fraction of the excited 72 Zn ions come to rest in the Gd layer of the target. Therefore, before a g factor can be extracted from the measured precession angles using an appropriate parametrization of the TF, the possible contribution of the static hyperfine field for Zn ions in Gd to the total observed precession has to be estimated. The static field for Zn ions in Gd is, to our knowledge, not exactly known. However, in a paper by Fahlander et al. [19] an upper limit of 10 T was adopted, deduced from the systematics of hyperfine fields. Using the same limit for the field strength and taking + into account the lifetime of the 2+ 1 state, τ (21 ) = 17.7(11) ps (average of the values given in Refs. [2] and [3]), an upper limit for the precession angle owing to the interaction with the static field of about 5 mrad can be estimated for g = 0.5. Considering furthermore that only about half of the 72 Zn ions stop in the Gd layer (from kinematics considerations), this number reduces further to 2–3 mrad. Compared to the uncertainties of the precession angles measured in the present work, this contribution is negligible.
PHYSICAL REVIEW C 89, 054316 (2014) C. g factors 72 To deduce the g factor of the 2+ Zn from the 1 state in measured precession angles � listed in Table II, the integral TF precessions per unit g factor for the two different targets have to be calculated using the relation � μN tout � /g = − BTF (t)e−t/τ dt, (7) � tin
where τ is the lifetime of the excited state under study and tin ,tout are the times when the recoiling nuclei enter and leave the ferromagnetic Gd target layer. For the TF strength, we adopted the linear parametrization [12] BTF [v(t),Z] = GaZv(t)/v0 ,
(8)
where a is the field parameter, which in the case of gadolinium as ferromagnetic material is 17 T, Z is the atomic number of the recoiling ion, v(t)/v0 is the velocity of the ion in units of the Bohr velocity, and G is an attenuation factor taking into account the beam-induced reduction of the TF strength. G depends on the average energy loss and the average ion velocity during the passage through the Gd and has been determined as described in the following on the basis of the available experimental information summarized in Ref. [12]. The energies of the 72 Zn beam at the entrance and exit of the Gd layer are 173 and 64 MeV for the thin target (Run II) and 193 and 18 MeV for the thick target (Run I). At these energies, the energy loss is 13.8 and 10.9 MeV/μm for the thin target and 13.9 and 7.1 MeV/μm for the thick target. For the thin target with an average ion velocity of v/Zv0 = 0.167 (compare Table I), the curve for the interval v/Zv0 = 0.14–0.20 in Fig. 3 of Ref. [12] has been inspected in the corresponding stopping power interval, leading to the value G = 0.65(10), which is quite typical for TF experiments with standard targets and stable beams [17]. For the thick target of Run I, however, the curve for the velocity interval v/Zv0 = 0.07–0.10 is the relevant one which in the stopping power interval given above leads to the value of G = 0.9(1). Assuming these values for G, integral precession angles per unit g factor of −144(16) and −61(9) mrad are calculated for the targets used in Run I and Run II, respectively, using Eqs. (7) and (8). Based on these values and the experimental precession angles listed in + Table II, values of g(2+ 1 ) = +0.48(12) and g(21 ) = +0.51(17) are obtained from the two runs. These two values are in excellent agreement and lead to an average value of g(2+ 1)= +0.49(10). One possible source of uncertainty in the approach presented above is the fact that there is no experimental information available concerning the possible dependance of the attenuation factor G on the beam intensity. All information summarized in Ref. [12] comes from stable beam experiments which are usually performed at higher beam intensities as compared to the present experiment in which a radioactive beam has been used. To estimate the maximum uncertainty of our experimental results we repeated the calculation of the g factor assuming larger uncertainties for the attenuation factors, namely G = 0.90(25) and G = 0.65(25) for Runs I and II, respectively. Based on these values and the precession angle
054316-7
A. ILLANA et al.
PHYSICAL REVIEW C 89, 054316 (2014)
TABLE III. Calculated precession angles per unit g factor for the linear parametrization of the TF strength and deduced g factors for the two different runs [columns 2 and 3 assuming G = 0.9(1) and G = 0.65(10) for Runs I and II, respectively, and columns 4 and 5 assuming G = 0.90(25) and G = 0.65(25) instead]. The average g factors from the two runs are given in the last line.
Run I Run II Average
� /g (mrad)
g(2+ 1)
� /g (mrad)
g(2+ 1)
−144(16) −61(9)
+0.48(12) +0.51(17) +0.49(10)
−144(40) −61(23)
+0.45(17) +0.51(24) +0.47(14)
obtained from the modified analysis of the data from Run I (last line of Table II) a final g-factor value of g = +0.47(14) is obtained (compare right part of Table III). The measurements with thick and thin targets provide additional information with respect to the methodological aspect of this work. As discussed in Sec. II the main obstacle to the successful application of the TF technique with short-lived radioactive ion beams is the activity built up in the target region owing to the angular straggling of the beam in the thick multilayer targets. Therefore, a compromise has to be searched for between the magnitude of the precession effect (the thicker the Gd layer the larger the precession angle for a given value of the g factor) and the built-up activity, which limits the beam intensity which can be accepted and therefore the statistics which can be obtained. During the 28 h with beam on the thick target during Run I about 1940 counts in the 653-keV line of interest could be accumulated while keeping the counting rates in the Ge detectors at an acceptable level. During Run II, however, 11 450 counts, that is, nearly a factor of six more, have been obtained, although the measuring time of 42 h was only 50% longer. In this case, however, a higher beam intensity could be employed. It is interesting to note that in the particular case of this experiment the factor of six less statistics obtained in the case of the thick target is overcompensated by the larger precession angle per unit g factor (factor 2.4 as compared to the thin target), as indicated by the slightly smaller relative uncertainty of the final value of the g factor deduced from the data of Run I (see Table III). To study the systematic uncertainty of the g factor result owing to the choice of the TF parametrization used to calculate the integral precession angle per unit g factor [Eq. (8)], we adopted as an alternative the Rutgers parametrization which has been employed in a number of magnetic-moment studies in the past [20–22]. Here a target magnetization of M = 0.183 T was assumed, which corresponds to the average of the measured magnetizations for a number of similar targets prepared before in the same way and in the same target laboratory at the TU M¨unchen (see, for example, Ref. [21]). Because in the Rutgers parametrization, the hyperfine field was calibrated for a velocity range 2 < v/v0 < 8, it is not applicable to the data obtained with the thick target. For Run II an integral precession angle of −56 mrad is obtained with the Rutgers parametrization leading to a slightly larger g factor, g = +0.55(16), although the two approaches give results that are compatible within the experimental uncertainties.
V. DISCUSSION AND INTERPRETATION
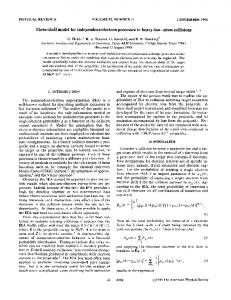
Recently, it has been discussed in detail that the spherical N = 40 gap seems not to be strong enough to stabilize the nuclei in a spherical shape as soon as protons are added to the 68 Ni core. Already for a moderate deformation, the density of Nilsson orbitals is very high, thus providing many possibilities to generate 2+ states via parity-allowed particlehole excitations, as deformation smears out the distinction between the negative and positive parity states below and above the N = 40 spherical gap, respectively. Indeed, in the chain of Zn isotopes, only two protons above semimagic Ni, the B(E2) values increase beyond N = 38, reaching a maximum around N = 42, 44. This behavior, as well as the energies of the first excited 2+ states, are nicely reproduced by recent shell-model (SM) calculations based on a 48 Ca core and the LNPS effective interactions, considering the pf -shell orbits for protons and the 1p3/2 , 1p1/2 , 0f5/2 , 0g9/2 , and 1d5/2 orbits for neutrons [5,24]. A comparison to older SM calculations considering smaller configuration spaces clearly demonstrated that the simultaneous consideration of both proton excitations from the f7/2 orbit across Z = 28 and neutron excitations across N = 40 into the g9/2 and d5/2 orbits is essential for a consistent description of both the B(E2) and the E(2+ 1 ) values of the Zn isotopes below and above N = 40 [5]. Although the B(E2) values can hint at changes in nuclear structure, the admixture of a certain orbital in the nuclear wave function is revealed much more clearly by the gyromagnetic ratio of an individual state. In particular, the g factor of the first excited 2+ state in the Zn isotopes provides direct information on the importance of the g9/2 neutron orbit. If the spherical subshell closure were to persist in the chain of Zn isotopes, one would expect a drop of the magnetic moment of the first excited 2+ state above N = 40 when the g9/2 neutron orbit with its negative effective g factor [gν (g9/2 ) = −0.24] starts being filled. If, however, the N = 40 spherical gap were not to persist in the Zn isotopes, as the B(E2) systematics seems to indicate, g(2+ 1 ) values close to the hydrodynamical limit, Z/A, are expected as observed for most deformed nuclei in which the magnetic moment is dominated by the orbital motion of the protons. For the stable Zn isotopes 64,66,68,70 Zn almost no dependence of the g(2+ 1 ) values on the neutron number has been observed [4], as shown in Fig. 8. All measured g factors are close to the Z/A line. However, the g factor of the first excited 2+ state in 72 Zn, g(2+ 1 ) = +0.18(17), which has recently been measured using the HVTF technique [5], clearly deviates from the hydrodynamical limit. The strong decrease of g(2+ 1) between N = 40 and N = 42 and the small value of g(2+ ) 1 in 72 Zn are reproduced by the shell-model calculation using the LNPS interaction and a 48 Ca core [5,24], which attribute them to an increase of the neutron and a slight decrease of the proton contributions to the 2+ 1 state. Note, however, that the same calculations clearly overestimate the magnitude of the g factors for 66,68 Zn. The calculations based on a 56 Ni core and using the JUN45 interaction [25] predict values close to the collective limit Z/A for 72,74 Zn, while with the JJ4B interactions [26] and the 56 Ni core a smooth decrease of g(2+ 1 ) from the collective values for 64,66 Zn to values around 0.2 in 74 Zn is found.
054316-8
LOW-VELOCITY TRANSIENT-FIELD TECHNIQUE WITH . . .
PHYSICAL REVIEW C 89, 054316 (2014)
0.8
3 2.5 g(21+)/(Z/A)
g(21+)
0.6 0.4
2 1.5 1
0.2 0.5 0
0 30
32
34
36 38 40 neutron number N
42
44
30 32 34 36 38 40 42 44 46 48 50 52 neutron number N
46
FIG. 8. (Color online) Comparison between experimental and theoretical g factors for the first excited 2+ state in even-even Zn isotopes. Experimental results for the stable isotopes are shown as black dots [4], the HVTF result for 72 Zn [5] as a green diamond, the present TF result as a red square, and the average value of the TF and HVTF measurements for 72 Zn as a blue dot. Shell-model calculations using the LNPS [24] (solid black line), JUN45 [25] (dotted line), and JJ4B [26] (dashed line) interactions are included. The thick black line represents the results of the beyond-mean-field calculations for 70,72,74 Zn discussed in the text and the thin black line is the collective value Z/A.
In the present work, a value of g(2+ 1 ) = +0.47(14) was obtained for 72 Zn using the TF technique. This value is significantly larger than the result reported in Ref. [5] and close to both the collective estimate Z/A and the SM calculation using the JUN45 interaction. It is, however, in clear disagreement with the value obtained in the LNPS approach. These observations do not change when the average of the two experimental results for this isotope, gave (2+ 1 ) = +0.35(11), is considered (compare to Fig. 8). To average the two independent experimental values seems justified considering that many of the authors of this work have also been involved in the experiment presented in Ref. [5] and believe that measurements and analysis were performed in the best possible way and therefore trust in both results. To examine the experimental g factors of the Zn isotopes in the context of the neighboring isotopic chains, all measured g(2+ 1 ) values in 30 Zn, 32 Ge, 34 Se, 36 Kr, and 38 Sr isotopes, normalized to the collective value Z/A, are shown in Fig. 9. Most of these values are close to Z/A, with the exception of the ones of the N = 48, 50 isotones in which the 2+ 1 states, owing to the proximity of the N = 50 shell closure, are dominated by single-particle excitations. In particular, for none of the N = 40–44 isotones does the experimental 2+ 1 g factor deviate by more than 25% from the collective value Z/A. As shown in Fig. 9, the average experimental value for 72 Zn fits perfectly into these systematics. The electromagnetic properties of the 30 Zn, 32 Ge, and 34 Se nuclei have been discussed recently in a very detailed way by Niikura et al. [2]. From the inspection of the systematics of excited-state energies, as well as several signatures derived
FIG. 9. (Color online) Measured g(2+ 1 ) values for 30 Zn, 32 Ge, Se, 34 36 Kr, and 38 Sr isotopes [4,27] normalized to Z/A. The gray lines mark a 25% deviation from Z/A.
from them, it was concluded in that work that “all experimental evidence points toward a transition from a spherical oscillator at N = 40 to complete γ -softness at N = 42” in the chain of Zn isotopes. Although the interpretation of 70 Zn40 as a spherical oscillator seems to be in contradiction to the deformation parameter β2 = 0.249(11) deduced for this stable nucleus from the measured inelastic electron-scattering cross sections in Ref. [28], it motivated us to study the characteristics of 70,72,74 Zn using an independent approach. It was our hope that such a study may also shed light on the origin of the 72 disagreement between the experimental g(2+ Zn 1 ) value in and the best available SM calculations, namely, the ones employing the LNPS interaction (cf. Fig. 8). Towards this end we have studied the nuclei 70,72,74 Zn in a beyond-mean-field theory, namely, in the symmetry conserving configuration mixing (SCCM) approach. In this approach the final wave functions are written as a linear combination of strongly correlated symmetry-conserving Hartree-FockBogoliubov (HFB) states. Because the proton and neutron numbers of these isotopes are close to Z = 28 and N = 40, respectively, besides the deformation parameter β, triaxial shapes are important and the γ degree of freedom must be explicitly considered. Our starting HFB wave functions depend parametrically on these parameters; i.e., they are of the form | (β,γ )�. These wave functions are determined in the variation after particle number projection method. In a subsequent step the configuration mixing is performed: A linear combination of angular momentum and particle number projected wave functions corresponding to all shapes in the (β,γ ) plane is built. The coefficients of such an expansion are determined by the Ritz variational principle. In the numerical calculations we generate a grid of 60 states in the (β,γ ) plane. As an interaction we are using the finite-range density-dependent Gogny force with the D1S parametrization [29]. Further details about this method are discussed in Ref. [30]. A first approach to the problem can be obtained by looking at the potential energy surfaces (PES). For this, one performs particle number and angular momentum (with K-mixing)
054316-9
A. ILLANA et al.
PHYSICAL REVIEW C 89, 054316 (2014)
0.8 60
(a)
(deg) 50
0.6
30
11 10 9 1
0
0
0.2
0.4
70
(deg)
0
0
1 0.2
0.4
0.6
20 0.2
10
0
0.6
0 0.8
0
(deg)
0.1
40
10
0
0.2
1 3 5
0
0
0.2
0.4
0.4
0.6
0 0.8
0.6
20
4
11 10 9 0 0.8
2
(deg) 40
0.075 30
0.4
20 0.2
0.025
10
0
0
0.2
0
0.1
50 0.6
0.05
0
7
6
Zn
0.8 60
(f)
30
0.2
0
3
0.075
20
0.025
0.2
2
8 30
0.4
4
0
10
40
74
0.4
0.05
0.6
Zn 50
0.075 30
0.4
3
0.8 60
(e)
0.1
40
0.4
0.2
0
3
72
50 0.6
0
2
11 10 9 7 5 0 0.6 0.8
(deg) 50
6
20 0.2
0.8 60
(c)
8 30
Zn
0.8 60
(d)
0 0.8
0.6
10
40
0.4
4
5 7
3
0.6
6
20 0.2
(deg) 50
8
40
0.4
0.8 60
(b)
10
0.4
0.6
0 0.8
0.05 0.025 0
FIG. 10. (Color online) (Top panels) Contour lines in the (β,γ ) plane of the potential energy surfaces of the ground states of the nuclei Zn in the PNAMP approach. The energy minimum has been set equal to zero for each panel. The contours are 1 MeV apart; only the odd ones have been labeled. (Bottom panels) Normalized collective wave functions of the ground states of the nuclei 70,72,74 Zn in the (β,γ ) plane. The contours are 0.0075 apart (dashed lines) from 0.03 to 0.1 and 0.01 apart from 0.01 to 0.03 (continuous lines). 70,72,74
projection (PNAMP) at each point of the (β,γ ) plane and calculates the corresponding energy. These PESs are plotted in the top panels of Fig. 10. The nucleus 70 Zn, panel (a), is rather soft in the γ degree of freedom. It is also soft in the β degree of freedom, in particular, around the energy minimum and along the prolate axis. In contrast to the interpretation of 70 Zn as spherical oscillator given in Ref. [2], we find an energy minimum at β ≈ 0.3 and γ ≈ 22◦ separated by about 3 MeV from the spherical point. This deformation is in full agreement with the experimental value β2 = 0.249(11) for 70 Zn [28]. The energy minimum of the nucleus 72 Zn is approximately at the same (β,γ ) values as 70 Zn. This nucleus is a bit less soft in the γ degree of freedom than 70 Zn; as a matter of fact, the 1-MeV contour does not close on the prolate axis. Also, in the β direction it is somewhat steeper than 70 Zn. The 3-MeV contour at very small deformation is shifted to larger values and the 7-MeV one at large prolate deformations to smaller β values. This tendency is clearly reinforced in 74 Zn; see panel (c). The contours around the minimum are clearly open to the prolate axis while they remain closed to the oblate axis. Also, in the β degree of freedom this nucleus is steeper, as can be judged by looking at the 5-MeV contour lines at large and small deformations. Its minimum appears now at smaller γ values (12◦ ). In a second step the full SCCM equations are solved and the collective wave functions for the ground states of the nuclei
70,72,74 Zn are shown in the bottom panels of Fig. 10. The wave functions of the 2+ 1 states look rather similar. These collective wave functions are normalized to unity in the (β,γ ) plane. They are distributed over a large range of deformation, the maximum values being concentrated around 0.2 � β � 0.4 and 0◦ � γ � 40◦ . The maxima of the distributions are close to the energy minima of the corresponding PESs. One also observes a predominance of triaxial shapes for 70 Zn and an evolution to prolate shapes with growing mass number. In summary, our triaxial beyond-mean-field study provides no indication of a distinct structural change, for example, from a spherical oscillator in the N = 40 isotope 70 Zn to complete γ softness at N = 42, as proposed in Ref. [2]. The results rather indicate a similar structure of all three studied isotopes. To calculate the g factors of the first excited 2+ states in these nuclei to compare with the experimental results, the wave functions of these states were used in conjunction with Eq. (20) of Ref. [30]. The following values are obtained for the gyromagnetic factors: 0.391 (70 Zn), 0.406 (72 Zn), and 0.408 (74 Zn). Note that in these SCCM calculations the g factors of free protons and neutrons are used without any modifications. The resulting g(2+ 1 ) values are close to the hydrodynamical limit, as somewhat expected considering the considerable deformations predicted by the calculations and in agreement with both the experimental value for stable 70 Zn and the new adopted value for 72 Zn (compare Fig. 8).
054316-10
LOW-VELOCITY TRANSIENT-FIELD TECHNIQUE WITH . . . VI. SUMMARY AND CONCLUSIONS
We presented the results of an experiment dedicated to the measurement of the g factor of the first excited 2+ state in radioactive 72 Zn using the TF technique at REX-ISOLDE (CERN). This has only been the third successful application of this method to a short-lived radioactive beam (T1/2 = 46.5 h). The obtained value, g(2+ 1 ) = +0.47(14), is larger than the result g(2+ 1 ) = +0.18(17) obtained in a previous experiment employing the HVTF method with a high-energy fragment beam. However, the average of the two available experimental values, g(2+ 1 ) = +0.35(11), is close to the collective value and in full agreement with triaxial beyond-mean-field calculations, while it is at variance with the value obtained in the most recent large-scale shell-model calculations using a 48 Ca core and the empirical LNPS interactions [5,24]. Neither the g factor measurement nor the beyond-mean-field calculations discussed here provide any evidence for a structural change
[1] [2] [3] [4] [5] [6] [7] [8] [9] [10] [11] [12] [13] [14] [15] [16] [17] [18]
W. Rother et al., Phys. Rev. Lett. 106, 022502 (2011). M. Niikura et al., Phys. Rev. C 85, 054321 (2012). C. Louchart et al., Phys. Rev. C 87, 054302 (2013). K. Moschner et al., Phys. Rev. C 82, 014301 (2010). E. Fiori et al., Phys. Rev. C 85, 034334 (2012). G. Kumbartzki et al., Phys. Lett. B 591, 213 (2004). N. J. Stone et al., Phys. Rev. Lett. 94, 192501 (2005). A. Davies et al., Phys. Rev. Lett. 96, 112503 (2006). N. Benczer-Koller et al., Phys. Lett. B 664, 241 (2008). G. J. Kumbartzki et al., Phys. Rev. C 86, 034319 (2012). A. E. Stuchbery et al., Phys. Rev. C 88, 051304(R) (2013). K.-H. Speidel, O. Kenn, and F. Nowacki, Prog. Part. Nucl. Phys. 49, 91 (2002). J. Eberth et al., Prog. Part. Nucl. Phys. 46, 389 (2001). N. Warr et al., Eur. Phys. J. A 49, 40 (2013). O. Kester et al., Nucl. Instrum. Methods Phys. Res. B 204, 20 (2003). J. Van de Walle et al., Phys. Rev. C 79, 014309 (2009). J. Walker et al., Phys. Rev. C 84, 014319 (2011). C. Teich et al., Phys. Rev. C 59, 1943 (1999).
PHYSICAL REVIEW C 89, 054316 (2014)
between the N = 40 nucleus 70 Zn and the heavier N = 42, 44 isotopes. ACKNOWLEDGMENTS
This work has been supported by the Spanish Ministerio de Ciencia e Innovaci´on under Contracts No. FPA2009-13377C02 and No. FPA2011-29854-C04 and the Spanish Project MEC Consolider-Ingenio 2010, Project No. CDS2007-00042. Furthermore, we acknowledge support by the German BMBF under Contracts No. 05P12RDCIB, No. 05P12RDFN8, No. 05P12PKFNE, No. 06KY205I, No. 06KY9136I, and No. 06DA7047I and by the European Union Seventh Framework Programme through ENSAR, Contract No. 262010. Finally, we would like to thank Silvia Lenzi for fruitful discussions about the shell-model calculations and the mechanics workshops at the IEM-CSIC and the UAM for their excellent work.
[19] C. Fahlander, K. Johansson, and G. Possnert, Z. Phys. A 291, 93 (1979). [20] D. M¨ucher et al., Phys. Rev. C 79, 054310 (2009). [21] G. G¨urdal et al., Phys. Rev. C 88, 014301 (2013). [22] N. Benczer-Koller and G. J. Kumbartzki, J. Phys. G: Nucl. Part. Phys. 34, R321 (2007). [23] A. E. Stuchbery (private communication). [24] S. M. Lenzi, F. Nowacki, A. Poves, and K. Sieja, Phys. Rev. C 82, 054301 (2010). [25] M. Honma, T. Otsuka, T. Mizusaki, and M. Hjorth-Jensen, Phys. Rev. C 80, 064323 (2009). [26] A. F. Lisetskiy, B. A. Brown, M. Horoi, and H. Grawe, Phys. Rev. C 70, 044314 (2004). [27] N. J. Stone, INDC(NDS)-0594, 2011, http://www-nds.iaea.org/ publications/indc/indc-nds-0594/ [28] R. Neuhausen et al., Nucl. Phys. A 263, 249 (1976). [29] J. F. Berger, M. Girod, and D. Gogny, Nucl. Phys. A 428, 23c (1984). [30] T. R. Rodr´ıguez and J. L. Egido, Phys. Rev. C 81, 064323 (2010).
054316-11