843
Original Article
LUKASIEWICZ LOGIC BASED FUZZY SIMILARITY CLASSIFIER FOR DENVER GROUP CHROMOSOMAL CLASSIFICATION UTILIZANDO LÓGICA DE LUKASIEWICZ BASEADA EM SIMILARIDADE FUZZY NA CLASSIFICAÇÃO DE CROMOSSOMOS DO TIPO DENVER GROUP Rajaraman SIVARAMAKRISHNAN1; Chokkalingam ARUN2 1. Assistant Professor, Department of Biomedical Engineering, Sri Sivasubramaniya Nadar College of Engineering, Kanchipuram, India.
[email protected]. 2. Professor, Department of Electronics and Communication Engineering, RMK College of Engineering and Technology, Kavarapettai, India.
ABSTRACT: This paper proposes a novel P1-weighted Lukasiewicz Logic based Fuzzy Similarity Classifier for classifying Denver Group of chromosomes and compares its performance with the other classifiers under study. A chromosome is classified to one of the seven groups from A to G, based on the Denver System of classification of chromosomes. Chromosomes within a particular Denver Group are difficult to identify, possessing almost identical characteristics for the extracted features. This work evaluates the performance of supervised classifiers including Naive Bayes, Support Vector Machine with Gaussian Kernel (SVM), Multilayer perceptron (MLP) and a novel, unsupervised, P1-weighted Lukasiewicz Logic based Fuzzy Similarity Classifier, in classifying the Denver Group of chromosomes. A fundamental review on fuzzy similarity based classification is presented. Experimental results clearly demonstrates that the proposed P1-weighted Lukasiewicz Logic based Fuzzy Similarity Classifier using the generalized Minkowski mean metric, produces the best classification results, almost identical to the Ground Truth values. One-way Analysis of Variance (ANOVA) at 95% and 99% level of confidence and Tukey’s post-hoc analysis is performed to validate the selection of the classifier. The proposed P1-weighted Lukasiewicz Logic based Fuzzy Similarity Classifier gives the most promising classification results and can be applied to any large scale biomedical data and other applications. KEYWORDS: P1-weighted. Lukasiewicz logic. Fuzzy similarity. Denver group. Classification. ANOVA. Naive bayes. Support vector machine with gaussian kernel (SVM). Multilayer perceptron (MLP). Ground truth. Minkowski mean. Tukey’s post-hoc INTRODUCTION The closeness of features between the various intra-group Chromosome classes imposes a challenge on the classification stage of Automatic Karyotyping. This results in improper identification of Chromosomes and a reduction in accuracy of classification (BIYANI et al., 2005). Automatic Chromosome classification has been an extensively researched topic over the last several decades and is a problem in which a pattern vector is associated with one of the 24 Chromosome classes. Like the other pattern recognition problem, the success depends on the effectiveness of underlying feature representation (CAROTHERS; PIPER, 1995; RITTER; SCHREIB, 2001; RITTER; GAO, 2008). A survey of classification methods used for classification of Chromosomes indicate that Statistical algorithms and Neural Networks are the most popular tools for classification though a variety of other classifiers using Fuzzy logic Classifiers and other methods have also been used (WANG et al., 2009). Statistical techniques such as Bayes classifier are also used in the classification of chromosomes (GROEN et al., 1989; PIPER et al., 1980; PIPER; GRANUM, 1989; RITTER;
Received: 15/07/13 Accepted: 05/12/13
GAGGERMEIER, 1999; SCHWARTZKOPF et al., 2005; WU; Castleman, 2000; WU et al., 2005). Artificial Neural Networks were also used as a classification tool (JENNINGS; GRAHAM, 1993; LERNER et al., 1995). Transportation algorithm and homologue matching technique were also used in classifying the chromosomes (STANLEY et al., 1998; ZIMMERMAN et al., 1986). Even though matching of Chromosomes using their homologues was performed, the method does not apply in the presence of numerical aberrations. A Fuzzy rule base for classification is proposed in the literature for chromosomal classification (HONGBAO et al., 2012). Classification using homologue matching is based on the assumption that a normal cell has 46 Chromosomes with all Chromosomes having a pair or homologue with the exception of the sex Chromosomes. The classification process involves Neural Network, Centromeric Index and band pattern checking and homologue matching. A survey of literature on the classification methods employed for classifying the Chromosomes show that most of the work propose a multitude of features in spatial, subspace and transform domains with an expectation that they will improve the accuracy of classification (WANG et al., 2009, WU
Biosci. J., Uberlandia, v. 30, n. 3, p. 843-852, May/June, 2014
844 Lukasiewicz Logic based...
SIVARAMAKRISHNAN, R.; ARU, C.
et al., 2005). Nevertheless, Neural Networks with many layers are the most often deployed tool for classification in many of these works. Probabilistic methods like Bayes classifier rely on a huge data set available to construct the probability density functions of various classes. The drawback of neural networks is that they require enormous training and also the structure is very complex for identification of all the 24 Classes of Chromosomes. Thus, the motivation of this work is to evolve a classification method that involves the least number of features and a method for simple and adaptable classification with reduced computational time and memory requirements. This paper proposes a novel P1-weighted Lukasiewicz Logic based Fuzzy Similarity Classifier for classifying Denver Group of chromosomes and compares its performance with the other classifiers under study. A chromosome is classified to one of the seven groups from A to G, based on the Denver System of classification of
chromosomes. This work evaluates the performance of supervised classifiers including Naive Bayes, Support Vector Machine with Gaussian Kernel (SVM), Multilayer Perceptron (MLP) and a novel, unsupervised, P1-weighted Lukasiewicz Logic based Fuzzy Similarity Classifier, in classifying the Denver Group of chromosomes. A fundamental review on fuzzy similarity based classification is presented. MATERIAL AND METHODS Data Acquisition and Processing In human beings, the 22 autosomes and 2 sex Chromosomes are divided into seven Denver groups from A to G based on the similarity of features (Table 1). The two adjacent chromosome classes within the same group will have overlapping features, making it difficult to separate them using a simple linear decision boundary without compromising on error.
Table 1. Denver grouping of chromosomes Chromosome Class Size Relative Position of the Centromere Large Metacentric Group A (1 – 3) Large Sub-metacentric Group B (4 -5) Medium Sub-metacentric Group C (6 – 12, X) Medium Acrocentric Group D (13 – 15) Relatively Short Sub-metacentric Group E (16 – 18) Short Metacentric Group F (19 – 20) Short Acrocentric Group G (21 – 22, Y) Chromosome images are obtained from the standardized chromosome database, made available by the Laboratory of Biomedical Imaging, University of Padova, Italy (GRISAN et al., 2009; LBI, 2012). The chromosomes are imaged at a resolution of 8 bits/pixel using an optical microscope and are in the Pro-metaphase stage of cell division. An expert cytogenetist has performed manual karyotyping after accounting for polarization issues. The geometrical features including the Relative Length (RL) and Centromeric Index (CI) are calculated for each chromosome. A
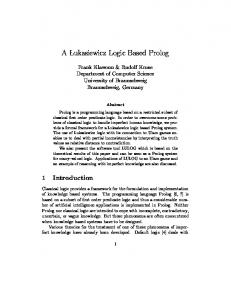
Medial Axis Transform (MAT) is applied to extract the medial axis of the chromosome (MORADI; KAMALEDIN, 2006). At the Centromere point, the width of the line perpendicular to the medial axis will be at the minimum and made up of uniform grey levels and the contour of Chromosome exhibits extreme concavity. The effect of thinning and skeletonization of the chromosome to obtain the medial axis is shown (Figure 1A). The spurs removed by the pruning operation that gives a clear medial axis of the chromosome (Figure 1B).
Figure 1. A) Thinning and skeletonization operation B) Pruning to give a clear medial axis
Biosci. J., Uberlandia, v. 30, n. 3, p. 843-852, May/June, 2014
845 Lukasiewicz Logic based...
SIVARAMAKRISHNAN, R.; ARU, C.
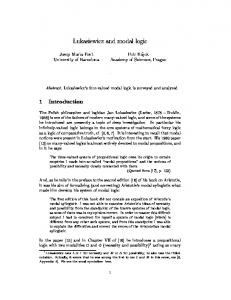
The shortest segment perpendicular to the Medial axis gives the location of the centromere. The intersection of the shortest segment and Medial axis is taken as the point separating the long arm (P) and short arm (Q) of the chromosome. The feature measured from location of centromere is the CI, given by, Where ‘LP’ is the length of the ‘P’ arm and ‘LQ’ is the length of the ‘Q’ arm. The methodology is applied to human chromosomes 17 and 18 and the
shortest perpendicular segment, marked with a yellow dot gives the location of the centromere (Figure 2). The principal chromosome features calculated for the various ‘Denver Group’ of Chromosomes are shown (Table 2). The table reveals that the value of features including the RL and CI overlaps among the intra-group chromosomes, making it extremely difficult to classify the individual chromosomes in a linear fashion.
Figure 2. Centromere position obtained with the shortest perpendicular segment to the medial axis from ‘a’ to ‘b’ Table 2. Chromosome features with the corresponding class and ‘Denver’ Group RL (Pixel length) CI (%) Class Denver Group Mean Interval Mean Interval 8.44 8.007-8.873 48.36 47.194-49.526 1 A 8.02 7.623-8.417 39.23 37.406-41.054 2 A 6.83 6.515-7.145 46.95 45.393-48.507 3 A 6.30 6.016-6.584 29.07 27.203-30.937 4,5 B 5.90 5.636-6.164 39.05 37.385-40.715 6 C 5.36 5.089-5.631 39.05 37.279-40.821 X C 5.12 4.859-4.811 33.95 31.707-36.193 7 C 4.93 4.669-5.191 34.08 32.105-36.055 8 C 4.80 4.556-5.044 35.43 32.871-37.989 9 C 4.59 4.369-4.811 33.95 31.707-36.193 10 C 4.61 4.383-4.837 40.14 37.812-42.468 11 C 4.66 4.448-4.872 30.16 27.821-32.499 12 C 3.74 3.502-3.976 17.08 13.853-20.307 13 D 3.56 3.331-3.789 18.74 15.144-22.336 14 D 3.46 3.246-3.674 20.30 16.598-24.002 15 D 3.36 3.177-3.543 41.33 38.590-44.070 16 E 3.25 3.065-3.437 33.86 31.089-36.631 17 E 2.93 2.776-3.094 30.93 27.886-33.974 18 E 2.67 2.496-2.844 46.54 44.241-48.839 19 F 2.56 2.395-2.725 45.45 42.924-47.976 20 F 1.90 1.730-2.070 30.89 25.888-35.982 21 G 2.04 1.858-2.222 30.48 25.548-35.412 22 G 2.15 2.013-2.287 27.17 23.988-30.352 Y G Lukasiewicz Fuzzy Logic
Biosci. J., Uberlandia, v. 30, n. 3, p. 843-852, May/June, 2014
846 Lukasiewicz Logic based...
SIVARAMAKRISHNAN, R.; ARU, C.
Fuzzy Logic deals with reasoning, a ManyValued (MV) logic that deals with more than two truth values, the values lying in the range [0, 1] (ESTEVA; GODO, 2001). The principal advantage of Fuzzy Logic is that it offers semantic information about the classification task by allowing partial membership of the class. Fuzzy Logic uses linguistic variables; the degree of membership is managed by specific functions (RAMOT et al., 2003). Lukasiewicz, in 1920, studied Fuzzy Logic as an infinite valued logic, where the linguistic variables were used to express the rules and facts (LUKASIEWICZ, 1970). Lukasiewicz logic uses the t-norm, given by, Lukasiewicz Fuzzy Logic uses this t-norm as a standard semantic to represent strong conjunction. In t-norm fuzzy logic, the semantics assume values in the real unit interval [0, 1] for the t-norms to interpret conjunctions (ESTEVA; GODO, 2001). The proposed P1-weighted Lukasiewicz logic based Fuzzy similarity classification makes use of the Lukasiewicz equivalence relation given by, where ‘F’ is the function and ‘a’ and ‘b’ are the input variables. Fuzzy Similarity using Lukasiewicz Logic Assuming a set ‘X’ of ‘m’ samples, if the similarity values of the features f1, f2, …….. , fm are known, the sample with the highest similarity value is easily chosen. The problem is to find a similar object ‘Xj’ for an object ‘Xi’, where . A total of ‘m’ number of similarities are obtained by comparing the two samples, X1 and X2, by choosing the Lukasiewicz structure, given by, (LUKASIEWICZ, 1970). Using the Lukasiewicz logic with a generalized Minkowski mean metric (MACERATA; Corso, 1996), the similarity measure can be defined as,
According to Lukasiewicz, different non-zero weights are given to different features to satisfy the condition,
Where gives the equivalence relation in accordance to the generalized Lukasiewicz structure (LUUKKA, 2009). A weighted similarity measure using the generalized Lukasiewicz structure with Minkowski Mean metric is given by,
Steps involved in Fuzzy Similarity based Classification Let us assume classifying a set ‘X’ of samples into ‘N’ diverse classes X1, X2, ………., XN by their respective features. Let the number of features f1, f2, …….. , fn be given by the value ‘t’ and the magnitude of the features are normalized to be present in the range [0, 1]. The classified samples will then be vectors belonging to [0, 1] N. A parameter called ‘ideal vector’ is calculated for every class ‘i’ (LUUKKA, 2009). Let us consider, Vi = (v(f1), v(f2), v(f3), ……… , v(fN)) be the ideal vectors calculated for a subset Xi of vectors, X = (x(f1), x(f2), x(f3), ….., x(fn)), belonging to class ‘Xi’. The value of the ideal vector is then calculated as,
The value of ‘m’ is calculated from the generalized mean and is constant for all values of ‘i’ (LUUKKA, 2009). The value #Xi denotes the number of samples in the class ‘i’. The ideal vectors are calculated and the arbitrary chosen sample is assigned to a particular class by comparing its value with that of the ideal vector for that particular class ‘i’. This comparison is done by means of comparing the similarity using the generalized structure of Lukasiewicz and is given by,
The value of ‘p’ is obtained from the generalized Lukasiewicz structure and the weight ‘Wr’ is the factor emphasizing the importance. A decision is then made on a particular sample ‘X’ belonging to class ‘i’, as, That is, the sample having the highest similarity to that of the ideal vector to that particular class will be assigned to that appropriate class. The membership of the classes are defined using a Lukasiewicz structure that stresses that the mean value of the similarity is by itself a similarity and the structure depends strongly on the first order logic (TURUNEN, 1999).
Biosci. J., Uberlandia, v. 30, n. 3, p. 843-852, May/June, 2014
847 Lukasiewicz Logic based...
SIVARAMAKRISHNAN, R.; ARU, C.
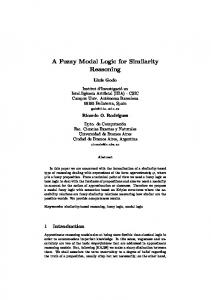
The proposed work starts with data fuzzification where the data is scaled to the range [0, 1]. A mean vector, also called the ideal vector (Vi), is calculated for each class. The sample is classified to the class with the highest similarity value of the ideal vector and test vector using the P1-weighted Lukasiewicz logic. The algorithm takes a test element, a learning set, and data dimensions as its input and the optimized weight values ‘W’ and power values ‘p’ for the P1-weighted Lukasiewicz logic. The classifier is tested with different weight and power values for the chromosome dataset of interest. Different values of ‘W’ and ‘p’ had different effects in classification. A significant advantage of the proposed classifier is that always weight ‘W’ and power ‘p’ values can be found that
classifies instances with the same or better accuracy than by using a fixed value. Experiments results reveal that the best results are achieved with a weight value ‘W’ of 0.5 and power ‘p’ of ‘1’ for the chromosomal dataset under consideration. Hence, the proposed classifier is named the P1-weighted Lukasiewicz Logic based Fuzzy Similarity Classifier. The optimized value of weights ‘W’ and power values ‘p’ are found using Particle swarm Optimization (PSO), an evolutionary computation algorithm that optimizes non-linear functions effectively using the particle swarm methodology (ZHIHUA et al., 2010). The methodology for optimizing weights ‘W’ (Figure 3) and the power value ‘p’ using PSO is shown (Figure 4).
Figure 3. Flowchart showing weight ‘W’ optimization using PSO
Figure 4. Power value optimization using PSO
Biosci. J., Uberlandia, v. 30, n. 3, p. 843-852, May/June, 2014
848 Lukasiewicz Logic based...
SIVARAMAKRISHNAN, R.; ARU, C.
Criteria for Performance Evaluation The performance of the classifiers including Naive Bayes, SVM, MLP and the proposed P1Table 3. Classifiers description Classifier Naive Bayes SVM MLP P1-weighted Lukasiewicz Logic based Fuzzy Similarity Classifier
Description A simple probabilistic classifier using Bayes' theorem with naive assumptions of independence A non-probabilistic binary linear classifier using Gaussian Kernel A feed-forward, back-propagation algorithm based ANN with a single hidden layer Proposed Fuzzy Similarity based classifier with Lukasiewicz logic and Minkowski Mean metric
The classification process involves a 10-fold cross-validation where the training set is divided into 10 equal sized folds. The performance of the classifier is measured to identify the degree of agreement of the actual class to the predicted class. The performance measures for a classifier are tabulated (Table 4). For a perfect classifier, the Table 4. Classifier performance measures Parameter Positive Negative True Positive True Negative False Positive False Negative True Positive Rate (TPR) (or) Sensitivity (or) Recall (R) False Positive Rate (FPR) True Negative Rate (TNR) (or) Specificity (S) Precision (Pr) F-Score
weighted Lukasiewicz Logic based Fuzzy Similarity Classifier is evaluated. A short description of the classifiers is given (Table 3).
performance measures are as follows: True Positive Rate (TPR) (or Recall (R) = 1, False Positive Rate (FPR) = 0, Precision (Pr) = 1, F Score (or) FMeasure = 1, and Accuracy = 1. These values are considered, the Ground Truth values and the performance of the classifiers of our interest is evaluated against these values.
Description Total number of positive instances Total number of negative instances Number of positive instances, classified as positive Number of negative instances, classified as negative Number of negative instances, classified as positive Number of positive instances, classified as negative Proportion of positive instances, correctly classified as positive Proportion of negative instances, erroneously classified as positive Proportion of negative instances, correctly classified as negative Proportion of instances, classified as positive that are really positive Measure combining Precision and Recall
RESULTS Validation with One-way ANOVA and Tukey’s post-hoc Analysis The selection of the best classifier is validated using One-way Analysis of Variance (ANOVA). The test is performed to analyze the degree of variation present in the experiment. Hypothesis testing is done to verify that the variations in the experiment do not exceed that due
Notation P N TP TN FP FN TP/P FP/N TN/N TP/(TP+FP) (2*P*R)/(P+R)
to the normal variation in the characteristics of the samples and their environmental errors (D'ARCO et al., 2012). One way ANOVA is used to determine the presence or absence of statistically significant differences in the parameters like Pr, R, TPR, FPR and F-Score, between the four classifiers of interest. Since we are evaluating only a single factor every time, we call it one-way ANOVA. The Null Hypothesis (H0) is that the means are all equal and is given by,
Biosci. J., Uberlandia, v. 30, n. 3, p. 843-852, May/June, 2014
849 Lukasiewicz Logic based...
SIVARAMAKRISHNAN, R.; ARU, C.
Where M1, M2, M3, and M4 are the means of the parameters respectively for the proposed P1weighted Lukasiewicz logic based Similarity Classifier, SVM, Naive Bayes and MLP. The alternate hypothesis (H1) is that at least one of the means is different and is given by, For one – way ANOVA, the trials need to be randomized and the trials are conducted for each of the classes in the Denver group of interest. The default value of 0.05 (95% confident) is chosen to test the hypothesis and the results are also verified for 0.01 level of significance (99% confident). The samples follow normal distribution within each population and are independent and random in nature. Different populations have different mean values and the standard deviation is assumed to be the same for all the populations. The F-statistic and ‘P’ is found using the one-way ANOVA. The value Fcrit is the one, the test statistic ‘F’ should exceed to reject the Null Hypothesis (H0). The ‘P’ value of one-way ANOVA explains the significance of variation, the difference between the two samples. The value of ‘P’ less than 0.05 (95% confident) is considered significant and the null hypothesis (H0) is rejected. The value ‘F’ is a test statistic given by, If the F-statistic is significantly large and if the value F > Fcrit, the null hypothesis (H0) is rejected.
In the proposed work, a significant main interaction is thus found from the experimental results and a conclusion is made that there is a significant difference in performance amongst the classifiers. A post-hoc analysis needs to be performed to still isolate exactly where the significant differences lie (LASOTA et al., 2011). Here, Tukey’s post-hoc analysis is performed to find the significant differences. For the four classifiers of interest, the significant F-value is followed using the Tukey’s Post-hoc test. The differences between the means of all of the four classifiers for the particular parameter are found. The difference value is compared to the critical value to determine the significance in difference. This critical value is called the ‘Honestly Significant Difference’ (HSD), the point where the mean difference becomes significantly different. The consolidated results of one-way ANOVA and Tukey’s Post-hoc test for the classifiers of interest, for diverse parameters including Recall, Precision, F-score, and False Positive Rate are shown (Table 5). The analysis is carried out using the VassarStats online module for Statistical Computation (VASSARSTATS, 2013). The values for the parameters are given for each class of chromosomes in the Denver group of interest. Denver group A (Chromosome class (1 – 3)) is taken for experimental evaluation and the results are tabulated.
Table 5. Consolidated results of one-way ANOVA and Tukey’s post-hoc test Parameter Proposed SVM Naive MLP ANOVA Summary Fuzzy Bayes F FC P Classifier Pr
1 0.975 0.967
0.913 0.859 0.917
0.863 0.891 0.815
0.803 0.798 0.836
Mean Variance
0.981 (M1) 0.0003
0.897 (M2) 0.0010
0.857 (M3) 0.001
0.813 (M4) 0.001
Std. Error
0.0100
0.0186
0.022
0.012
TPR (or) R
1 0.966 0.975
0.882 0.874 0.933
0.849 0.824 0.891
0.824 0.798 0.815
Mean
0.980 (M1) 0.0003
0.896 (M2) 0.0010
0.854 (M3) 0.001
0.812 (M4) 0.000
Variance
18.9
7.59
0.0005
23.3
4.07
0.0003
Tukey HSD Test
HSD[0.05] = 0.07; HSD[0.01] = 0.1 M1 Vs M2, P< 0.05 M1 Vs M3, P< 0.01 M1 Vs M4, P< 0.01 M2 Vs M3, NonSignificant M2 Vs M4, P< 0.05 M3 Vs M4, NonSignificant HSD[0.05] = 0.07; HSD[0.01] = 0.09 M1 Vs M2, P< 0.05 M1 Vs M3, P< 0.01 M1 Vs M4, P< 0.01 M2 Vs M3, NonSignificant
Biosci. J., Uberlandia, v. 30, n. 3, p. 843-852, May/June, 2014
850 Lukasiewicz Logic based...
SIVARAMAKRISHNAN, R.; ARU, C.
Std. Error
0.0101
0.0185
0.019
0.007
FPR
0 0.013 0.017
0.042 0.071 0.042
0.067 0.050 0.101
0.101 0.101 0.080
Mean Variance
0.010 (M1) 0.0001
0.052 (M2) 0.0003
0.073 (M3) 0.001
0.094 (M4) 0.000
Std. Error
0.0050
0.0098
0.015
0.007
F-Score
1 0.971 0.971
0.897 0.867 0.925
0.856 0.856 0.851
0.813 0.798 0.826
Mean Variance
0.981 (M1) 0.0002
0.896 (M2) 0.0008
0.854 (M3) 0.000
0.812 (M4) 0.000
Std. Error
0.0097
0.0168
0.002
0.008
DISCUSSION One-way ANOVA and Tukey’s Post-hoc test has revealed that the proposed P1-weighted Lukasiewicz Logic based Fuzzy Similarity Classifier outperforms the other classifiers in classifying the Denver Group of chromosomes. One-way ANOVA test reveals that the value of F statistic is very much less than Fcrit, the value of ‘P’ < 0.05 ( 95% confidence) and ‘P’ < 0.01 (99% confidence) so that the null hypothesis (H0) is rejected and the alternate hypothesis (H1) is accepted. To further identify where the significant changes lie, the Tukey’s Post-hoc test is performed. The test for the Pr parameter reveals that the proposed P1-weighted Lukasiewicz Logic based Fuzzy Similarity Classifier is highly significant at 95% and 99% confidence level, than the other classifiers of interest. The results also reveal that
13.2
4.07
0.0018
46.8
4.07
0.0001
M2 Vs M4, P< 0.05 M3 Vs M4, NonSignificant HSD[0.05] = 0.04; HSD[0.01] = 0.06 M1 Vs M2, P< 0.05 M1 Vs M3, P< 0.01 M1 Vs M4, P< 0.01 M2 Vs M3, NonSignificant M2 Vs M4, P< 0.05 M3 Vs M4, NonSignificant HSD[0.05] = 0.05; HSD[0.01] = 0.07 M1 Vs M2, P< 0.01 M1 Vs M3, P< 0.01 M1 Vs M4, P< 0.01 M2 Vs M3, NonSignificant M2 Vs M4, P< 0.01 M3 Vs M4, NonSignificant
there is no significant difference in performance between the SVM and Naive Bayes classifier in classifying the Denver group of chromosomes. The test for TPR, R, and FPR reveal that the proposed P1-weighted Lukasiewicz Logic based Fuzzy Similarity Classifier gives the best classification results than the SVM, Naive Bayes and MLP. When FPR and F-Score are taken into account, there is no significant difference in performance noted between the Naive Bayes classifier and MLP. The comparison of the weighted average of the parameter values to the Ground Truth values is shown (Table 6) and the results clearly reveal that the values are almost identical to the Ground Truth values. The proposed P1-weighted Lukasiewicz Logic based Fuzzy Similarity Classifier thus, gives the best classification results in comparison to the other classifiers under study.
Table 6. Comparison of the proposed classifier with Ground Truth values Parameter Proposed Similarity Classifier Ground Truth Value 0.980 1 TPR 0.010 0 FPR 0.981 1 Pr 0.980 1 R 0.981 1 F-Score
Biosci. J., Uberlandia, v. 30, n. 3, p. 843-852, May/June, 2014
851 Lukasiewicz Logic based...
SIVARAMAKRISHNAN, R.; ARU, C.
CONCLUSIONS A novel P1-weighted Lukasiewicz Logic based Fuzzy Similarity Classifier is presented for the classification of Denver Group of chromosomes. The algorithm proves to be very effective in classifying the chromosomal dataset of our interest. Where normal similarity based classification is not ideal for non-linear datasets, best results are achieved with the proposed P1-weighted
Lukasiewicz Logic based Fuzzy Similarity classifier. The study also reveals that the proposed fuzzy similarity classifier is extremely useful in classifying non-linear, overlapping medical data where the boundaries are overlapping and not clear. The principle advantage of this classifier is that it offers semantic information about the classified instances by allowing partial class memberships.
RESUMO: Este trabalho propõe uma nova lógica P1pondera de Lukasiewicz de acordo com o classificador de similarida fuzzy para classificar cromossomas do Grupo Denver e compara o seu desempenho com os outros classificadores em estudo. Um cromossoma é classificado com um dos sete grupos de A a G, com base no Sistema de Denver de classificação de cromossomos. Cromossomos dentro de um grupo de Denver particular são difíceis de identificar, com características quase idênticas para os recursos extraídos. Este trabalho avalia o desempenho de classificadores supervisionados, incluindo Naive Bayes, Support Vector Machine com Gaussian Kernel (SVM), perceptron multicamadas (MLP) e um novo classificador sem supervisão, P1-weighted, lógica de Lukasiewicz de acordo com o classificador de similaridade Fuzzy para a classificação do Grupo Denver de cromossomos . Apresenta-se ma revisão fundamentada na classificação de acordo com similaridade difusa. Resultados experimentais demonstram claramente que Classificador Similaridade Fuzzy proposto de acordo com a lógica de Lukasiewicz P1-weighted usando a médica métrica de Minkowski para produz melhores resultados de classificação. Estes valores foram muito similares aos valores de Ground Truth . Análise de variancia (ANOVA) com 95% de grau de confiança e análise post-hoc de Tukey 99% foram realizadas para validar a seleção do classificador. Este classificador P1-weighted de lógica de Lukasiewicz está de acordo com o classificador de similaridade difusa oferecendo resultados declassificação mais promissoras. Portanto, podendo ser aplicado a dados biomédicos em larga escala além de outras aplicações. PALAVRAS-CHAVE: P1-weighted , Lógica de Lukasiewicz. Fuzzy similarity , Denver Group, Classificação ANOVA , Naive Bayes ,. Support Vector Machine com núcleo gaussiano, (SVM) , Multilayer Perceptron (MLP) , Ground truth. Média Minkowski , Tukey post-hoc
REFERENCES BIYANI, P.; WU, X.; SINHA, A. Joint classification and pairing of human Chromosomes. IEEE/ACM Trans Comput Biol Bioinf, v. 2, n. 2, p. 102-109, Apr 2005. CAROTHERS, A.; PIPER, J. Computer-aided classification of human Chromosomes: a review. Stat Comp, v. 4, n. 3, p. 161-171, Sep 1994. D'ARCO, M.; LICCARDO, A.; PASQUINO, N. ANOVA-Based Approach for DAC Diagnostics. IEEE Trans Instrum Meas, v. 61, n. 7, p. 1874-1882, Jul 2012. ESTEVA, F.; GODO, L. Monoidal t-norm based logic: Towards a logic of left-continuous t-norms. Fuzzy Set Syst, v. 124, n. 1, p. 271-288, Dec 2001. GRISAN, E.; POLETTI, E.; RUGGERI, A. Automatic segmentation and disentangling of chromosome in Qband prometaphase images. IEEE Trans Inf Technol Biomed, v. 13, n. 4, p. 575-581, Jul 2009. GROEN, C. A.; KATE, K.; SMEULDERS, A. W. M.; YOUNG, T. Human Chromosome classification based on local band descriptors. Pattern Recogn Lett, v. 9, n. 1, p. 211-222, Apr 1989. JENNINGS, A. M.; GRAHAM, J. A neural network approach to automatic Chromosome Classification. Phys Med Biol, v. 38, n. 7, p. 959-970, Jul 1993.
Biosci. J., Uberlandia, v. 30, n. 3, p. 843-852, May/June, 2014
852 Lukasiewicz Logic based...
SIVARAMAKRISHNAN, R.; ARU, C.
HONGBAO, C.; HONG-WEN, D.; YU-PING, W. Segmentation of M_FISH Images for Improved Classification of Chromosomes with an Adaptive Fuzzy C-means clustering algorithm. IEEE Trans Fuzzy Syst, v. 20, n. 1, p. 1-8, Feb 2012. LABORATORY OF BIOMEDICAL IMAGING (LBI), University of Padova, Italy, November 2009. Available at: http://bioimlab.dei.unipd.it. Accessed 15 April 2012. LASOTA, T.; TELEC, Z.; TRAWINSKI, B.; TRAWINSKI, K. Investigation of the ets evolving fuzzy systems applied to real estate appraisal. J Mult-Valued Log S, v. 17, n. 3, p. 229-253, Feb 2011. LERNER, B.; GUTERMAN, H.; DINSTEIN, I.; ROMEM, Y. Medial axis transform-based features and a neural network for human Chromosome classification, Pattern Recogn, v. 28, n. 11, p. 1673-1683, Nov 1995. LUKASIEWICZ, J. Selected works. Amsterdam: North-Holland Pub. Co., 1970. 405p. LUUKKA, P. Similarity classifier using similarities based on modified probabilistic equivalence relations. KBS-Elsevier, v. 22, n. 1, p. 57-62, Jan 2009. MACERATA, Del Corso, Michelassi, Varanini, Taddei, Marchesi. An interactive clustering procedure for selection of high dimension patterns. In: Computers in Cardiology, Indianapolis, 1996. p. 369-372. MORADI, M.; KAMALEDIN, S. New features for automatic classification of human Chromosomes. Pattern Recogn Lett, v. 27, n. 1, p. 19-28, Jan 2006. PIPER, J.; GRANUM, E. On fully automatic feature measurement for banded Chromosome classification. Cytometry, v. 10, p. 242-255, May 1989. PIPER, J.; GRANUM, E.; RUTOVITZ, D.; RUTTLEDGE, H. Automation of Chromosome Analysis, Sig Proc, v. 2, n. 3, p. 203-221, Jul 1980. RAMOT, D.; FRIEDMAN, M.; LANGHOLZ, G.; KANDEL, A. Complex Fuzzy Logic. IEEE Trans Fuzzy Syst, v. 11, n. 4, p. 450-461, Aug 2003. RITTER, G.; GAGGERMEIER, K. Automatic classification of Chromosomes by means of quadratically asymmetric statistical distribution. Pattern Recogn, v. 32, p. 997-1008, Dec 1999. RITTER, G.; SCHREIB, G. Using dominant points and variants for profile extraction from Chromosomes. Pattern Recogn, v. 34, n. 4, p. 923-938, Apr 2001. RITTER, G.; GAO, L. Automatic segmentation of metaphase cells based on global context and variant analysis. Pattern Recogn, v. 41, n. 1, p. 38-55, Jan 2008. SCHWARTZKOPF, W. C.; BOVIK, A. C.; EVANS, B. L. Maximum-likelihood techniques for joint segmentation–classification of multispectral Chromosome images. IEEE Trans Med Imag, v. 24, n. 12, p. 1593-1610, Dec 2005. STANLEY, R. J.; KELLER, J. M.; GADER, P.; CALDWELL, C. W. Data-driven homologue matching for Chromosome identification. IEEE Trans Med Imag, v. 17, n. 3, p. 451-462, Jun 1998. TURUNEN, E. Mathematics behind fuzzy logic-Advances in soft computing. Heidelberg: Physica-Verlag, 1999, 191p. VASSAR STATS STATISTICAL COMPUTATION WEBSITE (VASSARSTATS). April 2005. Available at: http://www.vassarstats.net/. Accessed 9 June 2013.
Biosci. J., Uberlandia, v. 30, n. 3, p. 843-852, May/June, 2014
853 Lukasiewicz Logic based...
SIVARAMAKRISHNAN, R.; ARU, C.
WANG, X.; ZHENG, B.; LI, S.; MULVIHILL, J. J.; WOOD, C.; LIU, H. Automated classification of metaphase Chromosomes: Optimization of an adaptive computerized scheme. J Biomed Inform, v. 42, n. 1, p. 22-31, Feb 2009. WU, Kenneth Castleman. Automated Chromosome classification using wavelet based band pattern descriptors. In: proceedings of the IEEE Symposium on Computer-Based Medical Systems, 2000, USA. p. 189–194. WU, Q.; LIU, Z.; CHEN, T.; XIONG, Z.; CASTLEMAN, K. Subspace-based prototyping and classification of Chromosome images. IEEE Trans Image Process, v. 14, n. 9, p. 1277-1287, Sep 2005. ZHIHUA, C.; XINGJUAN, C.; ZENG, J.; YIN, Y. PID-Controlled Particle Swarm Optimization. J MultValued Log S, v. 16, n. 6, p. 585-610, Dec 2010. ZIMMERMAN, S. O.; JOHNSTON, D. A.; ARRIGHI, F. E.; RUPP, M. E. Automated homologue matching of human G-banded Chromosomes, Comput Biol Med, v. 16, n. 3, p. 223-233, Jun 1986.
Biosci. J., Uberlandia, v. 30, n. 3, p. 843-852, May/June, 2014