arXiv:astro-ph/0105501v1 29 May 2001. Astronomy & Astrophysics manuscript no. (will be inserted by hand later). Lumpy Structures in Self-Gravitating Disks.
Astronomy & Astrophysics manuscript no. (will be inserted by hand later)
Lumpy Structures in Self-Gravitating Disks
arXiv:astro-ph/0105501v1 29 May 2001
Daniel Huber, Daniel Pfenniger Geneva Observatory, CH-1290 Sauverny, Switzerland Received February 2000 / Accepted May 2001 Abstract. Following Toomre & Kalnajs (1991), local models of slightly dissipative self-gravitating disks show how inhomogeneous structures can be maintained over several galaxy rotations. Their basic physical ingredients are self-gravity, dissipation and differential rotation. In order to explore the structures resulting from these processes on the kpc scale, local simulation of self-gravitating disks are performed in this paper in 2D as well as in 3D. The third dimension becomes a priori important as soon as matter clumping causes a tight coupling of the 3D equations of motion. The physically simple and general framework of the model permits to make conclusions beyond the here considered scales. A time dependent affine coordinate system is used, allowing to calculate the gravitational forces via a particle-mesh FFT-method, increasing the performance with respect to previous direct force calculations. Persistent patterns, formed by transient structures, whose intensity and morphological characteristic depend on the dissipation rate are obtained and described. Some of our simulations reveal first signs of mass-size and velocity dispersion-size power-law relations, but a clear scale invariant behavior will require more powerful computer techniques. Key words. Methods: numerical - Galaxies: structure, ISM - ISM: structure
1. Introduction Classical gravity is scale free, i.e., self-gravitating systems may form similar structures on different scales. Indeed, observations of the interstellar medium, spiral disks and cosmic structures, do reveal similar characteristics. Although the structures in these systems are lumpy and inhomogeneous, they do not seem yet completely random. The observations of molecular clouds reveal hierarchical structures with power-law behavior over several orders of magnitude in scale (Larson 1981, Scalo 1985, Falgarone et al. 1992, Heithausen et al. 1999). Larson (1978) found first hints that the power-law relation between velocity dispersion and size is also valid for stellar populations and that it extends beyond the size of Giant Molecular Clouds. Several observations confirm that the hierarchical structure of kinematically cold media is not only present in Milky Way molecular clouds, but is also found in other systems and on larger scales. For examples, Vogelaar & Wakker (1994) found perimeter-area correlations in highvelocity clouds; power-law power spectra of HI emission were found in the Small and the Large Magellanic Cloud by Stanimirovic et al. (1999, 2001), and Elmegreen et al. (2000), respectively; measurements of the HI distribution in galaxies of the M81 cluster reveal fractal structures on the galaxy disc scale (Westpfahl et al. 1999). On cosmic scales, up to about 100 Mpc, matter is also hierarchically organized. A common feature of the ISM
and the cosmic structure is that the matter distribution can be characterized by a comparable fractal dimension. The cosmic and the interstellar fractal dimensions are, DGalaxies ≈ 2 ± 0.2 (Sylos Labini et al. 1998, Joyce et al. 1999) and DISM ≈ 1.6 − 2.3 (Elmegreen & Falgarone 1996, Combes 1998), respectively. Thus the precise value of the fractal dimension does not seem to be universal, but a range between 1 and 2 appears frequent. All this may suggest that a general scale free factor is mainly responsible for the matter distribution and the dynamics of cosmic structures, galactic disks and molecular clouds. Only one factor appears to be dominant over all these scales, namely gravity. Gravo-thermal experiments on isolated systems show that typically two possible states are reached asymptotically, a high energy homogeneous state and a low energy collapsed state, with a halo-core structure (Lynden-Bell & Wood 1968, Hertel & Thirring 1971, Aronson & Hansen 1972). Thus to produce more inhomogeneous structures selfgravitating systems must be open, such as be subjected to time dependent boundary conditions. On cosmic scales the Hubble flow represents a time dependent boundary condition, and develops lumpy structures. On galactic scales down to molecular cloud scales an energy flow, maintaining the system out of equilibrium, may be sustained by the shear-flow and small scale dissipation. Indeed, gravita-
2
D. Huber, D. Pfenniger: Lumpy Structures in Self-Gravitating Disks
tional instabilities convert directed kinetic energy (shearflow) into thermal and turbulent motion (von Weizs¨acker 1951, Goldreich & Lynden-Bell 1965). Turbulent motion may then transport the energy through the scales until it is dissipated away by radiation in molecular collisions and shocks. The lumpy distribution of matter reported by Toomre (1990) and Toomre & Kalnajs (1991, hereafter TK) in local shearing-sheet experiments of disks reminds us of the ubiquitous inhomogeneous state of the ISM as well as the flocculent structures of many spirals. The relevance of these experiments for galaxies is supported by the recurring spirals found in slightly dissipative complete self-gravitating disk simulations by Sellwood & Carlberg (1985) and many others (e.g., Miller, Prendergast & Quirk 1970). The TK models confirm that purely self-gravitating systems with time-dependent boundary conditions can produce very chaotic inhomogeneous structures. Here, in order to investigate in more detail the matter distribution produced by self-gravitation, shear and dissipation we perform further such local shearing-sheet experiments. To check if the resulting structures reveal power-law relations we calculate the power-law indices of the mass-size and the velocity dispersion-size relation. To compare with earlier models, in particular with those of TK, we start with 2D simulations and extend then the model to 3 dimensions. This extension is important because as soon as dense clumps develop in a disk with horizontal sizes comparable to or smaller than the supposed thickness of the disk, motion transverse to the plane must be strongly coupled to the motion in the plane, and the 2D approximation is no longer valid. To obtain instructive models it is important not to include too many ingredients. We are primarily concerned not with complex physical objects such as molecular clouds, but with processes. So our approach is not to include a maximum of physical ingredients, but just the ones that appear as the most relevant. We want to check if selfgravitation in combination with time-dependent boundary conditions and a slight dissipation can produce and maintain an inhomogeneous, lumpy and eventually self-similar structures, resembling those observed in galactic disks and molecular clouds. The considered scales are of the order of O(1−10) kpc. Thus the transition regime between the molecular cloud scale (≈ 0.05 kpc) and the galactic disk scale (≈ 10 kpc) can be investigated. However, since the model is scalefree, we can draw conclusions beyond the here considered scales and thus eventually contribute to illustrate the scaling laws observed in sub- or extra-galactic structures. Preliminary results of our numerical experiments were presented in Huber & Pfenniger (1999, 2001). Since then we continued to improve our model and to collect more experience, which led to new insights with respect to the clustering simulation and scaling laws. In this paper we discuss in detail the model and the results. Similar studies have been presented by Semelin (Semelin 1999, Semelin & Combes 2000).
In the next section, we justify the use of dissipative particles in order to model the dynamics of self-gravitating gas. The numerical model in presented in Sect. 3 and a pseudo-code is given in Appendix A. In Sect. 4 we discuss the methods used to analyze the structures resulting from our shearing box simulations. The results of the 2D and 3D simulations are presented in Sect. 5. Finally, Sect. 6 is dedicated to discussing limitations of the models.
2. Physical Gas Model 2.1. Hierarchical Systems For a hierarchical self-similar structure, one can define a fragmentation efficiency (Scalo 1985), f = ηmL−1 /mL ,
(1)
where mL−1 and mL are the mean masses of a fragment at level L − 1 and L, respectively. The factor η is the number of fragments formed at each level. The fragmentation efficiency f indicates how much mass in a clump is concentrated in subclumps. If f is not very high (< 95%), the smallest fragment masses become negligible after a few levels and a hierarchical description is less relevant. However, if f is very high, several iteration steps can be carried out and the bulk mass is still concentrated in the smallest subclumps. As long as the bulk mass is concentrated in subclumps the interclump mass can be neglected. For convenience we call the smallest clumps for which the interclump medium can be neglected basic-clumps. If the level of the basic clumps is zero, a clump at level L is formed by η L basic clumps. Observations of the interstellar medium reveal a highly inhomogeneous and clumpy structure (see, eg., Dame et al. 2000, Tauber et al. 1991, St¨orzer et al. 2000). Moreover the structure is for a certain scale range hierarchical. Assuming that the size of particles is larger or equal to the size of the basic gas clumps, the structure of the interstellar medium can be described correctly down to the scale of the particles by the distribution of these particles. A particle represents then the lowest resolvable level, while clumps at higher levels, i.e., at larger scales are represented by an ensemble of particles.
2.2. Dissipative Particles At the here considered scales, larger than tens of pc, the description of the dissipative processes taking place in the ISM is very complex and far from respecting the hypotheses allowing the full application of Navier-Stokes equations. Thus the use of a traditional hydrodynamic code is in no way “better” than the simpler approach adopted by TK, where a simple small drag parameter is all what is introduced as dissipation. Indeed, we recall the following considerations: 1.) Being long range, gravity breaks the fundamental assumption made in classical thermodynamics that interactions are short ranged. In turn, when gravity is sufficiently
D. Huber, D. Pfenniger: Lumpy Structures in Self-Gravitating Disks
strong (i.e., the Jeans’ instability threshold is reached), supersonic chaotic motion is expected, as also systematically reported for the interstellar medium. This means that no local pressure equilibrium is reached at the scales over which turbulence exists. Down to the smallest scale at which supersonic turbulence exists no local thermodynamical equilibrium can be established, and thus no equation of state can be defined. A basic assumption allowing to derive the usual Navier-Stokes equations of fluid dynamics is missing. Besides, numerous observational evidences indicate non-thermal cloud clumps. For instance, Beuther et al. (2000) carried out multi-wavelength observations and compared the line ratios with radiation transport models. They found that models based on the assumption of a local thermodynamical equilibrium (LTE) can not reproduce the observed data set. Due to the lack of a LTE down to smallest scales, thermal physics appears as an inappropriate tool to represent the statistical state of interstellar gas. 2.) Fundamentally the Navier-Stokes fluid equations describe a) the local conservation of mass and momentum, with b) additional constraints such as local smoothness of the quantities subject to differentiation, c) an equation of state for closing the moment equations derived from Boltzmann’s equation, and d) phenomenological laws describing viscous forces. While the mass and momentum conservation laws are likely to be adapted even for such a clumpy medium as the ISM, the other constraints do not. In this context the energy equation is little relevant (is not a constraint) if no control can be performed on radiative processes, which operate on very short time-scale in the cold ISM. Since large but clumpy entities such as molecular clouds have a mean-free path much larger than their size, the dynamics of such systems may as well, in the present state of understanding, be described by semicollisional, dissipative particles (Brahic 1977, Pfenniger 1998). Casoli & Combes (1982) studied the formation of giant molecular clouds through cloud collisions and coalescence in the molecular ring. They found that the ensemble of clouds never reaches a steady state. Thus they concluded that clouds are better described by particles than by a fluid. Another hint that the usual fluid equations are not better adapted to describe the ISM than sticky particles is that the rings in barred galaxies are never reproduced by the former but easily by the latter (e.g., Schwarz 1984). 3.) In the ISM not only the cooling and heating processes are rapid with respect to global dynamics, but also the energy reservoir of global dynamics is much larger than the other available energy reservoirs represented by gas pressure, stellar radiation, cosmic rays, or magnetic fields (Pfenniger 1996). The virial theorem, expressing a balance of negative and positive energy reservoirs, is a useful tool to order the importance of respective physical factors according to their quantitative values. Since the energy budget at the galactic scale is dominated by dynamics, to first order the system is well described by conserva-
3
tive dynamics, and dissipative effects are of second order. In weakly dissipative systems the stable periodic orbits and fixed points of the conservative case are transformed into attractors, and chaotic orbits typically converge toward strange attractors with similar chaotic properties. Therefore one can naturally infer that the exact dissipative force is irrelevant as long as it remains weak, since the long term behavior is an attractor. The dissipative perturbation is weak when during the time-scale of interest the energy dissipated is small with respect to the total energy of the system. Therefore in this regime it is not necessary to know precisely how energy is dissipated, any weak factor leads to the same attractors (see Pfenniger & Norman 1990 for an extended discussion on the topic). These considerations show that weakly dissipative particles are a permissible method to study the dynamics of interstellar gas at sufficiently large scales. The mass and momentum conservation is granted by the equations of motion, and the weakly dissipative regime by a simple linear friction law.
3. Numerical Model In previous studies of shearing sheet disks, the forces of the self-gravitating particles were computed by direct summation. Instead, we show that by using a time-dependent affine coordinate system we can represent the shear-flow in periodic coordinates. Consequently we can increase the computation performance by calculating the selfgravitational forces with the popular FFT-convolution.
3.1. Principle Here we explain the principle of the local model for the 3D case. Ignoring all expressions with a z, yields the 2D case. In a local model of a disk, everything inside a box of a given size is simulated, and more distant regions in the plane are represented by replicas of the local box (Toomre & Kalnajs 1991, Wisdom & Tremaine 1988, Salo 1995). The global galactic disk attraction made by components such as stars or dark halo not included in the local box is 1.) cancelled to zeroth order by adopting a rotating frame, and 2.) corrected to first order by the linear terms in the epicycle κ and vertical frequency ν (Binney & Tremaine 1994). In the same spirit as TK, the matter in the box has an undefined mass composition with a slight dissipation. For a normal spiral each particle may be considered as a mixture of stellar mass and gas, with mean weak dissipation. The origin of the particle coordinates in the local box is a reference point that moves on a circular orbit at distance R0 from the galactic center with the orbital frequency Ω0 = Ω(R0 ). In their model, TK used a rotating Cartesian coordinate system. The horizontal particle positions are then given by x = R − R0 , y = R0 (θ − Ω0 t) and the vertical location by z. If x, y, z ≪ R0 , the orbital motion of the particles is determined by Hill’s approximation of
4
D. Huber, D. Pfenniger: Lumpy Structures in Self-Gravitating Disks
Newton’s equations of motion (Hill 1878). In the present context, they read: x ¨ − 2Ω0 y˙ = 4Ω0 A0 x + Fx y¨ + 2Ω0 x˙ = Fy z¨ = −ν 2 z + Fz ,
(2)
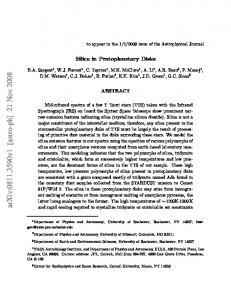
where A0 = − 21 R0 (dΩ/dR)R0 is the Oort constant of differential rotation. Fx , Fy and Fz are local forces due to the self-gravitating particles, that should be small with respect to the global force field. Like TK and Griv et al. (1999) we use these equations also for simulation zones, where x, y, z ≪ R0 is not valid for the most part, i.e., for galactic disc scales, meaning that non-linear higher order effects are not taken into account. However, since much of the gravitational force in any wavy disturbance stems from the nearest particles (TK, Julian & Toomre 1965, Toomre 1964), the conclusions of the model should be relevant for galactic disks, despite the violation of the linearity hypothesis. Indeed, the swing amplification theory, whose applicability to spirals has been well established, is based on the same assumptions. In a Cartesian coordinate system (x, y, z) the positions of the rectangular boxes (local simulation box and replicas) change with time due to the differential rotation dΩ0 /dx. The differential rotation causes a shear-flow, which reads for a flat rotation curve, y˙ = Ω0 x. Thus a particle at (x, y, z) has images at (x + nLx , y − nLx Ω0 t + mLy , z), where n and m are integers (Wisdom & Tremaine 1988). Lx , Ly and Lz are the sides of the local box. An initially (t = 0) periodic arrangement of the boxes relative to a fixed Cartesian coordinate system can not be maintained (see Salo 1995). As a consequence the forces of the self-gravitating particles have been determined in previous simulations by direct summation with upper and lower cut-offs, meaning that the computation time for N particles is proportional to N 2 . However we can improve the performance by computing the forces in the Fourier space with the convolution method and the FFT algorithm (Press et al. 1986). Thereby the potential computation time is reduced to be proportional to Nc log(Nc ), where Nc is the number of cells, taken here as proportional to the number of particles. The FFT approach requires a system spatially isolated and/or periodic at all times. Here the system, representing the local dynamics of a disk, is isolated in z-direction. In the x − y− plane the system is periodic, but only on affine coordinate systems whose pitch angles change periodically. The dark box in Fig. 1a represents the local box in a Cartesian coordinate system (solid mesh). In the initial state a certain local particle (star in the dark box) and its replicas (stars outside the box) are periodic relative to the Cartesian coordinate system. But then the particles are shifted by the shear and the periodicity relative to a rectangular coordinate system is lost. However because the shear is linear in x there is for all times an affine coordinate system (x′ , y ′ , z ′ ) on which the system is periodic.
Thus we modify our initially rectangular coordinate system with a time dependent pitch angle. The solid mesh in Fig. 1a-c represents an affine coordinate system in which the periodicity of the system is maintained. Its pitch angle is, αb ≤ 0, for all times. Thus we call this coordinate system for convenience the backward mesh. The inclination of the backward mesh ab is determine by the shear, ab = tan αb = [(−Ω0 t) mod(Ly /Lx )] ,
(3)
Fig. 1c shows the system at t = Ly /(Lx Ω0 ). We can see that the periodic arrangement of the particle images corresponds to those in Fig. 1a. Consequently the system is again periodic on a rectangular coordinate system and we can replace the backward mesh in Fig. 1c with the one in Fig. 1a. Thus the inclination of the affine coordinate system jumps at t = Ly /(Lx Ω0 ) from ab = Ly /Lx to ab = 0. This accounts for the modulo function in Eq. (3). Thus, if Lx /(Ly Ω0 ) is a multiple of the time-step, only a finite number of affine coordinate systems is necessary. As a consequence the corresponding kernels must be computed only once at the beginning of the simulation and stored for subsequent use. For the computation of the forces of the self-gravitating particles one coordinate system in which the matter distribution is periodic at all times would in principle be enough (e.g., the backward mesh). However, in order to avoid discontinuities in the force field when the inclination of the coordinate system ab jumps back to zero, we compute the forces additionally in a second affine coordinate system, in which the system is periodic as well. The dashed mesh in Fig. 1a-c represents this second coordinate system. Because its pitch angle is always, af > 0, we call it the forward mesh. The inclination of the forward mesh af can be deduced from those of the backward mesh by: af = tan αf = ab + (Ly /Lx ) ,
(4)
The light box in Fig. 3.1 is the local computation box of the forward mesh. After the computation of the forces F ′ in both coordinate systems, we add them with weighting factors in order to soften the effects of the abrupt transition at t = Ly /(Lx Ω0 ) on the force field. The forces computed in the forward and the backward mesh are Fb′ and Ff′ , respectively. Before adding the forces with the corresponding weighting factors, we transform them to Cartesian coordinates, Fb′ → Fb , Ff′ → Ff . The single components of the forces are transformed as follows: ′ Fi,x = Fi,x ′ ′ Fi,y = Fi,y + aFi,x ′ Fi,z = Fi,z ,
(5)
where i = b, f for the backward, respectively for the forward mesh. Then the forces are weighted and added, F = bFb + f Ff . The weighting factors b and f are normalized (b + f = 1) and proportional to the mesh inclination, b = −ab Lx /Ly . Because forces are additive such a weighted force summation is permissible. The forces F correspond now to those in Eq. (2). That is, the inclined
D. Huber, D. Pfenniger: Lumpy Structures in Self-Gravitating Disks
a.)
5
c.)
b.) Orbital Motion
forward mesh backward mesh
GC
*
*
*
*
*
*
* *
*
*
*
* *
*
*
*
*
*
*
*
*
*
*
*
*
*
*
*
*
*
*
*
*
* *
*
*
*
*
*
* *
*
*
*
Ly
*
x) y/L
=
t igh
rct
we
an
(L
igh
t = f=
0
Lx
=a α
f
tan
b=
we
weight = f = 1 αf = 0
arc
tan
(-L
y/2
)
(-L
Lx
an x)
y/L
b=
1/2
t=
b=
igh
t=
we
igh
rct
weight = b = 1
= f
arc
=a αb
αb = 0
)
Lx
/2 Ly
(
we
α α
1/2
f=
0
Fig. 1a-c. The dotted frame represents a section of the disk, being infinite in two directions, seen from above. The two meshes are affine coordinate systems on which the mass distribution is periodic. The dark and the light box represent the local computation box in affine coordinates, i.e., in the forward and the backward mesh respectively. a: The initial state of the two meshes (t = 0). The inclinations of the meshes are ab = 0 and af = (Ly /Lx ). Thus the corresponding weighting factors are b = 1 and f = 0, respectively. Consequently, the forces in the Cartesian coordinates are for this situation, F = Fb . Below the two meshes, the pitch angles of the affine coordinate systems are indicated, αf and αb , respectively. The angle between the two meshes remains the same at all times (αf + αb = arctan(Ly /Lx )). b: The meshes and the weighting factors at t = Ly /(2Lx Ω0 ). It is valid, ab = −Ly /(2Lx ) = −af and thus F = Fb /2 + Ff /2. c: When the meshes reach these inclinations (t = Ly /(Lx Ω0 )), they jump back to the positions shown in (a) and the process starts again without introducing discontinuities in the dynamics.
coordinate system are only used to compute the forces of the self-gravitating particles with the convolution method; then they are transformed to a Cartesian coordinate system. The evolution of the system in the Cartesian coordinate system is given by Eq. (2). The weighting described above, not only softens the effect of the abrupt change in time of the pitch angles, but also minimizes asymmetry effects due to the mesh inclinations. Asymmetry effects disappear for example com-
pletely when the inclination of one of the meshes is zero or when both meshes have the same inclination. In the first case (Fig. 1a) the weighting factor of the uninclined mesh is one and thus the forces are computed exclusively in the rectangular coordinate system. In the second case (Fig. 1b) the asymmetry effects in both inclined coordinate systems cancel each other out. In an inclined coordinate system the gradient ∇ depends on the inclination. This must be taken into account
6
D. Huber, D. Pfenniger: Lumpy Structures in Self-Gravitating Disks
by the calculation of Fb′ and Ff′ . The Euler-Lagrange equations yield then the forces in an affine coordinate systems, ′ Fi,x ′ Fi,y ′ Fi,z
∂Φ ∂Φ = ai ′ − ′ ∂y ∂x ∂Φ ∂Φ = −(1 + a2i ) ′ + ai ′ ∂y ∂x ∂Φ = − ′ , ∂z
(6)
where i = {b, f } for the backward, respectively for the forward mesh.
3.2. Canonical Equations Pfenniger & Friedli (1993) shown that the use of a leapfrog finite difference approximation of Newton’s equations in a rotating reference frame with non-canonical variables lead to instability (“complex instability”) in the sense of von Neumann. This is not the case when canonical variables are used, then the stability or instability character is conserved between the leap-frog algorithm and the orbits. Therefore our model uses these equations. The canonical equations of motion with the momenta {px , py , pz } are, x˙ = px + Ω0 y y˙ = py − Ω0 x
(7)
z˙ = pz ,
and p˙x = (4Ω0 A0 − Ω20 ) x + Fx + Ω0 py p˙y = −Ω20 y + Fy − Ω0 px p˙z = −ν 2 z + Fz .
(8)
These equations are invariant under the linear transformation x y px py .
→ → → →
x y px py
+ kx − 2A0 t kx + ky + 2A0 Ω0 tkx − Ω0 ky + (Ω0 − 2A0 )kx
(9)
where kx and ky are arbitrary numbers. Thus, whenever a particle leaves the local box Lx × Ly × Lz in the x or ydirection and its image enters somewhere on the opposite side (in the affine meshes the image enters exactly at the opposite face), we also have to transform the canonical momenta and their time derivatives correspondingly to the rules given above.
3.3. Kernel For the 2D simulations we use an isotropic interaction potential. However, in order to resolve the flat disk vertically an anisotropic kernel is necessary due to computational limits. Thus most of the 3D simulations are carried out with an anisotropic kernel having the form of a parallelepiped.
3.3.1. Isotropic Kernel In affine coordinates the softened isotropic interaction potential has the form, � � (1+a2 )x2 +y 2 +2axy 1 : r≤ε 2 2ε 3 − ε Φ= (10) 1 : r>ε, r
where a is the mesh inclination and ε is the softening length. The advantage over a Plummer potential, used by TK and many others, is that this potential become a correct 1/r gravitational potential beyond the softening length. Thus there is no sum up of small errors of the gravitational force due to the many distant particles as in the case of a Plummer potential (Dehnen 2000).
3.3.2. Anisotropic Kernel The simulation box, representing local dynamics of a disk galaxy on the kpc scale, is rather flat (Lz ≪ Lx , Ly ). Thus our 3D-model needs an anisotropic force resolution and consequently an anisotropic kernel. This will be explained more exactly in the following. To calculate the forces of the self-gravitating particles we use a particle-mesh method. This method consists of three steps. First, the particle masses are assigned to the nodes of a mesh, which we call simulation mesh. We do this in accordance with the cloud-in-cell (CIC) scheme (see, e.g., Hockney & Eastwood 1981). The masses at the nodes of the simulation mesh can be considered as new particles representing the mass distribution of the original particles. Second, the forces for the new particles are calculated on the simulation mesh nodes via the convolution method (Hockney & Eastwood 1981): e ijk = K e ijk ρeijk Φ −1 e e Φ=Φ ijk ,
(11) (12)
−1 where e and e e are the Fourier and the inverse Fourier transform, respectively. Kijk is the kernel and ρijk is the mass density at a simulation mesh node r′ijk . If the mesh has Nx × Ny × Nz nodes then i = 1, . . . , Nx , ; j = 1, . . . , Ny ; k = 1, . . . , Nz . The apostrophe ′ indicates that the mesh is defined in inclined coordinates. The forces can now be calculated via Eqs. (6). Finally the forces are interpolated at the original particle positions. In order to avoid singularities and to approximate better physical objects self-gravitating particle are considered to have an extent and consequently a softened potential. Pfenniger & Friedli (1993) optimized the softening by adapting the particle extent as well as possible to the cell shape of the simulation mesh. In their polar-mesh simulations they approximated the cell shapes with a uniform triaxial ellipsoid. Here we adopt the particle extent to the cell shape as well. At a given time the cell shapes are all
D. Huber, D. Pfenniger: Lumpy Structures in Self-Gravitating Disks
simulation mesh
new particle mesh (see Fig. 2). The positions are given in affine coordinates r ′ = (x′ , y ′ , z ′ ). In order to calculate the kernel the following coordinate transformation is thus carried out,
new particle mesh α: pitch angle α
7
x′ = x ,
lx
y ′ = y − ax ,
z′ = z ,
(14)
where a is the the inclination of the affine coordinates. The inclination is fixed by the pitch angle, a = tan α. Consequently the denominator in Eq. (13) has the form | r ′ijk − r ′uvw |=
′ 2 ((1 + a2 )(x′i − x′u )2 + (yj′ − yv′ )2 + (zk′ − zw ) +
2a(x′i
*
ly
Ly
lu
lx
x′i = (i −
yj′ = (i −
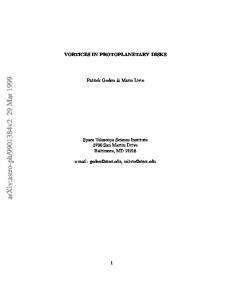
Lx Fig. 2. 2D representation of the simulation mesh and the new particle mesh depicting the discrete particle realization. The star indicates the origin. To calculate the kernel Kijk at the node (i, j, k) of the simulation mesh, one has to sum up over all mass points. The mass points are represented by dots in the cell centers of the new particle mesh. identical, typically, because of the shear, a non-rectangular parallelepiped. In the orthogonal case the corresponding analytical form of the potential is known (McMillan 1958). The analytical expression of such a potential is however quite cumbersome. Moreover we need also to describe the non-rectangular case. Thus we use a discrete realization of the particle mass. To this end we distribute the mass of the new particles over a refined discrete mesh having the same size as a cell of the simulation mesh. We call the refined mesh, new particle mesh. Simulation mesh and new particle mesh are shown in Fig. 2. To calculate the ′ kernel Kijk at position rijk one has to sum up over all mass points of the discrete particle realization, Nu X Nv X Nw X
u=1 v=1 w=1
|
r′ijk
1 , − r ′uvw |
−
yv′ ))1/2
(15)
.
Since the kernel needs to be evaluated only once for every possible inclination the cost of this procedure remains negligible. Because the cell size of the simulation mesh determines the particle extent, the softening is automatically fixed by the choice of the simulation mesh. It is important that the origin of the kernel represents the center of the simulation box in order to avoid a nonzero temporal mean velocity of the center of mass, which is introduced by an asymmetric description of the centrifugal ′ = (x′i , yj′ , zk′ ) are fixed as force. Thus the positions rijk follows:
lv
Kijk =
−
x′u )(yj′
(13)
where Nu × Nv × Nw is the number of mass points representing a particle and r′uvw are the cell-centers of the
zk′
= (i −
Nx 2 )lx Ny 2 )ly Nz 2 )lz
: i = 1, . . . , Nx : j = 1, . . . , Ny
(16)
: k = 1, . . . , Nz ,
where lx × ly × lz is the size of a simulation mesh cell. The positions representing the discrete mass distribution of the new particles ruvw = (xu , yv , zw ) are: Nu +1 2 )lu Nv +1 (v − 2 )lv (w − Nw2+1 )lw
x′u = (u − yv′
=
′ zw
=
: u = 1, . . . , Nu : v = 1, . . . , Nv
(17)
: w = 1, . . . , Nw ,
where lu × lv × lw is the cell size of the new particle mesh. The system is not periodic in the z-direction. To suppress the images introduced by the FFT we use the classical doubling-up procedure (Hockney & Eastwood 1981), which by doubling the size of the mesh over which the FFT must be performed exactly cancels all the images. Thus only the lower half of the entire mesh is relevant, i.e., only particles inside −Lz /2 ≤ z ≤ 0 are active and particles leaving this zone are considered as escaped.
3.4. Friction In the ISM the collisional rate must depend on the clumping state, which must depend on the dissipation rate. Consequently, we expect a complex dependence of drag coefficients and mass density. However, as explained in Sect. 2, at the kpc scale the physics is dominated by the
8
D. Huber, D. Pfenniger: Lumpy Structures in Self-Gravitating Disks
conservative gravitational dynamics and its concrete behavior should be weakly dependent on the particular dissipative factors, since dissipation mainly acts to ensure the convergence of the system toward the attractors determined by the conservative part of the system. Thus, and following TK, as dissipation factors we adopt linear friction terms, which should be weak in order to remain quasi-Hamiltonian (Pfenniger & Norman 1990). Yet the collisional properties of the interstellar medium can be expected to differ along or transverse to the plane. To minimize the number of free parameters, we retain only two friction coefficients. The linear friction terms −Cx x˙ and −Cz z˙ added to the radial respectively to the vertical forces (Fx , Fz ) in Eq. (8). There is no azimuthal friction in order to be consistent with a global angular momentum conservation.
3.5. Scaling, Units, Parameters In order to fix a scale, the origin of our local model is located at a distance of R0 = 8 kpc from the galactic center and rotates with an orbital frequency of Ω0 = θ0 /R0 , where θ0 = 210 km/s. We assume for the general case a flat rotation curve. Moreover, we assume that the active disk has a surface density of Σ0 = 100 M⊙ /pc2 . As usual in local shear models of galactic disks the linear measure is the critical wavelength, i.e., the longest unstable wavelength in a zero-pressure disk, λcrit =
4π 2 GΣ0 . κ20
(18)
The critical wavelength defines the scale for which the theory of swing amplification predicts the strongest response (Toomre 1981 , Julian & Toomre 1965).√For a flat rotation curve the epicyclic frequency is, κ = 2Ω0 and consequently the critical wavelength scales, with the parameter values indicated above, to 1 λcrit = 12.32 kpc. The disk scale height z0 is then 0.024 λcrit . However, the equations of motion are scale free and the model can, with an appropriate choice of the parameters, be rescaled at will. The friction coefficients Cx and Cz of the friction terms −Cx x˙ and −Cz z˙ are in this work indicated in units of 1/τosc , where τosc is the period of the unforced epicyclic motion. The cooling times of the radial and the vertical damping are thus tcool,x = 1/Cx τosc and tcool,z = 1/Cz τosc . For all models presented here, τosc < tcool applies. The time-step has to meet the following conditions: ∆t ≤ 0.1 min{li /σi } , i = {x, y, z} 1 Lx , ∆t = k L y Ω0
(19) (20)
where σi is the initial velocity dispersion ellipsoid, li is the cell size and k is an integer. According to Eq. (3) the evolution of the inclination of the backward grid is periodic with period T = Lx /(Ly Ω0 ). The second condition guarantees that this period is a multiple of the time-step. Thus
the number of possible grid inclinations and consequently the number of kernels is finite. In order to satisfy the above conditions the time-step is computed in two steps: � � 10Lx k = (21) Ly Ω0 min{li /σi } Lx ∆t = , (22) L y Ω0 k where ⌈⌉ means to round to the next higher integer. TK calculated the forces of the self-gravitating particles with direct summation. Thus they had to introduce an upper cutoff in order to limit the computational expenditure, meaning that beyond a certain separation the particles lost their mutual gravitational interaction. Their separation cutoff was equal to four times the softening length. This limited the dynamical range of gravity to 0.6 dex. They argued that a cutoff at larger separations did not affect the resulting structures. Thanks to the higher performance of the convolution method we can extend the dynamical range without increasing the computation time. This may be important in view of a self-similar matter organization in self-gravitating systems. The parameters characterizing the model of TK are indicated in Table 1 and 2. They carried out numerical shearing-sheet experiments for different particle densities n. Their friction coefficient is a function of the particle −1 density Cx = (3.5 × 10⁻³ )/n τosc . In order to extend this study and to explore the resulting structures in dependence of the different parameters, we realize different versions of the shearing box model. These model versions are characterized by different parameter sets which fix the size of the simulation zone, the resolution, the particle density etc.. For convenience we call these model versions in the following models. That is, a model denotes in the following a version of the shearing box model which is determined by a specific parameter set. The parameters of the models are indicated in Table 3 and 4. To be able to do some statistics of structures produced on scales with strongest swing amplification response we perform, like TK, simulations with a quite large simulation zone. Model 1-11 have such a large simulation box resp. simulation sheet in the 2D case, Lx × Ly (×Lz ) = 6 × 6(×0.8) λ3crit . However since the dynamical range is limited due to computational limits we perform also simulations for a smaller local box, in order to resolve smaller scales. Therefore the simulation box of model 12-19 are reduced to 1.8 × 1.8 × 0.8 λ3crit . The time-step depends on the mesh resolution. The mesh resolution is fixed by the number of particles and the size of the simulation zone. The computation time of a simulation depends thus on the particle density n. We increase n with respect to previous models based on direct force calculation up to a factor 30 and are furthermore able to perform the simulations in 3D. The code has been written in Matlab for its ease of use, but clearly a compiled language program would greatly improve its speed and memory usage. A pseudo code is given in Appendix A.
D. Huber, D. Pfenniger: Lumpy Structures in Self-Gravitating Disks Model TK
Lx × Ly [λ2crit ] 6.0 × 8.0
n [1/λ2crit ] 100-1200
Dynamical range [dex] 0.6
Potential/ Softening Plummer
9
# Dimensions 2
Table 1. Parameters characterizing the model of TK. Indicated are the size of the simulation zone, the number density of particles (surface density), the dynamical range, the gravitational potential of the particles and the number of dimensions. Model TK
Cx /10−3 [1/τosc ] 3.5/n
N 4800 − 57000
ε [λcrit ] 0.20
κ/Ω0 1.4
A0 /Ω0 0.5
Table 2. Parameters of the TK model. The friction coefficient Cx is a function of the particle density n. N is the particle number, ε is the softening length of the Plummer potential. The epicycle frequency κ and Oort’s constant A0 are indicated in units of Ω0 . Model 1 2 3 4 5 6 7 8 9 10 11 12 13 14 15 16 17 18 19
Lx × Ly × Lz [λ3crit ] 6.0 × 6.0 λ2crit 6.0 × 6.0 λ2crit 6.0 × 6.0 × 0.8 6.0 × 6.0 × 0.8 6.0 × 6.0 × 0.8 6.0 × 6.0 × 0.8 6.0 × 6.0 × 0.8 6.0 × 6.0 × 0.8 6.0 × 6.0 × 0.8 6.0 × 6.0 × 0.8 6.0 × 6.0 × 0.8 1.8 × 1.8 × 0.8 1.8 × 1.8 × 0.8 1.8 × 1.8 × 0.8 1.8 × 1.8 × 0.8 1.8 × 1.8 × 0.8 1.8 × 1.8 × 0.8 1.8 × 1.8 × 0.8 1.8 × 1.8 × 0.8
lx × ly × lz [λ3crit ] 0.023 × 0.023 λ2crit 0.023 × 0.023 λ2crit 0.188 × 0.188 × 0.013 0.094 × 0.094 × 0.013 0.188 × 0.188 × 0.013 0.188 × 0.188 × 0.013 0.188 × 0.188 × 0.013 0.188 × 0.188 × 0.013 0.094 × 0.094 × 0.013 0.094 × 0.094 × 0.013 0.094 × 0.094 × 0.013 0.056 × 0.056 × 0.013 0.056 × 0.056 × 0.013 0.056 × 0.056 × 0.013 0.056 × 0.056 × 0.013 0.028 × 0.028 × 0.013 0.028 × 0.028 × 0.013 0.028 × 0.028 × 0.013 0.028 × 0.028 × 0.013
n [1/λ2crit ] 1820 1820 910 3640 910 910 910 910 3640 3640 Var 10100 10100 10100 10100 40450 40450 40450 40450
Dynam. range [dex] plane vertically 1.5 1.5 − 2.5 1.3 0.5 Var Var 1.5 1.8 1.5 1.8 1.5 1.8 1.5 1.8 1.8 1.8 1.8 1.8 1.8 1.8 1.5 1.8 1.5 1.8 1.5 1.8 1.5 1.8 1.8 1.8 1.8 1.8 1.8 1.8 1.8 1.8
Potential/ Softening Isotropic Isotropic Isotropic Isotropic Anisotropic Anisotropic Anisotropic Anisotropic Anisotropic Anisotropic Anisotropic Anisotropic Anisotropic Anisotropic Anisotropic Anisotropic Anisotropic Anisotropic Anisotropic
# Dim. 2 2 3 3 3 3 3 3 3 3 3 3 3 3 3 3 3 3 3
Var Cx ε Cx ε Cx , ν Cx , ν Cz ν Cx , ν Cx , ν N Cx , ν Cx , ν Cz ν Cx , ν Cx , ν Cz A0
= 0.3 = 3.0
= 0.3 = 3.0 = 0.3 = 3.0
= 0.3 = 3.0
Table 3. We use 18 models to explore the different parameters. Besides the parameters presented in Table 1 for the TK model, we indicate here the mesh resolution lx × ly × lz and the dynamical range vertical to the plane. Var indicates the parameter, altered from run to run. The resulting structure are then explored as a function of this parameter. The gravitational particle potential is either isotropic or it is deduced from the discrete particle representation described in Sect. 3.3.2.
3.6. Code Testing In order to check our code we carry out two-body simulations and compare the results with analytical solutions of the Kepler problem. We use a non-rotating inertial frame, thus Ω0 = A0 = ν = 0 in the equations of motion (Eq. (7) and (8)). However we compute the forces on the time dependent affine coordinate systems. Thus Ω0 = θ0 /R0 in Eq. (3), where the inclination angles are determined. That is, we calculate the forces for a non-rotating isolated system with the help of “shearing Fourier meshes”. Furthermore we use the anisotropic kernel described in Sect. 3.3.2. The vertical resolution of all simulations presented in this work is lz = 0.013 λcrit , but the resolution in the plane l = lx = ly depends on the particle number. Thus
we test our code for different resolutions l. The particle extension is fixed by the anisotropic kernel and is equal to the resolution. In the initial state the velocities of the two particles are chosen, in the way that they move on circular orbits. Accordingly to theory the following holds at each time: ∆r = r − r0 = 0 r¨cm = 0 ,
(23)
where r is the relative particle distance at t > 0 and r0 is the initial particle distance at t = 0. rcm is the center of mass. The orbital period for a particle with mass m is,
T = 2π
r
r03 . 2m
(24)
10
D. Huber, D. Pfenniger: Lumpy Structures in Self-Gravitating Disks Model
Cx /10−3 [1/τosc ] Var 100 Var 100 Var Var 140 140 Var Var 70 Var Var 50 50 Var Var 30 30
1 2 3 4 5 6 7 8 9 10 11 12 13 14 15 16 17 18 19
Cz /10−3 [1/τosc ] 0.7 0.7 0.7 0.7 Var 0.7 0.7 0.7 0.7 0.7 0.7 Var 0.7 0.7 0.7 Var 0.7
N 65520 65520 32760 131040 32760 32760 32760 32760 131040 131040 Var 32720 32720 32720 32720 131050 131050 131050 131050
ε [λcrit ] 0.2 Var 0.3 Var -
ν/Ω0
κ/Ω0
A0 /Ω0
Var
0.3 0.3 0.3 3.0 0.3 Var 0.3 3.0 0.3 0.3 3.0 0.3 Var 0.3 3.0 0.3 0.3
1.4 1.4 1.4 1.4 1.4 1.4 1.4 1.4 1.4 1.4 1.4 1.4 1.4 1.4 1.4 1.4 1.4 1.4 Var
0.5 0.5 0.5 0.5 0.5 0.5 0.5 0.5 0.5 0.5 0.5 0.5 0.5 0.5 0.5 0.5 0.5 0.5 Var
Cx ε Cx ε Cx Cx Cz ν Cx Cx N Cx Cx Cz ν Cx Cx Cx κ
= = = = = = = = = = = = = = = = = = =
40 − 210 × 10−3 0.02 − 0.3 40 − 280 × 10−3 0.1 − 0.4 40 − 280 × 10−3 70 − 280 × 10−3 0.04 − 40 × 10−3 0.0 − 6.4 40 − 210 × 10−3 0 − 120 × 10−3 16000 − 128000 10 − 70 × 10−3 30 − 50 × 10−3 0.04 − 40 × 10−3 0.0 − 6.0 20 − 40 × 10−3 20 − 40 × 10−3 0.04 − 40 × 10−3 1.4, 1.7; A0 = 0.5, 0.25
Table 4. Parameters of model 1-19. Contrary to the TK model Cx is a free parameter. Moreover we have, because of the extension to three dimensions, a vertical friction coefficient Cz and a vertical frequency ν. The parameter range for which we explore the models is indicated in the last column.
−12.5
0.02
0.02
∆ r/r ∆ T/T
−13
0.015
0.01
0.005
0.005
0
0
0.05
0.1 l [λcrit]
0.15
0 0.2
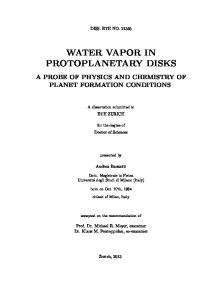
Fig. 3. Relative errors, resulting from the simulation of two bodies on circular orbits, as a function of the resolution. The simulations are performed for one period, which corresponds to ≈ 4 galactic rotations. Crosses, left ordinate: The maximal relative error of the particle distance as a function of the resolution. The resolution is indicated in units of λcrit . Stars, right ordinate: The relative error of the orbital period.
Particle mass, distance and velocities chosen for these tests yield a period of T ≈ 4 galactic rotations. These theoretical results are compared with the experimental results, i.e., with those resulting from our simulations. The code errors, arising from this comparison are shown in Fig. 3 and 4 for different resolutions. The resolution is indicated in units of λcrit . During an orbital period ∆r/r0 oscillates around zero. The maximal error of the
2
0.01
∆ T/T
(∆ r/r0)max
2
log(d rcm/dt )
0.015
−13.5
−14
−14.5
0
0.05
0.1 l [λ ]
0.15
0.2
crit
Fig. 4. The maximal acceleration of the center of mass during the simulation of two bodies on a circular orbit as a function of the resolution. The simulations are performed for one orbital period.
particle trajectory computed with the numerical model are then equal to the amplitude of this oscillation. The amplitude (∆r/r0 )max is plotted in Fig. 3. In this figure the relative error of the orbital period ∆T /T is indicated as well. Fig. 4 reveals the acceleration of the center of mass rcm . The here presented errors must be considered as upper limits, because our particles are not point-like but have an final extension, which is, as mentioned above, equal the resolution l. In Table 5 we indicate the ratio l/r0 for the different resolutions.
D. Huber, D. Pfenniger: Lumpy Structures in Self-Gravitating Disks l [λcrit ] 0.188 0.094 0.047
l/r0 0.094 0.047 0.024
sible neighbors). If we repeat this for other values of R we can find the structure dimension D(R) via
Table 5. A small contribution to the deviation from the theoretical trajectories is due to the extension of our test particles. In this Table we indicate the ratio of particle extension and separation l/r0 for the different resolutions l.
Because we are interested in the secular time behavior of the galaxy disk, the simulations are performed for t = 10 galactic rotations. In the initial state at t = 0 the particles are distributed uniformly in the x-y-plane. In the z-direction the particle distribution follows an isothermal law (25)
where ρ is the density and z0 is the disk scale height. The velocities at t = 0 are determined by the shear x˙ = 0 y˙ = −2A0 x
(26)
z˙ = 0
and the Schwarzschild velocity ellipsoid 3.36GΣ0 Q κ σx κ σy = 2Ω p0 σz = πGΣ0 z0 ,
D(R) =
dln(N ) (R) , dln(R)
(28)
where R denotes the scale. The mass-size relation is then N (R) ∝ M (R) ∝ RD(R) .
(29)
If the structure dimension is independent of the scale, D = Df , i.e., if D is constant or oscillates around a mean value, then the mass-size relation is a power-law (Semelin 2000)
3.7. Initial Conditions
ρ ∝ sech 2 (z/z0 ) ,
11
σx =
(27)
where the Safronov-Toomre stability criterion is Q ≥ 1 (Toomre 1964, Safronov 1960). This velocity distribution is a permissible assumption, because we represent the gas by dissipative particles.
4. Structure Analysis
M ∝ RDf .
(30)
If furthermore Df is non-integer, the structure is fractal (Mandelbrot 1982). We will check if D = Df holds for the structures resulting from the shearing box experiments. However one has to take into account that these structures can never correspond to an idealized mathematical set, generated by means of an infinite number of levels. Rather they are the result of a finite simulation, modeling a finite physical system. Thus the structures resulting from our experiments can never be fractal beyond a lower and upper cutoff. An upper scale limit due to the numerical model is given by the size of the simulation box in the x-y-plane. On this scale the system becomes periodic, meaning that it can not be fractal. To avoid boundary effects as much as possible, we consider in our analysis only particles inside the simulation box. Therefore the fractal dimensions are only calculated for scales R ≤ L/4. Moreover we determine the number of neighboring particles only for particles with a distance r ≤ L/4 from the center of the simulation box. Consequently even for particles at r = L/4 all neighboring particles are inside the simulation box. A lower scale limit is due to the finite resolution of the simulation mesh. If the mesh cells have the size lx × ly × lz and l = lx = ly > lz then we do not expect to model correctly fractal structures below 2l. If however the structure dimension depends on the scale D = D(R), the structure dimension may simply be regarded as a statistical measure describing the clumpyness on the corresponding scale.
In order to characterize the structures resulting from the shearing box experiments, we determine the mass-size relation and the velocity dispersion-size relation.
4.2. Velocity Dispersion-Size Relation
4.1. Mass-Size Relation
σ ∝ RδL
We choose randomly a set of particles with distances r ≤ L/4 from the center of the simulation box. The positions of the particles in the set are restricted to r ≤ L/4 in order to avoid boundary effects in the analysis of the mass-size relation. We will refer to that at the end of this subsection. For each particle in the set we count the number of neighboring particles N (R) inside a certain radius (all particles in the simulation zone are considered as pos-
on scales O(0.1) − O(100) pc with 0.3 < ∼ δL < ∼ 0.5 (e.g. Larson 1981, Scalo 1985, Falgarone & Perault 1987, Myers & Goodman 1983). This power-law relation seems to extend beyond the 100 pc scale (Larson 1978). In order to check if our model can reproduce these or similar velocity-size correlations on the kpc scale, we determine the velocity dispersion-size relations for the resulting structures. We use the same approach as for the
There is observational evidence for Larson’s law (31)
12
D. Huber, D. Pfenniger: Lumpy Structures in Self-Gravitating Disks
determination of the fractal dimension, but now we calculate the velocity dispersion σ of the particles inside a certain radius R. Then dlnσ (R) . dlnR
160
(32)
140
What we said about the structure dimension applies also for δ. If δ is constant or oscillates around a mean value over a certain scale range it may be regarded as the power-law index of Larson’s law on the kpc scale, δ = δL . If however δ depends on the scale, δ = δ(R), it may be considered as a statistical measure determining the velocity correlation.
120
δ(R) =
weak middle strong i=x i=y
100
5.1. 2D Simulations To compare with earlier simulations, we start with 2D shearing sheet simulations (model 1, 2 in Table 3, 4). The structures resulting from these simulations depend mainly on the relative strength of the competing gravitational and dissipation processes. Even without dissipation filamentary structures are already developed after ≈ 1/2 galactic rotation. Yet, gravitational instabilities lead to a conversion of bulk kinetic energy (shear-flow) into random thermal motion. In this way the disk is heated up. Thus, if there is no or a too weak dissipation the initially arised filamentary structures are not maintained and smear out. However, with an appropriate dissipation strength, filamentary structures can be maintained in a statistical equilibrium. If the dissipation strength is increased beyond the “equilibrium value”, the filaments become denser and denser, and clumps in filaments may be formed. If finally the dissipation dominates completely the heating process, hot clumps, collecting almost all the matter of the simulation zone are formed out of the filaments. Figs. 5-7 show the change of the structure morphology for three different radial friction coefficients, i.e., dissipation −1 strength. The friction coefficients are, Cx = 70×10−3 τosc , −3 −1 −3 −1 Cx = 140×10 τosc and Cx = 210×10 τosc . To express the relative strength we call the corresponding dissipations “weak”, “middle” and “strong”. All three simulations reveal a fast fragmentation and structure formation. After one rotation around the galaxy center the characteristic striations appear already. The “weak” dissipation leads to a statistical equilibrium of the structure. This statistical equilibrium establishes after about 5 rotations and is maintained for the rest of the simulation. It has a persistent pattern, formed by transient structures. Contrary to the “strong” dissipation, where the structure evolution is dominated by dissipation, i.e., the dissipated energy can not be compensated by the heating mechanism. where no statistical equilibrium arises In order to characterize more precisely the resulting structures we compute with Fourier transforms the 2D autocorrelation function of the matter distributions shown in Figs. 5-7. The result is shown in Figs. 8-9. The figures reveal clearly the different morphology resulting from
σi [km/s]
5. Results 80
60
40
20
0
0
2
4 6 t [galaxy rotation]
8
10
Fig. 11. The velocity dispersions σx (△) and σy (◦) resulting from the 2D simulations (model 1) with the “weak”, the “middle” and the “strong” dissipation, respectively. the simulation with the “weak” and the “middle” dissipation. Whereas the autocorrelation function reveals striations with a characteristic inclination for the simulation with a “weak” dissipation, these striations disappear for the “middle” and the “strong” dissipation. Because we deal with self-gravitating systems which have negative specific heat for a certain energy range, energy dissipation does not mean necessarily a system cooling. Indeed, the “weak”, “middle” and the “strong” dissipation cool the corresponding system only during the first rotation. Then the systems are heated up. After some rotations heating and energy dissipation are balanced out and the velocity dispersions σx and σy reach a more or less stable level (see Fig. 11). It is interesting to note that σx > σy always holds for the “weak” and the “middle” dissipation strength. The
D. Huber, D. Pfenniger: Lumpy Structures in Self-Gravitating Disks
13
Fig. 5. The evolution of the particle positions, resulting from model 1 with a “weak” dissipation.The number of rotations of the shearing box around the galaxy center is indicated at the top of each panel. Shown is each second particle. Full resolution figures available at http://obswww.unige.ch/Preprints/dyn art.html.
Fig. 6. The evolution of the particle positions, resulting from model 1 with a “middle” dissipation. same holds also for the “strong” cooling during the first six rotations, then this ordering is obviously destroyed by the formation of hot clumps. In order to characterize the structure of the simulation terminal phase we determine the structure dimension D and the index δ. The longer term evolution of the struc-
tures may be superimposed by fluctuations1 on time-scales of the order of ∼ 1/2 τrot , where τrot is the time for a rotation around the galactic center. In order to eliminate these fluctuations we indicate in this paper mean values 1
To obtain an idea about these fluctuations see the evolution of the Schwarzschild velocity ellipsoid in Fig. 11 and Fig. 24.
14
D. Huber, D. Pfenniger: Lumpy Structures in Self-Gravitating Disks
Fig. 7. The evolution of the particle positions, resulting from model 1 with a “strong” dissipation.
Fig. 8. The autocorrelation function of the structures shown in Fig. 5, resulting from the simulation with the “weak” dissipation. of the structure dimension D and the index δ, determined during the last two rotations. In figures showing D or δ we indicate in addition 1σ error bars. The dimension D and the index δ resulting form the structures shown in Fig. 5-7 are plotted in Fig. 12 and Fig. 13, respectively, as a function of the scale R. The vertical lines at the left of the curves are the 1σ error bars. Contrary, to the structure dimension D the error bars of
the index δ can vary up to a factor 7. Thus we indicate in Fig. 13 in addition the position and the size of the largest and the smallest error bars. The stronger the dissipation is, the more filamentary resp. clumpy are the resulting structures and consequently the lower is the structure dimension. A comparison of the structure dimensions D with the indices of the velocity dispersion-size relation δ shows that hδ(R)i increases with
D. Huber, D. Pfenniger: Lumpy Structures in Self-Gravitating Disks
15
Fig. 9. The autocorrelation function of the structures shown in Fig. 6, resulting from the simulation with the “middle” dissipation.
Fig. 10. The autocorrelation function of the structures shown in Fig. 7, resulting from the simulation with the “strong” dissipation. decreasing hD(R)i, where l < R < L (resolution: l = lx = ly , box size in the plane: L = Lx = Ly ). For the strong dissipation the mass-size relation can be approximated by a power-law for a scale range of roughly 1 dex, but the error bars are relatively large and the scale range is too small to call the corresponding structure scalefree or fractal.
As long as the structures are not completely dominated by hot clumps (strong dissipation) the velocity dispersion-size relation may be approximated by a powerlaw. However, also here the mean error bars are quite large with respect to the value of δ, especially for the weak dissipation, where the resulting δ-value would also be compatible with an uncorrelated velocity dispersion-size relation.
16
D. Huber, D. Pfenniger: Lumpy Structures in Self-Gravitating Disks
Fig. 14. The evolution of the particle positions, resulting from a simulation performed with model 2. The softening length is, ǫ = 0.02 λcrit . Shown is each second particle. 0.5
2
initial weak middle strong
1.5
0.3
δ
Structure Dimenson D
0.4
0.2
1 0.1
initial weak middle strong
0.5
0 −1.5
−1
−0.5 log(R) [λcrit]
0
Fig. 12. The structure dimension D as a function of the scale R. The corresponding structures result from the 2D simulations (model 1) with the “weak”, the “middle” and the “strong” dissipation, respectively. The error bars at the left of each curve indicate the mean 1σ errors.
For the middle dissipation there is a little more evidence for a power-law relation over roughly 1 dex. However, also if there is a power-law relation the value of δ would be far away from the index of Larson’s law measured in molecular clouds (0.3 < δL < 0.5). The softening length in model 1 is quite large and corresponds to those of the TK model. In model 2 (Table 3
0 −0.1 −1.5
−1
−0.5 log(R) [λ ]
0
crit
Fig. 13. The index δ as a function of the scale R. The corresponding structures result from the 2D simulations (model 1) with the “weak”, the “middle” and the “strong” dissipation, respectively. At the left of each curve the 1σ mean error bars are indicated. Furthermore, the location and the size of the maximal and the minimal error bars are indicated. and 4) we reduce the softening length ε, but we pay attention that ε > lx = ly is always valid, i.e., that the softening length is always larger than the cell size of the simulation mesh. As expected the general tendency is that a smaller softening yields a stronger clustering and thus a smaller structure dimension. The structures resulting from sim-
D. Huber, D. Pfenniger: Lumpy Structures in Self-Gravitating Disks
17
Structure Dimenson
2
1.5
1
0.5 initial final 0 −1.5
−1
−0.5 log(R) [λcrit]
0
Fig. 15. The structure dimension D as a function of the scale R. The corresponding structures result from a 2D simulation performed with model 2. The softening length is, ε = 0.02 λcrit . The dynamical range of the simulation is 2.5 dex.
ulations with a small softening length (ε < 0.1) become relatively fast very clumpy (after 2-3 rotations). In contrast to simulations with a strong dissipation, where also clumps are formed, the number of clumps remains from a certain moment on nearly constant, i.e., it does not decrease due to mergers. This is shown in Fig. 14. The structure dimension for this simulation is shown in Fig. 15.
Fig. 16. The particle positions after 8 and 10 rotations, resulting from model 3 and model 4. For model 4 we only show each forth particle. Upper panels (model 3): Cx = −1 140 × 10−3 τosc , ε = 0.3 λcrit , N = 32760. Lower panels −1 , ε = 0.3 λcrit , N = (model 4): Cx = 110 × 10−3 τosc 131040. 0.3 initial model 3 model 4
0.25 0.2
5.2. 3D Simulations
We extend the models to 3 dimensions and carry on using an isotropic particle potential (model 3 and 4). In models using a particle-mesh method the number of particles is determined by the number of mesh-cells and vice versa. Due to computational limits and in order to do a reasonably sized parameter study on the available machines we have to limit the number of particles to N ≈ 130000. Thus it is not possible to resolve the system vertically with a softening length ε ≈ lx = ly . The models using an isotropic potential reproduce thus only 2D dynamics in a 3D space. As expected we find therefore the same parameter dependence as in model 1 and 2, respectively. Compared with previous models we carry out here also simulations for a slightly larger softening length. These simulations reveal for a limited scale range approximately a velocity dispersion-size power-law relation. Fig. 16 shows the structures resulting from 2 simulations with ε = 0.3 λcrit . The indices δ resulting from these 2 simulations are shown in Fig. 17.
δ
5.2.1. Isotropic Kernel
0.15 0.1 0.05 0 −0.05 −0.1 −1.5
−1
−0.5 log(R) [λ ]
0
crit
Fig. 17. The index δ as a function of the scale R. The corresponding structures result from simulations performed with model 3 and 4. The index resulting from model 3 shows a power-law relation with δL ≈ 0.1.
5.2.2. Anisotropic Kernel We use now the anisotropic kernel described in Sect. 3.3.2. Thus the softening length ε is here no longer a free parameter. The softening of the gravitational potential is given by the resolution of the simulation mesh. With the
18
D. Huber, D. Pfenniger: Lumpy Structures in Self-Gravitating Disks
Fig. 19. The disk scale height z0 and the vertical velocity dispersion σz as a function of the vertical frequency ν deduced from model 8 and model 15, respectively. z0 and σz are mean values calculated during the last two galaxy rotations.
Fig. 18. The velocity dispersions in the plane σxy and vertically to it, σz , as a function of the vertical friction coefficient Cz for model 7, 14 and 18 (upper panel, middle panel). The lower panel shows the disk scale hight z0 . The parameter values are mean values ascertained during the last two rotations. As soon as the dissipation leads to the formation of clumps the disk is heated up. The structure of model 14, eg., becomes clumpy for Cz = 50 × 10−3 τosc . anisotropic kernel we can resolve the system vertically, so that there is a vertical dynamical-range of 1.8 dex for all models with anisotropic kernel. Since the third dimension is now resolved we explore the structure in dependence on the friction coefficient Cz (model 7) and the vertical frequency ν (model 8). Vertical Friction Coefficient Cz . We start with simulations, where Cx = Cz . However, these simulations show that with such a dissipation it is not possible to maintain simultaneously strong density fluctuations and the disk thickness. That is, either the density fluctuations are maintained and the disk scale height tends towards zero, or the disk scale height is maintained nearly constant and the density fluctuations smear out. Therefore we choose for all further simulations Cx > Cz , i.e., tcool,x < tcool,y . These results justify a posteriori the choice of two friction coefficients. The velocity dispersions in the plane σxy = (σx2 + σy2 )1/2 are mainly controlled via Cx , whereas
σz and with it the disc scale height z0 is principally driven by Cz . However, as soon as structures are formed with sizes comparable or smaller than the disk thickness, the dynamics in the plane and vertically to it are no longer independent. Thus the effect of Cz on the structure depends also on Cx . The general effect of Cz on the selfgravitating disk is the following: As long as the structure remains filamentary an increase of Cz , diminishes z0 and σz . The solid curve in Fig. 18, resulting from a simulation performed with model 7, represents such a behavior. The effect of Cz is also studied in model 14 and model 18. There the structure changes from filamentary to clumpy due to an increase of Cz . As a consequence these systems may be heated up by further dissipation (see Fig. 18). Vertical Frequency ν. In model 8 and 15 we study the effects of the vertical frequency ν on structure and dynamics. The vertical frequency determines the strength of the backward force due to a displacement from the galaxy plane. The backward force stems from the external galactic potential. Thus an increase of ν binds the particle stronger to the disk and diminishes z0 (see Fig. 19). In all 3D models the mean particle-velocity vertical to the plane hvz i is not exactly zero, but oscillates with an amplitude of ≈ 0.1 kms−1 and a frequency equal to the vertical frequency ν. Concerning the effect of ν on the structure, there are frequencies producing a clumpy structure, whereas some higher or lower frequencies produce a more filamentary
D. Huber, D. Pfenniger: Lumpy Structures in Self-Gravitating Disks
19
80 70
50
i
σ [km/s]
60
i=x i=y i=z
40
Fig. 20. The minimal structure dimension Dmin as a function of ν. The structure dimension is a mean value determined during the last two galaxy rotations. The corresponding structures result from simulations performed with model 15.
(33)
where L = Lx = Ly (box size in the plane) and l = lx = ly (resolution). The minimal structure dimension determines how strong the structures differ from a homogeneous matter distribution, i.e., the lower Dmin the more filamentary resp. clumpy the structure. We calculate Dmin for the structures resulting from simulations with different ν. The result is shown in Fig. 20. The two simulations with Dmin ≈ 1.7 have a more clumpy structure than the ones resulting from the other simulations, which are more filamentary. Particle Number N . With model 11 we determine the structure dimension and the disk scale height as a function of the particle number N . We only alter the particle number. The mesh resolution and the friction coefficients Cx and Cy are kept constant. The 2D simulations of TK shown that a higher particle number leads to a stronger dissipation. Thus we expect a decrease in the disk scale height and a smaller structure dimension for higher N . We find a clear decrease of the disk scale height for an increasing particle number, but there is no clear trend of the structure dimension. This is because the disk is heated up in the plane due to the decreasing disk thickness. We find that the effect on the structure due to a change of the particle number can be compensated with an appropriate choice of the dissipation strength, i.e., if we use a weaker dissipation for an increased particle number, the statistical properties of the resulting structures remain unchanged. Radial Friction Coefficient Cx / Large Simulation Zone. In Sect. 5.1 we explored for the 2D models how the structure formation depends on the radial friction coefficient Cx . Here we study the connection between structure and radial friction in 3D. Considered are structures resulting from
0
2
4 6 t [galaxy rotation]
8
10
Fig. 24. The velocity dispersion components σx , σy and σz as a function of time t (indicated in galaxy rotation units). The dispersions result from a simulation performed with model 10 and “weak” dissipation. 28
26
24
z
Dmin = {min[D(R)] : l < R < L} ,
20
σ [km/s]
structure. To show this we determined the minimal structure dimension,
30
22
20
18 40
50
60
70 σx,y [km/s]
80
90
100
Fig. 25. The vertical dispersion σz as a function of the dispersion in the plane σxy (model 10, “weak” dissipation). This plot shows clearly how the system attains a stable state. The star and the circle denote the starting and the ending point respectively. models with large simulation zone and anisotropic kernel (model 5, 6, 9 and 10). Concerning the structure in the plane we find qualitatively the same dependence as in the 2D simulations. That is, the initially formed structures smear out if we don’t dissipate energy. However we still find correlations in the matter distribution after ten galaxy rotations. For an increasing radial dissipation the structures become denser and denser until finally hot clumps are formed out of filaments. Fig. 21 and 22 show, as an example, the structures resulting from a simulation performed with model
20
D. Huber, D. Pfenniger: Lumpy Structures in Self-Gravitating Disks
Fig. 21. The evolution of the particle positions seen from above the galaxy plane. The structures result from a −1 simulation of model 10. The friction coefficient is Cx = 64 × 10−3 τosc (“weak” dissipation). The number of rotations of the shearing box around the galaxy center is indicated at the top of each panel. Shown is each fourth particle.
Fig. 22. The particle positions inside the slice, −0.05λcrit < y < 0.05λcrit , seen along the direction of orbital motion (model 10, “weak” dissipation).
D. Huber, D. Pfenniger: Lumpy Structures in Self-Gravitating Disks
21
Fig. 23. The autocorrelation function of the particle distribution, presented in Fig. 21 and 22 (model 10, “weak” dissipation). Upper panels: Autocorrelation function in the x-y-plane. Lower panels: Autocorrelation function in the z-x-plane. 10. The structures reach in this simulation very fast (after 2 rotations) a statistical equilibrium. The autocorrelation functions revealing the underlying characteristics of these structures are shown in Fig. 23. Fig. 24 and 25 show the evolution of the velocity dispersions. These Figures confirm that a statistical equilibrium is attained after ≈ 2 rotations around the galaxy center. The filaments resulting from these simulations (Cx = 64 × 10−3 τosc ) are very dense and they are first signs of clump formation. A slight increase of the dissipation would thus turn the structure from filamentary to clumpy. Indeed, the structures in Fig. 26 resulting from simulations performed with the same model but with slightly higher radial dissipations Cx = 66, 68, 70×10−3 τosc , are already clumpy. For convenience we call the relative strength of the radial dissipations used in model 10 “weak”, “middle”, “strong”, and “very strong”. In Fig. 27 the structure dimension D is shown for the four different dissipation strengths. The structure dimensions are not constant over the corresponding dynamical range and are thus not fractal. However, the structure dimension resulting from the simulation with the “strong” dissipation has a dimension 1.5 < D < 1.8 over the whole dynamical range in the plane and remains smaller than 2 also on scales where the disk thickness becomes important. Furthermore, the structure dimension has at 0.06 λcrit the same dimension as at 1.6 λcrit with a minimum in between. This is qualitatively a different behavior than those of the initial state. The slight increase of the structure dimension at the left and at the right may be induced by the small scale (resolution) and large scale cutoff (periodicity), respectively. This be-
havior is quite general for our simulations and it may be that a larger dynamical range produce a more constant structure dimensions, D(R) ≈ const..
We do not find a velocity dispersion-size relation similar to a power-law for the simulations performed with model 10. However we do find some hints for such a relation in the structures resulting from model 6. Fig. 28 shows the velocity dispersion-size relation for two different simulations of model 6. The simulation with the weak dissipation produces filamentary structures whereas the simulation with the strong dissipation produces filaments and clumps, thus δ varies stronger and the error bars are larger for these structures. However, both simulations produce a velocity dispersion-size relation which may be approximated to first order by a power-law. Of course, the error bars are too large and the scale range is too small to call the corresponding velocity dispersion-size relations scale free. The resolution in model 6 is larger than those in model 10. Why this softer gravitation seems to reproduce better a power-law velocity dispersion-size relation is at the moment unclear.
Analog to the 2D case we find also in 3D simulations a systematic ordering of the velocity dispersion components. The ordering, σx > σy > σz , holds for quite a large range of dissipation strength. This is shown by simulations performed with model 10. The velocity dispersion components resulting from the simulation with the “weak” dissipation strength is shown in Fig. 24 and those with the “middle”, “strong” and “very strong” dissipation strengths are shown in Fig. 29. Even if we don’t dissipate energy this ordering is still observed after 10 galaxy ro-
22
D. Huber, D. Pfenniger: Lumpy Structures in Self-Gravitating Disks
initial weak middle strong very strong
Structure Dimenson D
3 2.5 2 1.5 1 0.5 0
−1.2
−1
−0.8
−0.6 −0.4 log(R) [λcrit]
−0.2
0
0.2
Fig. 27. The structure dimension D as a function of the scale R. The corresponding structures result from 3D simulations of model 10. The structure dimension is indicated for the simulation with the “weak” (see Fig. 21), the “middle”, “strong”, and the “very strong” dissipation (see Fig. 26). 0.3 initial weak strong
0.25 0.2
δ
0.15 0.1 0.05
Fig. 26. The particle positions after 8 and 10 galaxy rotations. The structures result from simulations performed with model 10. Upper panels: “middle” dissipation. Middle panels: “strong” dissipation. Lower panels: “very strong” dissipation. Shown is each forth particle.
0 −0.05 −0.1 −1.5
−1
−0.5 log(R) [λ ]
0
crit
tations. Only strongest clump formation can destroy the systematic ordering. From the definition of x and y in Sect. 3.1 it follows σx = σR and σy = σφ . To sum up, one can therefore say, that as long as our model produces structures resembling the lumpy matter distribution in spirals, it also produces an ordering of the velocity dispersion components (σR > σφ > σz ) corresponding to those of the solar neighborhood, or of N -body simulations of spiral disks (Pfenniger & Friedli 1991). Radial Friction Coefficient Cx / Small Simulation Zone. In order to increase the resolution in the plane and to approach the vertical resolution we decrease the size of the simulation box. The structures resulting from these simulations differ from those in the large simulation box. We still find filaments for a “weak” dissipation and clumps
Fig. 28. The index δ as a function of the scale R. The corresponding structures result from 2 simulations performed with model 6. One simulation is performed with a “weak” dissipation and produce a filamentary structure whereas the other simulation is performed with a “strong” dissipation, producing a clumpy structure. for a “strong” dissipation (see Fig. 30). However, filaments and clumps, respectively, appear less numerous. From this point of view the structures in the small simulation box are not a fractal continuation of those in the large simulation box. However, this does not exclude the possibility that a simulation with a dynamical range incorporating the scale of the large and the small simulation box would produce scaling laws over the whole dynamical range.
D. Huber, D. Pfenniger: Lumpy Structures in Self-Gravitating Disks
23
Fig. 30. The evolution of the particle positions seen from above the galaxy plane. Shown is each forth particle. The structures result from simulations performed with model 16. We show 3 simulations with different dissipation strength. Upper panels: “weak” dissipation. Middle panels: “middle” dissipation. Lower panels: “weak” dissipation. The number of rotations of the shearing box around the galaxy center is indicated at the top of each panel. Shear. The inhomogeneous structures appearing in the shearing-box simulations can only be maintained when the dissipated energy is compensated by an energy injection. The source of this energy is the shear motion. If the shear is reduced, the dissipated energy can no longer be balanced by the energy injection and the system collapses. A rotation curve, increasing with the square root of the √ radius (v ∝ r) reduces the shear-flow, y˙ = −2A0 x, by a factor two. With model 19 we perform simulations for different rotation curves. √ That is, for the usual flat curve with A0 = 0.5 Ω0 , κ = 2 Ω0 and for a curve increasing √ with the square root of the radius, A0 = 0.25 Ω0 , κ = 3 Ω0 . Such a choice of the rotation curve doesn’t reflect a realistic case but serves to explore the influence of the shear on the structure formation. However, a change of the rotation curve alters also the epicyclic frequency and consequently the Schwarzschild velocity ellipsoid as well as the critical
wavelength λcrit . Because we only want to examine the effect of the shear, simulations with different rotation curves are carried out with the same initial velocity dispersion. Moreover, the distances are indicated in units of kpc. The effect of a decreased shear is revealed in Fig. 31. The same friction coefficients as in the simulations with the√flat rotation curve lead for the slightly increasing (v ∝ r) curve to a collapsed system.
5.2.3. Minimal Structure Dimension and Maximal Index δ In this paper we study mainly the structure dimension in dependence of the radial friction coefficient Cx , because this parameter determines principally the degree of structure inhomogeneity. Indeed, the parameters Cz and ν serve mainly to prevent the disk from vertical dissolution and a
24
D. Huber, D. Pfenniger: Lumpy Structures in Self-Gravitating Disks
Fig. 31. Evolution of the matter distribution, seen from above the galaxy plane. The structures result from simulations with different rotation curves performed with model 19. Upper panels: flat rotation curve (v = const.). Lower panels: √ increasing rotation curve (v ∝ r). The number of rotations around the galaxy center is indicated at the top of each panel. Shown is each forth particle. change of the differential rotation or the particle number can be balanced by an appropriate choice of the dissipation strength. The structure characteristics in dependence of Cx are studied for different simulation boxes and resolutions. In order to compare the structures and the dynamics as a function of Cx resulting from the different models we calculate the minimal structure dimension and the maximal index δ of the velocity dispersion-size relation. The minimal structure dimension is defined in Eq. (33). Correspondingly, the maximal index is, δmax = {max[δ(R)] : l < R < L} .
(34)
The results are summarized in Fig. 32. The general trend is that the structures become denser and more clumpy for higher radial dissipation, leading to a smaller structure dimension and to higher velocity differences on the different scales of the system, i.e., to higher δmax .
6. Discussion With respect to the models with the large simulation zone (model 1-11), the models with the small simulation zone (model 12-19) produce less fragmentation. That is, only a few weak filaments appear in simulations of these models as long as the dissipation is weak and an increase of the dissipation strength can not produce a more fragmented or filamentary structure, because clumps appear very quickly. These clumps become rapidly unphysically
hot and collect almost all the matter of the simulation zone. The clumps may thus hinder the formation of a more fragmented structure in these models. The formation of non-transient collapsed clumps, which have the tendency to attract more and more matter were also found in other numerical studies using dissipative or sticky particles in order to model the ISM (Huber 2001, Semelin & Combes 2000). The appearance of these clumps may thus be a generic problem of gravitational clustering simulations with dissipative particles. In the following we discuss some aspects related with the formation of these non-transient and in our opinion unphysical hot clumps, which may hinder the evolution towards a structure, being hierarchical over a more extended scale-range. We discuss numerical, dynamical, and physical aspects of the problem.
6.1. Numerical Problems The size of dissipative particles, given by the softening length, is much larger than the smallest clumps in the interstellar medium. Thus the nearly homogeneous mass distribution (smear out) over the softening length is not justified and it is not a priori clear that the inhomogeneous structures below the resolution scale do not affect the structures on larger scales. Observations of the ISM reveal filamentary structures down to the smallest resolvable scales, thus it is unclear down to what scales the highly inhomogeneous structures
D. Huber, D. Pfenniger: Lumpy Structures in Self-Gravitating Disks
Fig. 29. The velocity dispersion components σx , σy and σz as a function of time. The dispersions result from the simulation with the “middle”, “strong” and “very strong” dissipation strength, respectively (model 10). The matter distribution of the corresponding simulations are shown in Fig. 26. continues. Moreover, a large scale range has probably to be taken into account in order to reproduce the observed structures. Thus it is an open question whether in the following years a resolution will be reached such that basic clumps can indeed be represented by dissipative particles. Taking into account the ubiquitous trend of gravitationally unstable media to produce sheets and filaments not only in the ISM but also in cosmological simulations, it might be that the particle model of the basic mass unit, as a rigid body conserving mass, is not adequate.
6.2. Dynamical aspects One could argue that when the “mean free path” of cloud clumps is larger than their size and a particle description seems to be justified, physical cloud clumps collide and dissolve because they contain internal degrees of freedom due to the smaller subclumps moving inside them. Thus dissipative particle simulations should incorporate collisions with mass exchange (Pfenniger 1994). This is particularly relevant if the clouds collide with supersonic speed, that is, with velocities larger than their internal velocities.
25
Fig. 32. Upper panel: The minimal structure dimension Dmin as a function of the radial friction coefficient Cx . Lower panel: The maximal index δmax of the velocity dispersion-size relation as a function of the radial dissipation strength. Dmin and δmax are mean values calculated during the last two galaxy rotations. Inherent dynamical properties of gravitational unstable media may cause further problems. Let us discuss two of them: 1.) Typically clumps are subject to an anisotropic gravitational contraction that alter its morphological characteristics, i.e., clumps may become pancakes which become filaments. This was shown by Zeldovich (1970) and numerically confirmed by Kuhlman et al. (1996, hereafter KU). In their numerical experiments KU replaced particles in dense regions by clouds, made up of 23 resp. 25 particles. They found that only a small fraction collapses along all three directions and forms dense clumps. A further subdivision of the particles would probably lead to the same result. If the transformation from clumps to pancakes and to filaments on small scales is important for the appearance of the global structure, it may be problematic to model gravitational unstable media with particles, because a higher particle number would not solve the inherent problem of anisotropic clustering.
26
D. Huber, D. Pfenniger: Lumpy Structures in Self-Gravitating Disks
2.) A further problem when simulating gravitational clustering is related to the exponential propagation of twobody relaxation in hierarchical N -body systems. If the mass distribution of the considered system is self-similar over a range of scales, at each scale the effective bodies can be viewed as the corresponding clumps. The hierarchical structure acts as a strong two-body relaxation amplifier since at each scale the effective number of bodies is strongly reduced. If this effective number is O(10) the relaxation time at each level is of the order of the crossing time, so two-body relaxation is a major driver of evolution throughout the scales. 3.) Let us describe in more detail the related problem of error propagation in a hierarchical system. First we show that in a gravitational unstable medium developing a hierarchical structure, matter on smallest scales evolves faster. A hierarchical mass distribution satisfies the scaling relation between two levels L and l: �D � RL ML = , (35) Ml Rl where D is the mass scaling exponent, which would be the fractal dimension in a self-similar hierarchical system. D is restricted to stay in the interval [0 − 3] since mass is positive and space filling can not exceed the third power of scale. Then the density scales as �D−3 � ρL RL = . (36) ρl Rl and consequently the crossing time τdyn ∝ (Gρ)−1/2 scales as �(3−D)/2 � RL τdyn,L = . (37) τdyn,l Rl So in a hierarchical model the dynamical time (or crossing, or free-fall time) always decreases at smaller scales since 0 < D < 3 (Pfenniger & Combes 1994). Thus the low scale structures evolve faster. Self-gravitating N -body systems are chaotic and neighboring trajectories diverge exponentially (Miller 1964). This means also that any error propagates exponentially: ∆x ∝ ∆x0 eλt ,
(38)
where ∆x0 is a small initial error at time t = 0, and ∆x is the error at time t. Now, the degree of chaos and thus the error evolution is determined through the maximum Liapunov exponent λ, which for small N -body systems is approximately inversely proportional to the dynamical time, λ ∝ 1/τdyn (Miller 1994). With this estimate, let us see how errors are amplified through the two adjacent levels. If ∆xl is in fact the initial error at the lower level l, we get after one crossing time at level L, τdyn,L : � � �(3−D)/2 ! � RL τdyn,L ∆xL = exp . (39) = exp ∆xl τdyn,l Rl
The error amplification becomes rapidly huge as soon as L D < 3. Say, if RRLl = 2 and D = 1.5, then ∆x ∆xl = 5.38. Across n levels the error ratio at the highest level goes as 5.38n and becomes much larger than the scale ratio, 2n . (It is easy to show that for D < 2.264 the error amplification is always larger that the scale ratio, while for RRLl > 2.72 and D > 2.265 one can find hierarchical systems for which this problem does not occur). Thus we find an inherent dynamical problem, which can not be solved by using a higher resolution, because the increase of resolution exponentially increases the errors through the scales. Possibly such hierarchical systems might be dominated by numerical errors in simulations, and by small scale physics in real systems.
6.3. Additional physics Small scale physics, supporting the dissolving process of dense clumps, is not taken into account in our simple model. However, stellar winds, supernovae, jets and outflows may be important in the overall mass transport across the scales. These processes may ensure a cyclic matter flow by giving matter back to larger scales, which would condense back via gas cooling. Such a matter-flow may be crucial for sustaining the transient nature of hierarchical clumps for extended time.
7. Conclusions The structure resulting from the local simulations of selfgravitating disks can be homogeneous, filamentary or clumpy depending on the relative strengths of the competing gravitational and dissipation processes. As long as the structure is mainly filamentary self-gravitation and dissipation ensure a statistical equilibrium, where repeated transient patterns are formed. If the dissipative processes begin to dominate the evolution, the structures turn from filamentary to clumpy. During the subsequent evolution the clumps become hotter and more massive. In general, clumpy structures do not evolve towards a statistical equilibrium. However model 2 does show that it is also possible to establish a persistent pattern of clumps. These clumpy structures may show signs of a power-low mass-size relation. Some of our 2D as well as 3D simulations suggest also a power-law velocity dispersion-size relation. However the scale range of the simulations appears too small to draw final conclusions about a fractal structure and an extension of Larson’s law beyond the size of molecular clouds. We can suggest a few reasons causing the discrepancy: 1.) The numerical resolution should extend over several more decades of scale before the fragmentation stops to be dominated by finite scale range boundary effects. 2.) A fundamental law is associated with the rigid point particle representation of mass which, by forcing a particular lowest scale boundary condition, would prevent the
D. Huber, D. Pfenniger: Lumpy Structures in Self-Gravitating Disks
bottom-up building of scaling relations to match the observed ones. Also the propagation of errors may be superexponential in a hierarchical organized medium because the error evolution at largest scales aren’t determined by the dynamical time of these scales, but by the much smaller dynamical time of the smallest scales. Systems with dimension lower than about 2.2 are particularly concerned. This point is relevant for particle simulations of gravitationally unstable systems, such as cosmological and thin disk (D < 2) simulations. 3.) A key physical ingredient, such as mass cycling through the scales due to star formation, stellar activity, and gas cooling could be essential to sustain a fractal state of the ISM. Finally, it is interesting to note that the anisotropy of the velocity-dispersion ellipsoid, resulting from our simulations, has systematically the same ordering (σR > σφ > σz ) and relative amplitudes as observed in the Galaxy and in N -body simulations of spirals. Since the models are deliberately a simplified representation of reality, we learn from this that this ordering may be due to a very general property of galactic disks, to be substantially selfgravitating in z, and to rotate differentially with a similar shear rate set by a constant rotation curve.
Appendix A: Pseudo code of the shearing box program • Initialization of the particle positions and velocities. • Calculation of the canonical momenta. • The inclination of the meshes is ab = [(−Ω0 t)mod (Ly /Lx )] and af = ab + (Ly /Lx ), respectively. Thus there is a finite number of possible inclinations, n = T /∆t, where T = Ly /(Lx Ω0 ) and ∆t is the timestep. do i=1,n • The derivations of the Kernel ∇K(af ) for the different possible inclinations af of the forward mesh are calculated. K in an nx ×ny ×nz -matrix, where nx ny nz is the number of cells in the local simulation box. • The points: (nx /2, ny /2, 1 : nz ) of ∇K(ab ) are calculated for the backward mesh. The other Kernel points can be deduced from ∇K(af ) of the forward mesh, making use of their symmetry. enddo do i=1,nt (time propagation loop)
27
• The particle positions of the Cartesian coordinates are saved (yc = y). • Transformation of the particle position: Cartesian coordinates → Forward mesh (y = y − ax). else • a = ar = af − Ly /Lx . The inclination a corresponds to the backward mesh. • y = yc . The particle positions are again those in Cartesian coordinates. • y = y−ax.Transformation of the particle position: Cartesian coordinates → Backward mesh. • The missing points in the ∇K(ab )-matrix are deduced from ∇K(af ), making use of their symmetry. endif • Transformation of ∇K(a) into Fourier space. g (∇K(a) → ∇K(a))
• y = y mod Ly . All the particles should lie inside the local box of the forward and the backward mesh, respectively. • Mass to mesh assignment and transformation of the density ρ into Fourier space (ρ → ρ˜).
• Calculation of the potential differential (∇Φ = −1 g g ∇K(a)e ρ ), where e−1 denotes the inverse Fourier transform. • Calculation of the forces acting on the nodes of the affined meshes. ∂Φ Fx = a ∂Φ ∂y − ∂x ∂Φ Fy = −(1 + a2 ) ∂Φ ∂y + a ∂x
Fz = ∂Φ ∂z • Force interpolation in accordance with the CICmethod. • Transformation of the forces. Affine mesh → Cartesian coordinate system. enddo (g = 1, 2) • The particle positions are again those in Cartesian coordinates (y = yc ) • Force weighting • Calculation of the new canonical momenta and particle positions by means of the implicit canonical finite difference approximation (Pfenniger & Friedli 1993). if (z-coordinate of a particle lies outside the local box.)
• The particle is considered as escaped. do g = 1, 2 (Do for forward and backward mesh, respectively) elseif (x- and/or y-coordinate lies outside the local if (g=1) box.) • a = af = [(−Ω0 t) mod(Ly /Lx)] + Ly /Lx . The inclination a corresponds to the forward mesh.
28
D. Huber, D. Pfenniger: Lumpy Structures in Self-Gravitating Disks
• Reentrance at the opposite side with appropriate canononical momenta (see Eqs. (9)). endif if (storage condition) • Calculation of the particle velocities. • Storing of the particle positions and velocities to the disk. endif enddo (time propagation loop) Acknowledgements. We thank the referee, Ralf Klessen, for the careful reading of the manuscript. This work has been supported by the Swiss National Science Foundation.
References Aronson E.B., Hansen C.J., 1972, ApJ 177, 145 Beuther H., Kramer C., Deiss B., Stutzki J., 2000, A&A, accepted for publication Binney J., Tremaine S., 1994, Galactic Dynamics, Princeton University Press, Princeton, New Jersy Brahic A., 1977, A&A 54, 895 Principles of Stellar Dynamics, Dover Publications, New York Casoli F., Combes F., 1982, A&A 110, 287 Combes F., 1999, CeMDA 72, 91 Dame T.M., Hartmann D., Thaddeus P., 2000, to be published in ApJ, astro-ph/0009217 Dehnen W., 2000, accepted for publication in MNRAS, astroph/0011568 Elmegreen B.G., Sungeun K, Staveley-Smith L., scheduled for ApJ 548, Feb 10, 2001, astro-ph/0010578 Elmegreen B.G., Falgarone E., 1996, ApJ 471, 816 Falgarone E., Perault M., 1987, in Physical Processes in Interstellar Clouds, eds. Morfill TG.E., Scholer M., Dordrecht: Reidel, 59 Falgarone E., Puget J-L., Perault M., 1992, A&A, 257, 715 Goldreich P., Lynden-Bell D., 1965, MNRAS, 130, 125 Griv E., Rosenstein B., Gedalin M., Eichler D., 1999, A&A 347, 821 Heithausen A., Stutzki J., Bensch F., Falgarone E., Panis J.-F., 1999, Astr. Ges.: Rev. Mod. Astr. 12, 201 Hertel P., Thirring W., 1971, CERN preprint TH 1338, 309 Hill G.W., 1878, Am. J. Math. 1, 5 Hockney R.W., Eastwood J.W., 1981, Computer Simulation Using Particles, McGraw-Hill, New York Huber D., 2001, in The Promise of FIRST, eds. Pilbratt G.L., Cernicharo J., Heras A.M., Prusti T., Harris R., ESA SP460, in press, astro-ph/0101265 Huber D., Pfenniger D., 1999, in The Evolution of Galaxies on Cosmological Timescales, eds. Beckman J.E. and Mahoney T.J., Astrophysics and Space Science, in press, astroph/9904209 Huber D., Pfenniger D., 2001, in The Promise of FIRST, eds. Pilbratt G.L., Cernicharo J., Heras A.M., Prusti T., Harris R., ESA SP-460, in press, astro-ph/0101264 Joyce M., Montuori M., Pietronero L., Sylos Labini F., 1999, ApJ 514, L5 Julian W.H., Toomre A., 1966, ApJ 146, 810
Kuhlman B., Melott A.L., Shandarin S.F., ApJ 470, L41 Larson R.B., 1979, MNRAS 186, 479 Larson R.B., 1981, MNRAS 194, 809 Regular and Stochastic Motion, Springer, New York Lynden-Bell D., Wood R., 1968, MNRAS 138, 495 Mandelbrot B., 1982, The Fractal Geometry of Nature, Freeman, San Fransisco McMillan W.D., 1958, The Theory of the Potential, Dover Publications, New York Miller R.H., 1964, ApJ 140, 250 Miller R.H., Prendergast K.H., Quirk W.J., 1970, ApJ 161, 903 Miller R.H., 1994, in Ergodic Concepts in Stellar Dynamics, p. 137, eds. Gurzadyan V.G., Pfenniger D., Springer Myers P.C., Goldman A.A., 1988, ApJ, 329, 392 Pfenniger D., Norman C., 1990, ApJ 363, 391 Pfenniger D., Friedli D., 1991, A&A 252, 75 Pfenniger D., Friedli D., 1993, A&A 270, 561 Pfenniger D., Combes F., 1994, A&A 285, 94 Pfenniger D., 1994, in Ergodic Concepts in Stellar Dynamics, p. 111, eds. Gurzadyan V.G., Pfenniger D., Springer Pfenniger D., 1996, in Barred Galaxies, p.273, eds. Buta R., Crocker D.A., Elmegreen B.G., A.S.P. Conf. Ser., Vol 91, San Francisco Pfenniger D., 1998, in H2 in the Early Universe , eds. Palla F., Corbelli E., Galli D., Memorie Della Societa Astonomica Italiana, 429 Press W.H., Flannery B.P., Teukolsky S.A., Vetterling W.T., 1986, Numerical Recipes, Cambridge University Press Safronov V.S., 1960, Ann. d’Astrophysique 23, 979 Scalo J.M., 1985, in Protostars and Planets II, p.201, eds. Black D.C. and Matthews M.S., Univ. of Arizona Press Astrophysics, p. 97, eds. Buchler J.R. and Eichhorn H., New York Academy of Science, New York Salo H., 1995, ICAR 117, 287 Schwarz M.P., 1984, MNARS, 209, 93 Sellwood J.A., Carlberg R.G., 1984, ApJ 282, 61 Semelin B., 1999, Ph.D. Thesis. Universit´e Paris 6 Semelin B., Combes F., 2000, to be published in A&A, astroph/0007119 Stanimirovi´c S., Staveley-Smith L., Dickey J.M., Sault R.J., Snowden S.L., 1999, MNRAS 302, 417 Stanimirovi´c S., Lazarian A., 2001 accepted for publication in the ApJ Let., astro-ph/0102191 St¨ orzer H., Zielinsky M., Stutzki J., Sternberg A., 2000, A& A 358, 682 Sylos Labini F., Montuori M., Pietronero L., 1998 Phys. Rep. 293, 66 Tauber J.A., Goldsmith P.F., Dickman R.L., 1991, ApJ 375, 635 Toomre A., 1964, ApJ 139, 1217 Toomre A., 1981, in The Structure and Evolution of Normal Galaxies, p. 111, eds. Fall S.M. and Lynden-Bell D., Cambridge Univ. Press Toomre A., 1990, in Dynamics and Interactions of Galaxies, p. 292, ed. Wielen R., Springer-Verlag Toomre A., Kalnajs A.J., 1991, in Dynamics of Disc Galaxies, p. 341, ed. Sundelius B., G¨ oteborg Univ. Press Vogelaar M.G.R., Wakker B.P., 1994, A&A, 291, 557 von Weizs¨ acker C.F., 1951, ApJ 114, 165 Westpfahl D.J., Coleman P.H., Alexander J., Tongue T., 1999, AJ 117, 868 Wisdom J., Tremaine S., 1988, Astron. J. 95, 925 Zeldovich Ya.B., 1970, A&A 5, 84