LUZZU – A Framework for Linked Data Quality Assessment Jeremy Debattista
University of Bonn
[email protected] Christoph Lange
[email protected]
University of Bonn / Fraunhofer IAIS, Germany
University of Bonn / Fraunhofer IAIS, Germany
[email protected]
[email protected]
arXiv:1412.3750v1 [cs.DB] 11 Dec 2014
ABSTRACT The Web meanwhile got complemented with a Web of Data. Examples are the Linked Open Data cloud, the RDFa and Microformats data increasingly being embedded in ordinary Web pages, or the schema.org initiative. However, the Web of Data shares many characteristics with the original Web of documents, for example, varying quality. There are a large variety of dimensions and measures of data quality. Hence, the assessment of of quality in terms of fitness for use with respect to a certain use case is challenging. In this article, we present a comprehensive and extensible framework for the automatic assessment of linked data quality. Within this framework we implemented around 30 data quality metrics. A particular focus of our work is on scalability and support for the evolution of data. Regarding scalability, we follow a stream processing approach, which provides an easy interface for the integration of domain specific quality measures. With regard to the evolution of data, we introduce data quality assessment as a stage of a holistic data life cycle.
Categories and Subject Descriptors The Web of Data [Vocabularies, taxonomies and schemas for the web of data]
General Terms Documentation, Measurement, Quality, Ontology
1.
INTRODUCTION
The Web meanwhile got complemented with a Web of Data. Examples are the Linked Open Data cloud [7], the RDFa and Microformats data increasingly being embedded in ordinary Web pages (cf. Web Data Commons1 ) or the schema.org initiative. Also, the Web of Data shares many characteristics with the original Web of documents. As on the Web of documents, we have very varying 1
Santiago Londoño
University of Bonn
http://webdatacommons.org
Copyright 20XX ACM X-XXXXX-XX-X/XX/XX ...$15.00 http:// dx.doi.org/10.1145/2506182.2506197.
Sören Auer
quality on the Web of Data. Quality on the Web of documents is usually measured indirectly using the page rank of the Web documents as an indicator. The reason for this is that the document quality is only subjectively assessable and thus an indirect measure such as the number of links created by others to a certain Web page is a good approximation of quality. On the Web of Data the situation is on the one hand simpler and on the other hand more complex. There are a large variety of dimensions and measures of data quality [25], which can be automatically be computed so we do not have to rely on indirect indicators alone. On the the other hand, the assessment of of quality in terms of fitness for use [15, 14, 24] with respect to a certain use case is more challenging. Even datasets with quality problems might be useful for certain applications, as long as the quality is in the required range. For example, data extracted from semi-structured sources, such as DBpedia [20, 22], often contains inconsistencies as well as misrepresented and incomplete information. However, in the case of DBpedia the data quality is perfectly sufficient for enriching Web search with facts or suggestions about general information, such as entertainment topics. In such a scenario, DBpedia can be used to show related movies and personal information, when, a user searches for an actor. In this case, it is rather neglectable, when in relatively few cases, a related movie or some personal facts are missing. For developing a medical application, on the other hand, the quality of DBpedia is probably insufficient, as shown in [26], since data is extracted from a semi-structured source created in a crowdsourcing effort (i.e. Wikipedia). It should be noted that even the traditional, document-oriented Web has content of varying quality but is still commonly perceived to be extremely useful. Consequently, a key challenge is to determine the quality of datasets published on the Web and make this quality information explicit. Assuring data quality is particularly a challenge in Linked Data as the underlying data stems from a set of multiple autonomous and evolving data sources. Linked data quality can be measured along several dimensions, including accessibility, interlinking, performance, syntactic validity or completeness (cf. the linked data quality survey [25] for a comprehensive discussion). In each of these dimensions, we can define a number of concrete metrics, which can be used to measure a certain indicator for linked data quality. For interlinking, for example, we can measure (1) the number of links to (or backlinks from) external resources in a dataset, (2) the interlinking degree, (3) the clustering coefficient or (4) the centrality. Additionally domain specific quality metrics can be defined, such as the number of links to an authoritative dataset. For a cultural heritage dataset, for example, the ratio of resources being linked to the Integrated
Authority File (GND2 ) is of crucial importance. In this article, we present a comprehensive and extensible framework for the assessment of linked data quality. We implement a large number of the data quality metrics from [25]. A particular focus of our work is on scalability and support for the evolution of data. Regarding scalability, we follow a stream processing approach, which provides an easy, declarative interface for the integration of domain specific quality measures. With regard to the evolution of data, we introduce data quality assessment as a stage of a holistic data life cycle. Our quality assessment framework is accompanied by a comprehensive set of ontologies for capturing quality related information, such as quality measures, issues and reports. Even with the possibility to automatically compute quality measures, the large number of quality dimensions and measures complicates the user’s task of judging whether a dataset is fit for use. We address this problem by developing an approach for quality-based filtering and ranking of datasets, which allows users to select and weight quality dimensions and measures important for their particular use case. As a result, we can filter and rank datasets according to a certain use case and suggest the most suitable ones. The article is structured as follows: We outline the stages of the data quality lifecycle in Section 2. The Luzzu data quality assessment framework as well as the respective quality ontologies are presented in Section 3. Our declarative language for defining domain specific quality metrics is described in Section 4. We tackle quality based filtering and ranking in Section 5. We evaluate the performance of our quality assessment framework in Section 6. We discuss our work in the light of related work in Section 7 and conclude with an outlook on future work in Section 8.
2.
THE DATA QUALITY LIFECYCLE
We deem that data quality can not be tackled in isolation, but should be considered holistically involving other stages of the data management lifecycle. Quality assessment on its own cannot improve the quality of a dataset. In particular, data curation plays an important role in maintaining datasets ensuring that data can be preserved and reused in the future. It is also a data renewing process that warrants “knowledge workers to have access to accurate, high-quality and trusted [data]” [6]. Quality assessment provides the user with the current quality status of a dataset and (in some frameworks, such as our Luzzu framework presented in Section 3) with a quality problem report based on the assessed metrics. In this article, we propose the Data Quality Lifecycle (Figure 1) where all the phases from the assessment of data, to cleaning and storing are represented. The data quality lifecycle includes: 1. Metric Identification and Definition Quality assessment is different for every domain and sometimes even between different use cases in a single domain. In this process, domain experts (who can also be knowledge engineers) identify a set of both domainindependent metrics and domain-specific quality metrics that they deem suitable for the task at hand. For example, datasets in the geographical domain require that each resource that is locatable on a map has the properties geo:long and geo:lat defined. After the identification process, the metrics are defined so that the concerned dataset could be assessed upon them. In Luzzu, domain experts can define metrics either in a simple declarative fashion using the LQML (cf. Section 4), or in a more complex imperative way using a Java interface class (cf. Section 3.2.2). 2. Assessment During this stage, a dataset is assessed against 2
German “Gemeinsame Normdatei”; see http://www.dnb.de/
EN/gnd
2.# Assessment#
1.#Metric# Iden@fica@on# and# Defini@on#
5.# Explora@on/ Ranking#
3.#Data# Repairing#and# Cleaning#
4.#Storage/ Cataloguing/ Archiving##
Figure 1: The stages of the data quality lifecycle.
the quality metrics identified and defined in the previous lifecycle stage. In this article we describe a process workflow (cf. Figure 2) for quality assessment. The Luzzu framework (cf. Section 3) provides the necessary tools to assess a dataset and provide both quality metadata and a quality report, which will be used in the following stage of the lifecycle. The Quality Assessment process is the main focus of this work. 3. Data Repairing and Cleaning Ensuring a higher quality dataset and an ongoing evolution of data requires data repairing and cleaning to be performed. Data repairing deals with problems concerning violations of logical constraints in a dataset, while data cleaning aims at rectifying errors in a dataset which render the dataset incorrect with regard to syntax or semantic aspects not covered by the RDFS or OWL logics. The former can be done automatically, whilst the latter might require user intervention. Data cleaning can be performed in various ways, such as using crowdsourcing techniques [16]. The quality problem report generated by the Luzzu framework can be fed into a data cleaning application that handles this semi-automatic task. Currently, in the Luzzu quality assessment framework, we do not employ any (semi-)automatic data cleaning or repairing techniques, but aim to leverage crowdsourcing for the cleaning of linked data resources in the future. 4. Storage, Cataloguing and Archiving In this stage, datasets, possibly cleaned, are stored and archived together with their quality metadata. Data portals crawl these datasets and make them available to the data consumers. Having quality metadata available with the datasets themselves, these portals can easily catalogue the datasets based on different quality criteria. This stage of the lifecycle is beyond the scope of the Luzzu quality assessment framework, but the quality reports generated by Luzzu and archived together with the datasets enable the tracking of the quality evolution. In particular, by analysing the quality evolution over time various strategies for data curation (e.g. based on crowd-sourcing, domain expert contributions or application of automated techniques) can be more effectively evaluated and compared. 5. Exploration and Ranking Finding a dataset suitable for a use case is sometimes a daunting task. Currently, portal engines such as CKAN 3 , provide faceted browsing and ranking features to search within large datasets using particular tags. Having quality metadata attached to datasets, such human-friendly data portals will provide 3
http://www.ckan.org
Quality' Assessment'
Communication Layer
Annota-on'
Quality Assessment Unit
Figure 2: Overall quality framework workflow.
the possibility to filter and rank datasets based on their quality, thus facilitate choosing the most suitable dataset for a certain use case. The flexibility of the Dataset Quality Ontology (cf. Section 3.1.1) enables data consumers to track and follow quality improvements over time (possibly over iterations of this data quality lifecycle) using various visualisation techniques [9]. The Luzzu Quality Assessment framework provides an interface for ranking (cf. Section 5) datasets based on their quality metadata, while it also generates (cf. Section 3.1.2) multi-dimensional quality metadata.
3.
3.1
Knowledge Layer
The Knowledge Layer is composed of three units, namely the Semantic Schema Layer, Annotation Unit, and Operations Unit. These units assist to the provision of quality metadata and other operations upon the same metadata. In the following we discuss each unit in more detail.
Opera;ons Unit
Assessment Layer
Knowledge Layer
Figure 3: High-level architecture of the Luzzu quality framework.
THE FRAMEWORK
The framework follows the workflow described in Figure 2. The workflow starts with the metric initialisation process, which compiles declarative metrics defined using the Luzzu Quality Metric Language (LQML) and initialises them along with Java defined metrics. The quality assessment process is then commenced, where the statements of the chosen dataset are fed into the assessment algorithms of the initialised quality metrics. Once this process is completed, the annotation generates quality metadata and compiles a comprehensive quality report. The quality report produced in this framework enables data curators to improve the dataset’s quality, using the report to identify quality issues within the dataset. This tool can be easily integrated into collections such as Linked Data Stack [1] to enhance them with a quality assessment workflow. Figure 3 illustrates the high level architecture of the Luzzu quality framework. The framework comprises three layers: Communication Layer, Assessment Layer and Semantic Layer. The Communication Layer exploits the framework’s interfaces as a REST service.In remainder of this section, we will give a detailed description of the Knowledge and Assessment layers.
Annota;on Unit
Seman;c Schema Layer
In this section, we present the comprehensive Luzzu Assessment Quality Framework, which provides support for the various stages of the data quality lifecycle. The rationale of the Luzzu Quality Framework is to provide an integrated platform that: (1) assesses Linked Data quality using a library of generic and user-provided domain specific quality metrics in a scalable manner; (2) provides queryable quality metadata on the assessed datasets; (3) assembles detailed quality reports on assessed datasets. Furthermore, we aim to create an infrastructure that: • can be easily extended by users by creating their custom and domain-specific pluggable metrics, either by employing a novel declarative quality metric specification language or conventional imperative plugins; • employs a comprehensive ontology framework for representing and exchanging all quality related information in the assessment workflow; • implements quality-driven dataset ranking algorithms facilitating use-case driven discovery and retrieval.
Processing Unit
LQML Compila;on Unit
LMI, DRMO, …
Operational Level
Quality Metrics (e.g. DQM)
Specific Representation Level
Quality Report Ontology (QPRO) Dataset Quality Ontology (daQ)
Generic Representation Level
Data Cube Vocabulary
Representation Level
Metric' Initalisa-on'
Figure 4: Structure of the data quality ontology framework.
3.1.1
Semantic Schema Layer
The Quality Framework is based on semantic technologies and thus has an underlying semantic schema layer. The semantic schema layer consists of two levels: 1. representation (split into generic and specific sub-levels) and 2. operational level. Figure 4 shows the ontology framework hierarchy, whilst Figure 5 depicts the relationships between the ontologies in the two levels. The lower level comprises generic ontologies which form the foundations of the quality assessment framework, whilst the upper level represents the specific ontologies required by the framework for the various tasks. The Dataset Quality Ontology (daQ)4 describes the quality metadata and is based on the RDF Data Cube Vocabulary5 . A preliminary version of daQ was presented in [9], but it has now been substantially improved and extended. daQ is the core vocabulary of this schema layer, and any ontology describing quality metrics added to the framework (in the specific representation level) should extend it. The Quality Problem Report Ontology (QPRO) enables the fine-grained description of quality problems found while assessing a dataset. The generic representation level is domain independent, and can be easily reused in similar frameworks for assessing quality. As part of the Luzzu Quality Assessment framework, we implement a comprehensive library of quality metrics related to linked data, which were obtained from the Linked Data Quality survey [25]. We developed the Data Quality Metric (dqm) Ontology for formally describing and representing the metrics as part of the 4 All defined ontologies in Luzzu have the namespace http:// purl.org/eis/vocab/. For each ontology then one should add
the relevant ontology prefix e.g. daq. 5
http://www.w3.org/TR/vocab-data-cube/
qpro:QualityProblem
lmi:LuzzuMetric JavaImplementation
lmi:referTo
qpro:isDescribedBy
dqm:Extensional Conciseness rdfs:subClassOf
daq:hasObservation daq:Metric)
qb:Observa.on) daq:metric
daq:QualityGraph
rdfs:subClassOf
qb:DataSet)
Figure 5: Key relationships in the data quality ontologies.
specific representation level. The highest level in the schema framework is the operational level. This level comprises a number of ontologies that assist the framework to perform certain tasks. The Luzzu Metric Implementation ontology (LMI) is a vocabulary that enables the metrics specified in terms of daQ to be connected to their Java implementations. Such definitions include packages and classes required to be loaded from the external jar. We envisage that blueprint descriptions can be stored and shared in a common pool of metrics, similar as how IFTTT6 shares rule recipes between different users. In this case, the extension and reuse of an ontology such as the Digital.Me Rule Management Ontology (DRMO)7 [10] enables to describe blueprints. Dataset Quality Vocabulary. The Dataset Quality Ontology (daQ) is a vocabulary for attaching the results of quality benchmarking of a linked open dataset to the dataset itself. The rationale of daQ is to provide a core vocabulary that defines how quality metadata should be represented at an abstract level. This ontology can be easily extended with additional metrics (such as the DQM ontology described above) for measuring the quality of a dataset. The benefit of having an extensible schema is that quality metrics can be added to the vocabulary without major changes, as the representation of new metrics would follow those previously defined. The basic and most fundamental concept of daQ is the Quality Graph, which is a subclass of rdfg:Graph [5]. The daQ ontology distinguishes between three layers of abstraction, based on the survey by Zaveri et al. [25]. A quality graph comprises a number of different Categories (daq:Category), which in turn possess a number of quality Dimensions (daq:Dimension). A quality dimension groups one or more quality Metrics (daq:Metric). Each daq:Metric instance can have one or more qb:Observation, where each observation, amongst other data, describes the timestamp and the observed value, i.e. the value computed for the metric. For a thorough discussion of the ontology, we refer the reader to [8, 9]. Quality Problem Report Ontology. The Quality Problem Report Ontology (QPRO) comprises the two classes qpro:QualityReport and qpro:QualityProblem. The former represents a report on the problems detected during the assessment of quality on a dataset, whilst the latter represents the individual quality problems contained in that report. The following properties are defined: • qpro:computedOn refers to the URI of the dataset on 6 If This Than That is an online service allowing users to create simple rules that trigger events: https://ifttt.com/ 7 http://www.semanticdesktop.org/ontologies/2012/ 03/06/drmo/
which a certain quality assessment has been performed. This property is attached to a qpro:QualityReport. • qpro:hasProblem identifies problem instances in a report and links a qpro:QualityProblem to a qpro:QualityReport. • qpro:isDescribedBy describes each qpro:Quality Problem using an instance of a daq:Metric. • qpro:problematicThing represents the actual problematic instance from the dataset. This can be a list (rdf:Seq) of resources or of reified statements. • qpro:inGraph defines the assessed graph, since quality assessments can be performed on multiple graphs. This property allows us to add the graph (if any) from which the corresponding problematic triple can be found. Listing 1 shows an excerpt of an example dataset containing the instance ex:JoeDoe who belongs to the class foaf:Researcher working for the organization ex:UniBonn. It contains three problematic triples: (A) h ex:JoeDoe a foaf:Researcher i – The problem in this triple is the usage of the undefined class foaf:Researcher; (B) h ex:JoeDoe rdfs:label "JoeDoe" i – The literal ("JoeDoe") in the triple causes the capitalisation metric to point out a problem (as labels should be written in a humanfriendly style); (C) h ex:UniBonn rdfs:label "UniBonn" i – The literal ("UniBonn") in the triple causes the capitalisation metric to point out a problem in this triple. Listing 2 represent these three problems using the Quality Problem Report ontology. ex:JoeDoe a foaf:Researcher ; rdfs:label "JoeDoe" ; ex:worksFor ex:UniBonn . ex:UniBonn rdfs:label "UniBonn" ; foaf:name "University of Bonn" .
Listing 1: An excerpt of a typical dataset ex:QualityReport a qpro:QualityReport ; qpro:computedOn ; qpro:hasProblem ,, . a qpro:QualityProblem ; qpro:isDescribedBy ; qpro:problematicThing [ rdf:subject ex:JoeDoe ; rdf:predicate rdf:type ; rdf:object foaf:Researcher ] . a qpro:QualityProblem ; qpro:isDescribedBy ; qpro:problematicThing [ rdf:subject ex:JoeDoe ; rdf:predicate rdfs:label ; rdf:object "JoeDoe" ] . a qpro:QualityProblem ; qpro:isDescribedBy ; qpro:problematicThing [ rdf:subject ex:UniBonn ; rdf:predicate rdfs:label ; rdf:object "UniBonn" ] .
Listing 2: A corresponding quality report for Listing 1
3.1.2
Annotation Unit
Output: Problem Report
The Semantic Annotation Unit generates quality metadata and quality reports for each metric assessed. The annotation unit is based on the two core ontologies – daQ and QR. With regard to the quality problem reports, the unit compiles a set of triples consisting of problematic triples found during the metric assessment of a dataset. The user can then use the generated quality problem report in a data cleaning tool that supports the Quality Report Ontology to clean the dataset.
3.1.3
Processing Unit
The Processing Unit controls the whole execution of the quality assessment of a chosen dataset. In Luzzu we implement two stream processing units, one being based on Jena and the other on Spark, which pass input statements to all initialised metrics. Streaming ensures scalability (since we are not limited by main memory) and parallelisability (since the parsing of a dataset can be split into several streams to be processed on different threads, cores or machines). Each data processor in the Quality Framework operates in three stages: (i) processor initialisation; (ii) processing; and (iii) memory clean up. Typically, an invoked processor has two inputs: (1) the dataset URI (for the sequential stream processor), and (2) a metric configuration file8 defining the metrics to be computed on the dataset. In the first stage (processor initialisation), the processor creates the necessary objects in memory to process data and loads the metrics defined in the configuration file. Once the initialisation is ready, the processing is performed by passing the streamed triples to the metrics. A final memory cleanup ensures that no unused objects are using unnecessary computational resources.
Sequential Streaming of Datasets. 9
Apache Jena provides the possibility of streaming triples sequentially in a separate thread implementing a producer-consumer queue. A dataset, which can be serialised in many typical RDF formats (RDF/XML, N-Triples, N-Quads etc.), is read directly from the disk storage. Triple statements are read as string tokens, which the Jena API then transforms into triple or quad objects. Another approach for sequential stream processing is to use a map-reduce style Hadoop technology or its in-memory equivalent Spark10 . The idea is to map the processing of large datasets on multiple clusters, creating triples in the process. A simple function 8
Metric 1
Quad
Dataset
triple/quad
Metric 2
…
Metric n
Quality Report
Metric Value / Problematic Triples
Stream Processor
Annota/on Unit
Quality Metadata
Figure 6: Quality Assessment Process
Assessment Layer
The Knowledge Layer is composed of three units, namely the Processing Unit, the LQML Compilation Unit, and the Quality Assessment Unit. These units handle the operations related to the quality assessment of a dataset.
3.2.1
Invoke
Quality Assessment Unit
Operations Unit
The Operations Unit does not interact with the quality assessment directly. Currently, this unit provides algorithms for day-today use of the quality metadata which include an algorithm for quality-driven ranking of datasets (cf. Section 5) For ranking we propose a user-driven ranking algorithm where the users can define weights on their preferred categories, dimensions or metrics. In the spirit of “fitness for use”, this process ensures that the returned ranking is based on the quality aspects prioritised by the user.
3.2
Communica/on Layer Input: Dataset and Metric Selection
then takes the results of the map to populate a queue that feeds the metrics.
Quality Assessment. Figure 6 depicts the quality assessment process. A user selects a dataset as well as the metrics required for the quality assessment. This information is passed to the quality framework via the communication layer, which then invokes the assessment process. The stream processor is then initialised by: (1) creating the necessary objects in memory, and (2) initialising the chosen metrics. In Figure 6, Metric 1 is shaded out to illustrate that it was not chosen by the user for this particular process. Once the objects have been created, the stream processor fetches the dataset and streams quads one by one to all initialised metrics. Since in Luzzu we have no control over the way metric processors perform their assessment algorithms, we optimise the assessment of datasets by parallelising metric computation into different threads, ensuring that the different metrics are computed at the same time. The pseudo code in Algorithm 1 shows this parallel process. While statements from the dataset are being pushed into the statementQueue, the process starts notifying all metric threads with the new statements. These statements are then pushed in the thread’s local queue waiting for being dequeued by the metric computation. Algorithm 1 Processing datasets for Quality Assessment Require: statementQueue; instiantiatedMetricSet while statementQueue 6= ∅ do Statement stmt = statementQueue.poll(); for all metricInstance ∈ instiantiatedMetricSet do notify metricInstance with stmt wait until all metrics finish their computations function M ETRIC P ROCESS(metricInstance) localBlockingQueue = ∅ while localQueue 6= ∅ do metricInstance.compute(localBlockingQueue.pop())
A typical metric configuration file can be found at:
http://eis-bonn.github.io/Luzzu/config.trig 9 http://jena.apache.org/ 10 http://{hadoop,spark}.apache.org/
function M ETRIC P ROCESS . NOTIFY(statement) localBlockingQueue.push(statement)
After all statements have been assessed, the annotation unit requests the assessment results for each metric and creates (or updates) the quality metadata graph. This metadata is stored along with the dataset itself. It allows us to rank and crawl datasets based on different quality attributes. The annotation unit also requests problematic triples and prepares a quality report that is passed back to the user via the communication layer. This marks the end of a successful quality assessment process.
3.2.2
Quality Assessment Unit and LQML Compilation Unit
The Quality Assessment Unit is the most important unit of the Quality Framework. Third parties can extend the framework by creating custom metrics and plugging them into the framework. One foreseeable obstacle is that Java experts are needed to create these metrics, using traditional imperative classes, following a defined interface. Therefore, our framework also provides the Luzzu Quality Metric Language (LQML; cf. Section 4), thus enabling knowledge engineers without Java expertise to create quality metrics in a declarative manner. This is attributable to the fact that LQML caters for varying linked data quality metrics, which can be as basic as matching a particular triple pattern. Java implementations of metrics can be either simple metrics or complex metrics. For the former, the developer would define the action to be performed once a triple has been consumed from the processing unit. On the other hand, the implementation of a complex metric is necessary when the quality evaluation requires pre-processing or post-processing of data.
4.
DECLARATIVE METRIC DEFINITION
It often occurs that data scientists, whose spectrum ranges from data publishers and consumers to domain experts and knowledge engineers, are not Java experts but still want to define specific quality metrics for their data. The Luzzu Quality Metric language (LQML) is a structural declarative language that enables simple definition of quality metrics (called blueprints). Based on our experience from the use cases of the DIACHRON FP7 EU project11 , we anticipate that most domain-specific quality metrics are very similar structure-wise with minor changes required only in the rules’ conditions. These metric blueprints can be stored in an online pool, reused and modified by different data scientists. We present an overview of the LQML syntax and a blueprint example.
Quality Metric Structure. A blueprint definition of a metric starts with the def keyword and has a rule semantics. If a triple matches the given condition, the given action is triggered. Rules and Actions. Declarative rules start with the keyword match. Any input triple “?s ?p ?o” is matched against the conditions that follow the match keyword, enclosed into curly brackets ({ }). A rule can have one or more conditions. Conditions can be connected via the logical and (&) operator or the logical or (|) operator. Conditions can be one of the following: Name Description typeof(?s|?o)checks the type of subject or object. typeof(?s) == translates to triple pattern “?s a ”; typeof(?o) == translates to “?o a ”. ?s == matches the subject against a IRI. ?p == matches the predicate against a IRI. ?o == x matches object against IRI or literal 11
http://diachron-fp7.eu
A condition can trigger one of the following actions: • map[?s,?o] adds the subject and the object to a hash map as key/value (where the value is a list of objects); • count increments a counter. Metric Description. The definition also expects other information that describes a quality metric. The metric keyword expects a defined quality metric resource URI. These resources are defined in an ontology that extends the Dataset Quality Ontology (daQ). Descriptive human-readable comments are also required in these blueprints. We provide the keywords label and description to provide the metric’s name and its textual description; they translate to rdfs:label and rdfs:comment.
Grammar. The following listing shows the EBNF grammar for the main parts of the LQML syntax. ::= < Match> ::= "def" ::= "metric" < SemiColon> ::= "match" ()+ ::=
|
::= "typeof" "?s" < boolean_operator> ::= "?s" < RParen> | "?p" | "?o" ( | < Quoted_Str> ) ::= refer to RFC 3987 [11]
Listing 3: LQML EBNF grammar
Blueprint Example. One of these services of the European Bioinformatics Institute (EBI) is to provide linked datasets to the scientific community, with their main development focusing around the Experimental Factor Ontology (EFO). The EFO ontology is then used to annotate data in a number of databases at the EBI. EFO is an evolving ontology by nature and concepts from external ontologies are constantly being added (or replaced) in the EFO. In order to keep up the quality within the EFO, domain experts from the institute defined relevant quality metrics. One relevant metric is that they keep count of how many resources are actually defined as sub-classes (rdfs:subClassOf). Listing 4 shows an LQML metric definition for the above. Once declarative metrics are parsed, these are compiled into Java classes and initialised as part of the metrics that can be assessed in the Luzzu framework. def{SubClassCounter}: metric{}; label{"SubClassCountingMetric"}; description{"Provides a measure for counting the number of resources that are defined as sub-classes"}; match{(?p == rdfs:subClassOf)}; action{count}.
Listing 4: LQML example
5.
QUALITY-BASED RANKING
FILTERING
&
Tools for data consumers, such as the CKAN data portal software, provide features such as faceted browsing and sorting, in order to allow prospective dataset users to search within a large dataset archive. Using faceted browsing, datasets can be filtered according to tags or values of metadata properties. The datasets can also be ranked or sorted according to values of properties such as relevance, size or the date of last modification. With many datasets available, filtering or ranking by quality can become a challenge. Considering “quality” to be a a single, absolute measure does not make sense, as different aspects of quality matter for different applications. It does, however, make sense to restrict quality-based filtering or ranking to those quality categories or dimensions that are relevant in the given situation, or to assign custom weights to different dimensions, and compute the overall quality as a weighted sum. Our framework enables flexible filtering and ranking in that the daQ vocabulary facilitates access to dataset quality metrics in these different dimensions and thus facilitates the (re)computation of custom aggregated metrics derived from base metrics. To keep quality metric information easily accessible, each assessed dataset should contain the relevant daQ quality metadata graph in the dataset itself, once it has been computed. We provide a ranking algorithm that ranks dataset based on the quality aspects a user deems suitable for his task. The algorithm takes into consideration the facet filters chosen by the user and any weight given to them, where the sum of all defined weights has to be 1. Let v : Fm → {R ∪ N ∪ B ∪ . . .} be the function that yields the value of a metric (which is, most commonly, a real number, but could also be an integer, a boolean, or any other simple type).
Ranking by Dimension. When users want to rank datasets in a less fine-grained manner, they assign weights to dimensions. The weighted value of the dimension D is computed by evenly applying the weight θ to each metric m in the dimension. D EFINITION 2
(W EIGHTED DIMENSION VALUE ). P P v(m) m∈D v(m, θ) = θ m∈D v(D, θ) := #D #D
Listing 6 shows a typical SPARQL query to retrieve from a quality graph the total number of metrics available in a dimension. dimensionURI is the URI of the current dimension being calculated, whilst ontologyURI is the ontology where quality metrics are defined. SELECT count(?metricTypeURI) WHERE { ?typeURI rdf:type ?metricTypeURI . GRAPH { ?metricTypeURI rdfs:subClassOf daq:Metric . ?prop ?metricTypeURI . ?prop rdfs:subPropertyOf daq:hasMetric } }
Listing 6: Retrieving metric assessment value from the Quality Graph.
Ranking by Category. A category (C) is defined to have one or more dimensions (D), thus similar to the previous case, ranking on the level of categories requires distributing the weight chosen for a category over the dimensions in this category and then applying Definition 2. D EFINITION 3
Ranking by Metric. Ranking datasets by individual metrics requires computing a weighted sum of the values of all metrics chosen by the user. Let mi be a metric, v(mi ) its value, and θi its weight (i = 1, . . . , n), then the weighted value v(mi , θi ) is given by: D EFINITION 1
(W EIGHTED METRIC VALUE ). v(mi , θi ) := θi · v(mi )
Pn The sum i=1 v(mi , θi ) of these weighted values, with the same weights applied to all datasets, determines the ranking of the datasets. Listing 5 shows a typical SPARQL query to retrieve metric assessment values from the Quality Graph. In this query the metric value of the latest observation is taken into consideration. SELECT ?metric, ?value WHERE { ?graph a daq:QualityGraph . GRAPH ?graph { ?metric a ?metricType . ?metric daq:hasObservation ?obs . ?obs daq:value ?value . ?obs daq:dateComputed ?dateComputed . } GRAPH { ?metricType rdfs:subClassOf daq:Metric . } } ORDER BY DESC(?dateComputed) LIMIT 1
Listing 5: Retrieving metric assessment value from the Quality Graph.
6.
(W EIGHTED CATEGORY VALUE ). P D∈C v(D, θ) v(C, θ) := #C
EVALUATION
The Luzzu framework is currently employed as the backend framework to assess data quality in the DIACHRON project, where a number of domain specific metrics are implemented. Moreover, we are also implementing domain-independent metrics identified by Zaveri et al. [25]. We provide a Web User Interface (UI) as a prototype12 for the cataloging and archiving of datasets with quality metadata, together with ranking and filtering facilities. The Web UI is implemented in PHP and JavaScript on top of the Semantic Data Wiki OntoWiki13 . Currently, pointers to assessed datasets are stored in the OntoWiki backend together with their quality metadata. The CubeViz14 extension is used to visualise statistical graphs about the quality metadata of the datasets. The rationale is that users can interactively assess any dataset they desire following the proposed workflow, except for the cleaning stage. For a systematic evaluation of Luzzu, we take two different perspectives. We start by evaluating the performance of the stream processors described in Section 3.2.1. In this experiment we measure the scalability of the processors with the addition of more triples, and introduction of new metrics to the framework. For the second perspective, in the last part of the evaluation, we apply the “cognitive dimensions of notations methodology” [3] to evaluate the usability of the Luzzu Quality Metric Language (LQML). 12
http://tinyurl.com/luzzuQA http://aksw.org/Projects/OntoWiki.html 14 http://aksw.org/Projects/CubeViz.html 13
1066"
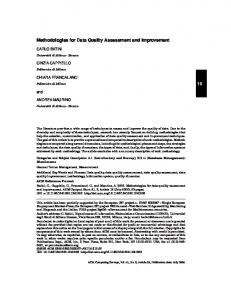
Here we evaluate the performance of the Luzzu stream processors described in Section 3.2.1. The aim of this experiment is to understand up to what size of a dataset the stream processors operate in an acceptable time. Runtime is measured for both processors against a number of datasets ranging from 10,000 triples to 100,000,000 triples and also against a number of different metrics (up to 9). Since the main goal of the experiment is to measure the stream processors’ performance, having datasets with different quality problems is considered to be irrelevant at this stage. Therefore for the scope of this evaluation we generated datasets of different sizes using the Berlin SPARQL Benchmark (BSBM) V3.1 data generator15 . BSBM is primarily used as a benchmark to measure the performance of SPARQL queries against large datasets. We generate datasets with a scale factor of 24, 56, 128, 199, 256, 666, 1369, 2089, 2785, 28453, 70812, 284826, which translates into approximately 10K, 25K, 50K, 75K, 100K, 250K, 500K, 750K, 1M, 10M, 25M, 50M and 100M triples respectively. The result of the performance evaluation meets our expectations of having a linearly scalable processor, whilst metrics affect the runtime of the stream processor. The results also confirm the assumption that big data technologies such as Spark are not beneficial for smaller datasets. All tests are run on a Google Cloud platform, with three worker clusters set up for the Spark stream processors.
Log10 Time in milliseconds
Performance Evaluation
1055" 1044" 1033" 1022" 1011" 1000" 3" 103
• • • • • • • • •
(A5) Dereferenceability of Forward Links (≈ 5.221s) (L2) Detection of a Human Readable License (≈ 5.334s) (L1) Detection of a Machine Readable License (≈ 5.228s) (I3) Dereferenceability of Backward Links (≈ 14.364s) (I2) Linkage Degree of Linked External Data Providers (≈ 25.415s) (U1) Detection of a Human Readable Labels (≈ 6.283s) (RC1) Short URIs (≈ 5.069s) (SV3) Identification of Literals with Malformed Datatypes (≈ 5.346s) (CN2) Extensional Conciseness (≈ 5.376s)
Results. Figure 7 and 8 show the time taken (in ms) to process datasets
15
http://wifo5-03.informatik.uni-mannheim.de/ bizer/berlinsparqlbenchmark/spec/ 16 Available at https://github.com/diachron/quality/ tree/luzzu-integration
5"
105
6"
106
7"
107
8"
108
Figure 7: Time vs. dataset size in triples – no metrics initialised. 1077" 1066" 1055" 1044" 1033" 1022" 1011" 1000" 3" 103
Choice of Metrics. The two main factors that affect a stream processor’s performance are the increase of number of triples in a dataset and the runtime complexity of a metric. Whilst an increase in dataset triples increases the stream processor runtime linearly, metrics themselves might be complex, such that the runtime performance suffers. From the implemented metrics16 , we decided to eliminate those metrics that require online access (e.g., to other datasets or vocabularies) to avoid runtime performance deterioration due to network latency. We thus chose nine metrics, a mix between very simple ones (i.e. those that require counting or simple pattern matching) and more complex ones, which might also benefit from using big data techniques. Discussing the details of metric implementation is out of the paper’s scope, but for the interested readers they are listed together with their respective average computation time for approximately 1M triples and their reference from [25].
4"
104
No. of Triples (Log10) x Stream Processor + Spark Processor
Log10 Time in milliseconds
6.1
4"
104
5"
6"
105 106 No. of Triples (Log10) 0"Metrics" 4"Metrics" 9"Metrics"
7"
107
8"
108
Figure 8: Time vs. dataset size with different metric initialisations. of different sizes17 . Figure 7 shows the time taken to process the datasets without computing any metrics. The latter chart shows the time taken to process and compute datasets with nine metrics. We normalised the values with a log (base 10) function on both axes to improve readability. As expected, both processors scale linearly as the number of triples grows. This is also observed when we added metrics to the processor. From these results, we also conclude that for up to 100M triples, the (Jena) stream processor performs better than the Spark processor. A cause for this difference is that the Spark processor has to deal with the extra overhead needed to enqueue and dequeue triples on an external queue, however, as the number of triples increases, the performance of both processors converges. Figure 8 shows how the stream processor fares with regard to the execution time when we initialise it with 0, 4 and 9 metrics. The performance of the processor still maintains a linear computation, showing that the execution time is longer as the number of initialised metrics is increased.
6.2
Cognitive Dimensions of Notation
In order to assess the usability of LQML, we gauge the language systematically against the “cognitive dimensions of notation” (CD) evaluation framework. This evaluation framework has previously been applied to Semantic Web languages (cf., e.g., [18]). These dimensions provide a comprehensive view of how users can manage and use a defined language. Each dimension describes a specific aspect in relation to the language notation. Blackwell and Green [4] describe the following 13 dimensions: 17
More performance evaluation results can be found at http://
eis-bonn.github.io/Luzzu/evaluation.html
Viscosity questions the effort required by the user to lead out a change. Assessment: LQML metrics can be defined using a simple text editor. Each statement is defined for a particular definition (blueprint) and is not related to other definitions. Therefore, changing a statement in a definition does not require a change in any other place, thus resulting in a low viscosity. Premature Commitment measures any planning required before leading out a task. Assessment: Based on declarative programming, LQML users only require to define rules based on the patterns they want to match. Also, declarations are not required before a blueprint definition. The only premature commitment is that metrics have to be defined in an ontology (whose URI is defined in the blueprint definition) based on the daQ ontology. Hidden Dependencies measures if dependencies are specifically indicated in all existing directions. Assessment: Blueprint definitions cannot be connected to each other, therefore each definition has a fixed rule and action, together with other descriptions. Error-proneness measures the possibility of users making mistakes while using the language. Assessment: A definition is made up of only five components. This means the learning curve is not too steep. However, since these five components must always be fixed in the same order, i.e. metric, label, description, match, action, there is an increased possibility of the user making a mistake, but this is mitigated by error messages from the LQML parser. Abstraction measures high level concepts which are not easily grasped by the users, since they do not refer to concrete instances. This dimension thus measures the language’s abstraction levels. Assessment: In LQML, blueprints are actual instances. In this way there is a very low level of abstraction. Secondary Notation indicates the availability of options for encoding extra context information within the syntax itself, such as comments. Assessment: A definition requires a description; further important information can be added in an unstructured way as comments (starting with #, extending to the end of the line). Closeness of Mapping measures the degree of similarity between the representation language and the real-world domain. Assessment: Our aim is to try to simplify the definition of metrics as much as possible, keeping in mind that possible non-Java experts are using this tool. Despite having this beneficial feature that widens the tool’s audience, expert users who require to create more complex metrics, for example, calculating the response time of a resource, must implement them in Java. Consistency measures the usability of the language; in other words how easy is it for a user to write similar blueprints once the notation pattern has been learned. Assessment: Unlike in the error-proneness dimension, we here consider that the fixed-syntax structure limitation is actually a feature, in a way that consistency is kept for all blueprint definitions. Diffuseness measures the space required by the notation; i.e. the amount of workspace occupied by the language. Assessment: Although the blueprints themselves have a clear goal, the rules within the definition might be messy and unclear since different conditions have to be defined in brackets. In LQML, users have to define the precedence of evaluating the conditions (using brackets). The fact that LQML blueprints are defined in a simple text editor means that users might find some difficulty in understanding a rule. Progressive Evaluation measures the understandability of the
language even for a solution that is incomplete. The possibility to try out a partial solution helps users in further understanding their work Assessment: It is possible to incrementally refine definitions by, e.g., starting with a partial match and a simple ‘count’ action, and then to further refine the matching pattern by adding conditions, and to define a more complex action. Role Expressiveness indicates the language’s notation and its expressiveness vis-a-vis the whole solution. Assessment: Our tool is aimed towards the definition of quality metrics for linked data. In a definition, all required information is adequately labelled to enable easy identification. Visibility measures the degree of visibility of the language’s notation. If concepts are encapsulated into concepts of a more abstract level, this reduces the visibility of the notation. Assessment: All available notation is directly visible to the user. Provisionality measures the ability of the language to allow users to explore potential options. Assessment: Similarly to the secondary notation dimension, potential options can be explored by temporarily commenting out parts of a definition. Together the assessment w.r.t. these dimensions provides a comprehensive heuristic guide of LQML, particularly focusing on language features that have not been implemented in an immediate response to the given quality assessment requirements. From this evaluation we can identify certain problems in the current implementation of the syntax, such as the possibility of reusing components of blueprints within others. These heuristics also stress the importance of the need of a better presentation view tool (graphical interface) for the user, while also highlighting that whilst we are widening the scope of metric definition for non-java experts, we are limiting ourselves to simple pattern matching metrics and thus more complex metrics cannot be defined. These measurements will help us in the second phase of the language definition. In this phase we are planning to enable the implementation of user-defined keywords in Java, so that ultimately Java expertise would only be required for providing extensions to LQML, whereas all actual metrics could be defined in LQML.
7.
RELATED WORK
In this section, we will introduce the reader to similar tools that assess quality of linked data. Table 7 summarises the tools discussed in this section. As can be seen in this table Luzzu fills with its focus on scalability, extensibility and quality metadata representation a gap in the space of related work. Flemming et al. [12] provides a simple web user interface and a walk through guide that helps a user to assess data quality of a resource using a set of defined metrics. Although the metrics provided can be customisable in terms of metric weight, no custom metrics can be added. The web application can also assign weights for each metric based on different semantic search use cases. In Luzzu, all metrics can be customisable since they might be implemented by a user. Even though we provide a set of metrics for linked data, some complex metrics can be easily configured by providing information such as a list of trustworthy providers. Once the quality assessment on a dataset is performed, the Luzzu framework can be used to rank a dataset based on the user’s weight distribution amongst the assessed categories, dimensions or metrics. Flemming’s tool outputs the result as unstructured text, indicating some quality problems as well, but these results cannot be exported to a structured format such as RDF. In addition the tool is also not suitable and scalable for large datasets [25]. LinkQA [13] is an assessment tool to measure the quality (and
Scalability Extensibility Quality Metadata Quality Report Collaboration Cleaning support Last release
Flemming No No No HTML No No 2010
LinkQA Yes Java No HTML No No 2011
Sieve Yes XML Yes (Optional) No No Yes 2014
RDF Unit Yes SPARQL Yes HTML, RDF No No 2014
Triple Check Mate Crowdsourcing No No No Yes No 2013
LiQuate N/A Bayesian rules No No No No 2014
Luzzu Yes Java, LQML rules Yes RDF No No 2014
Table 1: Functional comparison of Linked Data quality tools. changes in quality) of a dataset using network analysis measures. The authors provide five network measures, namely degree, clustering coefficient, centrality, sameAs chains, and descriptive richness through sameAs. Similar to Luzzu, LinkQA is extensible, meaning that new metrics can be integrated in the software, and scales for big datasets. Unlike LinkQA, Luzzu focuses not only on just topological measures (assessing link quality), but custom metrics can also be created to assess the quality of the data in a dataset. LinkQA is fully automated, whereby a user just selects a set of resources from the Web of Data (such as SPARQL endpoints or dereferenceable URIs) and a set of input triples, on which the assessment is performed. HTML reports are generated providing information such as values for each metric, possible changes to the quality of a dataset, and any outliers. Luzzu generates quality metadata where changes on particular metrics can be easily observed as each metric instance could possibly have multiple observation instances (if quality is assessed more than once). Luzzu also generates problem reports using an interoperable RDF-based format, and can thus be used within other frameworks such as cleaning tools. In Sieve [21], metadata about named graphs is used in order to assess data quality, where assessment metrics are declaratively defined by users through an XML configuration. In contrast to Sieve, users of Luzzu do not need to apply an XML template to declaratively define quality metrics due to the provided quality metric language. In these configurations, users can apply a scoring function (which can also be extended) on either one metric, or an aggregate of metrics. The authors do not provide a data quality vocabulary (they suggest a simple extension to the LDIF Provenance Graph, representing the value of the computed metric) but enable users to define their own data quality vocabulary. Sieve provides a data cleaning process, where data is cleaned based on a user configuration. The quality assessment tool is part of the LDIF Linked Data Integration Framework, which supports Hadoop. Similar to Flemming’s tool, the LiQuate [23] tool provides a guided walkthrough to view pre-computed datasets. LiQuate is a quality assessment tool based on Bayesian Networks, which analyse the quality of dataset in the LOD cloud whilst identifying potential quality problems and ambiguities. This probabilistic model is used in LiQuate to explore the assessed datasets for completeness, redundancies and inconsistencies. Data experts are required to identify rules for the Bayesian Network. Triple check mate [26] is mainly a crowdsourcing tool for quality assessment, supported with a semi-automatic verification of quality metrics. With the crowdsourcing approach, certain quality problems (such as semantic errors) might be detected easily by human evaluators rather than by computational algorithms. On the other hand, the semi-automated approach, provided by DL-Learner [19], makes use of reasoners and machine learning to learn characteristics of a knowledge base. RDFUnit [17] provides test-driven quality assessment for Linked Data. In RDFUnit, users define quality test patterns based on a SPARQL query template. Similar to Luzzu and Sieve, this gives the
user the opportunity to adapt the quality framework to their needs. The focus of RDFUnit is more to check for integrity constraints expressed as SPARQL patterns. Thus, users have to understand the different SPARQL patterns that represent these constraints. Quality assessment tests are computed by executing the custom SPARQL queries against dataset endpoints. In contrast, Luzzu does not rely on SPARQL querying to assess a dataset, and therefore can compute more complex processes (such as checking for dereferenceability of resources) on dataset triples themselves. The streaming approach of Luzzu also results in a better scalability. Test case results, both quality values and quality problems, from an RDFUnit execution are stored and represented as Linked Data and visualised as HTML. The main difference between Luzzu and RDFUnit in quality metadata representation is that the daQ ontology enables a more fine-grained and detailed quality metric representation. For example, representing quality metadata with daQ enables the representation of a metric value change over time.
8.
CONCLUSIONS
Data quality assessment is crucial for the wider deployment and use of Linked Data. With Luzzu we presented in this paper an approach for a scalable and easy-to-use Linked Data quality assessment framework. Our evaluation showed that Luzzu has very attractive performance characteristics. In particular, quality assessment with Luzzu scales linearly w.r.t. dataset size and adding additional (domain-specific) metrics adds a relatively small overhead. Thus, Luzzu effectively supports Big Data applications. Beyer and Laney coined the definition of Big Data as High Volume, High Velocity, and High Variety [2]. Volume means large amounts of data; velocity addresses how much information is handled in real time; variety addresses data diversity. The implemented Luzzu framework currently scales for both Volume and Variety. With regard to Volume, the processor runtime grows linearly with the amount of triples. We also cater for Variety since in Luzzu the results are not affected by data diversity. In particular, since we support the analysis of all kinds of data being represented as RDF any data schema and even various data models are supported as long as they can be mapped or encoded in RDF (e.g. relational data with R2RML mappings). Velocity completes the Big Data definition. Currently we employed Luzzu for quality assessment at well-defined checkpoints rather than in real time. However, due to its streaming nature, Luzzu can easily assess the performance of data streams as well thus catering for velocity. We see Luzzu as the first step on a long-term research agenda aiming at shedding light on the quality of data published on the Web. Regarding future work, we aim to extend Luzzu to employ inmemory computing techniques to support more complex metrics, which can not be handled by a streaming approach. Also, we plan to extend LQML accordingly and to devise tools for visualizing and authoring of metrics.
Acknowledgments This work is supported by the European Commission under the Seventh Framework Program FP7 grant 601043 (http:// diachron-fp7.eu).
References 1. Auer, S. et al. Managing the life-cycle of Linked Data with the LOD2 Stack. In: Proceedings of International Semantic Web Conference (ISWC 2012). 22% acceptance rate. 2012. http://iswc2012.semanticweb.org/sites/default/ files/76500001.pdf.
2. Beyer, M. A., Laney, D. The Importance of ‘Big Data’: A Definition. 21st June 2012. http : / / www . gartner . com / resId=2057415. 3. Blackwell, A. et al. Cognitive Dimensions of Notations: Design Tools for Cognitive Technology. English. In: Cognitive Technology: Instruments of Mind. Ed. by M. Beynon, C. Nehaniv, K. Dautenhahn. Vol. 2117. Lecture Notes in Computer Science. Springer Berlin Heidelberg, 2001, pp. 325–341. http://dx.doi.org/10.1007/3-540-44617-6_31. 4. Blackwell, A., Green, T. Notational Systems – the Cognitive Dimensions of Notations framework. 2002. 5. Carroll, J. J. et al. Named Graphs, Provenance and Trust. In: Proceedings of the 14th WWW conference. (Chiba, Japan, 10th–14th May 2005). Ed. by A. Ellis, T. Hagino. ACM Press, 2005, pp. 613–622. 6. Curry, E., Freitas, A., O’Riáin, S. The Role of CommunityDriven Data Curation for Enterprises. In: Linking Enterprise Data. Ed. by D. Wood. Boston, MA: Springer US, 2010. Chap. 2, pp. 25–47. http : / / www . edwardcurry . org / publications/curry_LED_Curation_2010.pdf. 7. Cyganiak, R., Jentzsch, A. About the Linking Open Data dataset cloud. 19th Sept. 2011. http://lod-cloud.net (visited on 2014-08-06). 8. Debattista, J., Lange, C., Auer, S. daQ, an Ontology for Dataset Quality Information. In: Linked Data on the Web (LDOW). (Seoul, 8th Apr. 2014). Ed. by C. Bizer et al. CEUR Workshop Proceedings 1184. Aachen, July 2014. http://CEURWS.org/Vol-1184.
14. Juran, J. M. Juran’s Quality Control Handbook. 4th. McGrawHill (Tx), 1974. http : / / www . amazon . com / exec / obidos/redirect?tag=citeulike07-20\&path=ASIN/ 0070331766.
15. Knight, S.-A., Burn, J. M. Developing a framework for assessing information quality on the World Wide Web. In: Informing Science: International Journal of an Emerging Transdiscipline 8(5) (2005), pp. 159–172. 16. Knuth, M., Hercher, J., Sack, H. Collaboratively Patching Linked Data. In: Proceedings of 2nd International Workshop on Usage Analysis and the Web of Data (USEWOD 2012), co-located with the 21st International World Wide Web Conference 2012 (WWW 2012). Lyon, France, 2012. http : / / arxiv.org/pdf/1204.2715v1. 17. Kontokostas, D. et al. Test-driven Evaluation of Linked Data Quality. In: Proceedings of the 23rd international conference on World Wide Web. to appear. 2014. http : / / svn . aksw . org/papers/2014/WWW_Databugger/public.pdf. 18. Le-Phuoc, D. et al. Rapid Prototyping of Semantic Mash-Ups through Semantic Web Pipes. In: Proceedings of the 17th WWW conference. (Madrid, Spain, 20th–24th Apr. 2009). Ed. by J. Quemada et al. ACM Press, 2009, pp. 581–590. 19. Lehmann, J. DL-Learner: Learning Concepts in Description Logics. In: Journal of Machine Learning Research (JMLR) 10 (2009), pp. 2639–2642. http://www.jmlr.org/papers/ volume10/lehmann09a/lehmann09a.pdf. 20. Lehmann, J. et al. DBpedia - A Large-scale, Multilingual Knowledge Base Extracted from Wikipedia. In: Semantic Web Journal (2014). 21. Mendes, P. N., Mühleisen, H., Bizer, C. Sieve: Linked Data Quality Assessment and Fusion. In: Proceedings of the 2012 Joint EDBT/ICDT Workshops. EDBT-ICDT ’12. Berlin, Germany: ACM, 2012, pp. 116–123. http : / / doi . acm . org / 10.1145/2320765.2320803. 22. Morsey, M. et al. DBpedia and the Live Extraction of Structured Data from Wikipedia. In: Program: electronic library and information systems 46 (2012), p. 27. http://svn.aksw. org/papers/2011/DBpedia_Live/public.pdf.
9. Debattista, J., Lange, C., Auer, S. Representing Dataset Quality Metadata using Multi-Dimensional Views. In: SEMANTiCS. (Leipzig, Germany, 4th–5th Sept. 2014). Ed. by A. Filipowska, H. Sack, J. Lehmann. 2014.
23. Ruckhaus, E., Baldizán, O., Vidal, M.-E. Analyzing Linked Data Quality with LiQuate. English. In: On the Move to Meaningful Internet Systems: OTM 2013 Workshops. Ed. by Y. Demey, H. Panetto. Vol. 8186. Lecture Notes in Computer Science. Springer Berlin Heidelberg, 2013, pp. 629–638. http: //dx.doi.org/10.1007/978-3-642-41033-8_80.
10. Debattista, J. et al. Processing Ubiquitous Personal Event Streams to Provide User-Controlled Support. In: WISE (2). 2013, pp. 375–384.
24. Wang, R. Y., Strong, D. M. Beyond accuracy: What data quality means to data consumers. In: Journal of management information systems (1996), pp. 5–33.
11. Dürst, M., Suignard, M. Internationalized Resource Identifiers (IRIs). RFC 3987. Internet Engineering Task Force (IETF), 2005. http://www.ietf.org/rfc/rfc3987.txt.
25. Zaveri, A. et al. Quality Assessment Methodologies for Linked Open Data. In: Semantic Web Journal (2014). This article is still under review. http://www.semantic-web-journal.
12. Flemming, A. Quality characteristics of linked data publishing datasources. MA thesis. Humboldt-Universität zu Berlin, Institut für Informatik, 2011.
net / content / quality - assessment - linked - data survey.
13. Guéret, C. et al. Assessing Linked Data Mappings Using Network Measures. In: Proceedings of the 9th Extended Semantic Web Conference. Vol. 7295. Lecture Notes in Computer Science. Springer, 2012, pp. 87–102. http://jens- lehmann. org/files/2012/linked_mapping_qa.pdf.
26. Zaveri, A. et al. User-driven Quality Evaluation of DBpedia. In: Proceedings of the 9th International Conference on Semantic Systems (I-SEMANTICS). (Graz, Austria, 4th–6th Sept. 2013). Ed. by M. Sabou et al. New York, NY, USA: ACM, 2013, pp. 97–104. http://svn.aksw.org/papers/2013/ ISemantics_DBpediaDQ/public.pdf.