J.Kim, and D. Feng are with the Biomedical and Multimedia Information ..... [16] B. Everitt, S. Landau, and M. Leese, âCluster Analysisâ, 4th edi., Arnold. Publishers, 2001. ... [19] A.P. Zijdenbos, B.M. Dawant, R.A. Margolin and A.C. Palmer,.
An Objective Evaluation Framework for Segmentation Techniques of Functional Positron Emission Tomography Studies Jinman Kim1,2, Student Member, IEEE, Weidong Cai1, Member, IEEE, David Feng1,2, Fellow, IEEE, Stefan Eberl1,3 Member, IEEE
Abstract-- Segmentation of multi-dimensional functional positron emission tomography (PET) studies into regions of interest (ROI) exhibiting similar temporal behavior is useful in diagnosis and evaluation of neurological images. Quantitative evaluation plays a crucial role in measuring the segmentation algorithm’s performance. Due to the lack of “ground truth” available for evaluating segmentation of clinical images, automated segmentation results are usually compared with manual delineation of structures which is, however, subjective, and is difficult to perform. Alternatively, segmentation of co-registered anatomical images such as magnetic resonance imaging (MRI) can be used as the ground truth to the PET segmentation. However, this is limited to PET studies which have corresponding MRI. In this study, we introduce a framework for the objective and quantitative evaluation of functional PET study segmentation without the need for manual delineation or registration to anatomical images of the patient. The segmentation results are anatomically standardized to a functional brain atlas, where the segmentation of the corresponding MRI reference atlas image is used as the ground truth. We illustrate our evaluation framework by comparing the performance of two pixel-classification techniques based on k-means and fuzzy c-means cluster analysis, applied to clinical dynamic human brain PET studies. The experimental results show that the proposed evaluation framework is able to provide objective measures for segmentation comparison and performance. I.
INTRODUCTION
S
egmentation of multi-dimensional functional positron emission tomography (PET) studies into regions of interest (ROI) exhibiting similar functional behavior is useful in a variety of neuro-imaging applications [1-5], such as for radio tracer modeling [1] and the extraction of blood timeactivity curves [2]. Considerable efforts have been applied to objectively and quantitatively evaluate the segmentation This work was supported by ARC and RGC Grants. J.Kim, and D. Feng are with the Biomedical and Multimedia Information Technology (BMIT) Group, School of Information Technologies, The University of Sydney, Australia, and with the Department of Electronic and Information Engineering, Hong Kong Polytechnic University, Hong Kong. W. Cai is with the Biomedical and Multimedia Information Technology (BMIT) Group, School of Information Technologies, The University of Sydney, Sydney, Australia. S. Eberl is with the Biomedical and Multimedia Information Technology (BMIT) Group, School of Information Technologies, The University of Sydney, and with the Department of PET and Nuclear Medicine, Royal Prince Alfred Hospital, Sydney Australia.
performance of medical images [7-9], and various methods specifically for PET segmentation have been presented. Evaluation of PET segmentation can generally be classified into simulations and clinical studies. In simulation studies, the “ground truth” is available which represents the true segmentation and thus allows quantitative measures of the segmentation performance to be readily obtained. This approach has been used to evaluate dynamic PET segmentation methods using simulation studies to measure the correct classification of the tissue structures [3-6]. Although simulation studies provide insight into the quality of the segmentation, the simulations, when used alone do not entirely reflect the results to be expected from the clinical studies [8-9]. For clinical PET segmentation, due to the lack of ground truth, the segmentation results are typically compared to manual delineation of structures by physicians. Manual delineation can be useful, for instance, in the comparison of parametric estimations from the segmented regions to the manually delineated regions [5-6] for segmentation evaluation. However, manual delineation is subjective, may not be reproducible, and time consuming to perform. Furthermore, manual delineation of clinical PET studies is seldom used in the evaluation of measures based on overlapping volumes of segmented regions. There can be as much as a 15% variation in the manual delineation by physicians for magnetic resonance imaging (MRI) studies [10]. In PET, with inherently low signal-to-noise ratio from limited counting statistics and poor spatial resolution, the accurate and consistent delineation of ROIs is likely to be an even more difficult task. An alternate approach to manual delineation is the registration of PET with an anatomical modality such as MRI or computed tomography (CT) [11-12], thus allowing the anatomical segmentation to be used as the ground truth. Accurate and correct ROI information can potentially be obtained from anatomical segmentation. Nonetheless, this approach limits the evaluation to only those PET studies which have corresponding anatomical images. In this study, we introduce a framework for the objective and quantitative evaluation of segmentation of clinical functional PET studies without the need for manual delineation of structures or registration with an anatomical modality. The clinical segmentation results are anatomically standardized into a functional brain reference atlas using the three-
0-7803-8701-5/04/$20.00 (C) 2004 IEEE
dimensional (3D) stereotactic surface projection (3D-SSP) from the NEUROSTAT [13-15] neuro-imaging package. This package has a unique corresponding MRI reference atlas (same anatomical structures) which can be used as the ground truth. The segmentation results are evaluated using two overlapping volumes measures. We demonstrate our evaluation framework by comparing the segmentation performances of two conventional pixel-classification techniques based on k-means cluster analysis (KCA) [16], and fuzzy c-means (FCM) cluster analysis [17]. As both of these clustering techniques use iterative refinement schemes to segment the image into a predefined number of clusters based on functional similarity, they are able to provide meaningful comparison to demonstrate the performance of our proposed evaluation framework. Such comparison of segmentation results is often required in the selection of an optimal segmentation technique for specific applications. The segmentation evaluation is applied to the clinical dynamic brain [18F]2-fluoro-deoxy-glucose (FDG) PET studies.
A. Segmentation of Dynamic PET Data The dynamic PET data are segmented using FCM and KCA techniques in 3D spatial plus 1D temporal domains with the temporal kinetics as the functional homogeneity criterion. The two techniques share identical segmentation parameters of background threshold, homogeneity criterion of accepting a voxel to the cluster, convergence criterion for termination, and the cluster numbers and centroids. The cluster centroids in each cluster are randomly initialized to be exclusive of each other and to include only non-background voxels. 1) Functional k-means cluster analysis (KCA) In dynamic PET studies, for each voxel, the counts of the glucose uptake from the temporal frame sequence are extracted as a kinetic feature vector f of time interval t (t = 1, 2,…, T) for all feature vector N. The KCA segmentation [16] evolves by minimizing the objective function J with respect to the cluster centers f C N
C
i =1 j =1
(
)
(1)
where the Euclidean distance D is applied as the similarity measure between a feature vector f i and a jth cluster centroid
c j as the homogeneity criterion 1/ 2
T D (f i , f C j ) = ∑ s (f i (t ) −f C j (t )) 2 t =1
(2)
The temporal frame sequence is scaled according to the temporal controller s derived from the sampling schedule, where more weight is applied to the later frames which consist of more reliable and consistent data. The centroids of C clusters are updated to the cluster-wide average feature vector fC at the end of each iteration until the cluster centroids no longer vary.
[ ]
measured sample in the cluster j. A common model of FCM [17] minimizes the objective function N
(
C
)
J P = ∑∑ uijP D 2 f i , f C j , 1 ≤ P ≤ ∞ i =1 j =1
(3) Here, P is a weighting exponent on each fuzzy membership which determines the amount of fuzziness of the resulting classification. The measured samples are the feature vector f i using Eq. (2) with the centroid f C where c j is the jth j
cluster. The optimization of the FCM partitioning is the iterative updating of the membership u ij and the cluster centroid c j according to
II. MATERIAL AND METHOD
J = ∑∑ D 2 f i , f C j
2) Functional fuzzy c-means (FCM) cluster analysis Initially, the K-Nearest Neighbor (KNN) classifier is applied to partition the feature vectors into pre-defined number of cluster groups based on temporal kinetic similarity. The KNN result is then used to initialize the fuzzy partition matrix U = u ij where u ij is the membership degree of the ith
N
1
uij = C
(
)
D fi , fC j 2
∑ D (f , f ) k =1
2
i
Ck
2 p −1
cj =
∑u i =1 N
p ij i
∑u
f
p ij
i =1 (4) (5) The sum of all the membership degrees from a sample equals one, with the best membership to a particular cluster represented by the highest degree. The iteration will terminate when the change in centroid is minimized. Upon termination, the feature vectors are assigned to the cluster group with the highest membership degree.
B. Clinical Studies The dynamic PET data were acquired on a Siemens ECAT 951R PET scanner. The number of image slices for the dynamic PET data is 31, with each slice consisting of 22 temporal frames in CSS scanning schedule of 6 × 10 seconds, 4 × 0.5 minutes, 1 × 2.0 minutes, and 11 × 5.0 minutes scans. The dynamic images were decay-corrected to the time of injection, attenuation corrected, and then reconstructed using filtered back-projection with a Shepp and Logan filter with cutoff at 0.5 of the Nyquist frequency. The reconstructed images were stored in 128 × 128 matrices with voxel dimensions of 1.841 × 1.841 × 3.375mm. The clinical PET segmentation results were anatomically transformed into the standard atlas and tissue classified into white matter (WM) and grey matter (GM), and then evaluated against the ground truth constructed from the MRI atlas. 1) Anatomical transformation The anatomical standardization procedure of 3D stereotactic surface projection (3D-SSP) transformation from the NEUROSTAT package [13-15] uses linear scaling and nonlinear warping of the static functional brain PET data into a standard brain atlas. In this study, to generate the static images required in the NEUROSTAT transformation, only the last temporal frame from each dynamic PET data set were utilized. The transformation program creates library files of the
0-7803-8701-5/04/$20.00 (C) 2004 IEEE
standardization procedure parameters which were then also applied to the corresponding segmentation results to transform the segmented images into the same standardized image frame of reference. Voxels in the transformed segmentation images with contributions from more than one tissue structure are assigned to the most related structure. In addition, slices with incomplete information were removed, since the brain atlas covers a larger region than our clinical studies acquired in a single bed position. 2) Tissue classification Regions from the anatomically standardized segmentation results were then classified into two tissue structures of WM and GM for the purpose of segmentation evaluation. Classification of the regions was based on the similarity of the region-wide physiological feature vectors, in relation to the standard feature vectors which were derived from the knowledge of the human brain anatomy and the physiological functions of the tissue structures. 3) Construction of ground truth The ground truth data were constructed by segmenting the MRI reference image from NEUROSTAT which has the same anatomical frame of reference as the transformed segmentation results. In addition, this reference image has high spatial resolution, background-removed, and has excellent discrimination of tissue structures. As with the clinical PET data, the FCM and KCA segmentation methods were applied to partition the MRI into WM and GM structures. The seeded region growing (SRG) segmentation technique based on [18] was also applied to the MRI data to construct an alternate and unbiased ground truth to the segmentation techniques being evaluated. The MRI segmentation results were stripped of sharp edges and voxels which are mixed at the boundary were re-classified to the tissue matter which has contribution greater than 50%. For boundaries separating tissue from no count regions such as ventricles, the boundary was defined at the 40% level.
the estimated volume AEst . A result of 0.0 represents no
C. Evaluation Measures The evaluation of the segmentation results was measured based on the combination of two overlapping volumes evaluation measures consisting of similarity index [19] and the absolute index [20]. The measures were applied directly to the 3D segmentation volumes which were reformatted from the 3D segmentation results. The use of two separate evaluation measures together can provide a more meaningful evaluation of the segmentation performance. 1) Similarity index The similarity index S is derived from a reliability measure known as the kappa statistics is both dependent on the size and location of the volumes, and is defined as
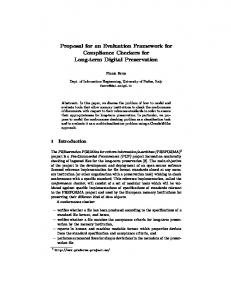
Fig. 4. The KCA (2) and FCM (3) segmentation results using 8 clusters on dynamic PET data from patient study s01 (1). (a) to (d) are respectively image slices 6, 12, 18, and 22. Different shades of grey are used to represent the different functional cluster of voxels.
S =2
n{A1 ∩ A2 } n{A1} + n{A2 }
(6) A perfect index of 1.0 is achieved when both overlapping volumes A1 and A2 are identical in size and location. 2) Absolute index The absolute index (AI) was used to measure the differences
difference between the two volumes given by A − ATrue AI = Est ATrue
(7)
III. RESULTS In the cluster analysis of the PET studies, the number of clusters used for all patient studies was 8, derived from empirical experiments. The segmentation results of patient study s01 are shown in Fig. 4 which appears to have correctly identified the different tissue structures with both segmentation techniques. In this case, the differences between the segmentation results are small, with FCM results suggesting the formation of stronger grouping and connection of pixels.
The transformed segmentation results of patient study s02 with WM and GM selection are shown in Fig. 5, displaying the anatomical transformation of the PET data into the brain atlas, and the classification of the tissue structures. Comparing the two segmentation results visually, the results in relation to the brain atlas are satisfactory. The differences among the segmentation results are small, where the FCM again appears to have a small advantage in the classification of the tissue structures over KCA. The ground truth images from MRI reference image segmentation are presented in Fig. 6, which show significant differences to clinical segmentation, and therefore result in low evaluation measure indices when used in the clinical segmentation evaluation. Nevertheless, the indices are meaningful in the comparison of different segmentation techniques. The visual findings are confirmed by the quantitative evaluation measures presented in Fig. 7 for patient studies s01 and s02.
0-7803-8701-5/04/$20.00 (C) 2004 IEEE
In the quantitative results, all of the evaluation measure performances comparing the KCA and FCM show similar trends for the two patient studies, demonstrating FCM to be better in separating the tissue structures. Thus, in the segmentation comparison using the proposed evaluation framework, the FCM technique is better in separating the different tissue structures. In addition, these results demonstrate that small differences in segmentation are able to be detected and quantified by the proposed evaluation framework.
IV. DISCUSSION AND CONCLUSION
Fig. 5. The 1st row shows the original slices 6, 12, 18 and 22 (a-d respectively) out of 31 slices for patient study s02. The 2nd row is the transformed result of (1) using NEUROSTAT with matching axial slices to (1) 17, 25, 35 and 4 out of 60 slices. (3) shows the matching NEUROSTAT functional brain reference slices. The anatomically standardized tissue structures separated into WM (dark shade) and GM (light shade) by the KCA and FCM segmentation methods are presented in (4) and (5), respectively. All images have been adjusted to their local maximum intensities for display.
In total, the quantitative results of WM (R1) and GM (R2) segmentation of the dynamic PET data shown in Fig. 7 are evaluated against three different ground truths generated by segmenting the standard MRI atlas with SRG (1st set of four columns), KCA (2nd set of columns), or FCM (3rd set of columns).
Fig. 6. The MRI reference image from NEUROSTAT (slice 35/60) is shown in (a) and the constructed ground truth from segmentation results of SRG, KCA, and FCM are shown in (b) to (d), respectively.
The experiments in this study have focused on dynamic PET studies of the human brain, although the framework is potentially applicable to other anatomical structures and biomedical functional studies including static PET and single positron emission computed tomography (SPECT) studies. There are several limitations to the proposed evaluation framework which need to be addressed. In the current evaluation framework, the NEUROSTAT package is applied to transform the segmentation results into the standard brain atlas, which limits its usability to brain studies. For different anatomical structures, other transformation methods are required. Another limitation is that the proposed framework only considers the ground truth from automated segmentation of the MRI reference. Although the MRI reference image is of high quality and thus provides good estimates of the tissue separation, the use of generated ground truth constructed using automated segmentation techniques does not entirely reproduce the results expected from a “true” segmentation ground truth. Future work for the proposed evaluation framework will investigate the use of alternate transformation or registration library to the standard atlas, and the feasibility of incorporating alternate ground truth constructions which can provide improved ground truth for evaluation. In this study, we have proposed an objective evaluation framework which quantitatively measures the segmentation quality of functional PET studies without the use of manual delineation or registration to a corresponding anatomical modality. Using the clinical studies, the proposed segmentation evaluation framework provides objective quantitative results of the segmentation quality. The application of the proposed evaluation measures in comparing the two cluster analysis segmentation techniques demonstrates that the framework is sensitive in detecting segmentation errors and capable of objectively comparing the different segmentation techniques. We believe that the ability to objectively evaluate and compare segmentation techniques is useful to aid in the selection of optimal technique for various applications. While the results of this limited evaluation of the proposed method are encouraging, further studies involving a larger variety of functional studies and application to other medical modalities are required and will be investigated.
0-7803-8701-5/04/$20.00 (C) 2004 IEEE
S im ila rit y inde x s 0 1
0.8
0.63
A bs o lut e inde x s 0 1
0.7 0.6
0.58
0.5 0.4
0.53
0.3
0.48
0.2 0.1
0.43
0 -0.1
0.38 G T 1 ( SR G )
GT 2 (KCA)
KCA (s01: R1) FCM (s01: R1)
GT 3 ( FC M )
G T 1 ( SR G )
GT 2 (KCA)
GT 3 ( FC M )
-0.2
KCA (s01: R1) FCM (s01: R1)
KCA (s01: R2) FCM (s01: R2)
KCA (s01: R2) FCM (s01: R2)
(c)
(a) S im ila rit y inde x s 0 2
0.9
A bs o lut e inde x s 0 2
0.63
0.7 0.58
0.5 0.53
0.3 0.48
0.1 0.43
-0.1
GT1 (SRG)
GT2 (KCA)
GT3 (FCM)
0.38 G T 1 ( SR G )
GT 2 (KCA )
KCA (s02:R1) FCM (s02:R1)
GT 3 ( FC M )
-0.3
KCA (s02:R1) FCM (s02:R1)
KCA (s02:R2) FCM (s02:R2)
KCA (s02:R2) FCM (s02:R2)
(d)
(b)
Fig. 7. The comparative segmentation performance measure of FCM and KCA techniques. Two clinical dynamic PET data from patient study s01 and s02 are segmented and evaluated. (a) and (b) is the similarity index, and (c) and (d) is the absolute index measures, respectively. [13]
V. REFERENCES [1] [2]
[3] [4] [5] [6] [7] [8]
[9] [10] [11] [12]
F. O’Sullivan, “Imaging radiotracer model parameters in PET: A mixture analysis approach”, IEEE Trans. Med. Imag., vol. 12, pp. 399412, 1993. H.M. Wu, C.K. Hoh, Y. Choi, H.R. Schelbert, R.A. Hawkins, M.E. Phelps, and S.C. Huang, “Factor analysis for extraction of blood timeactivity curves in dynamic FDG-PET studies”, J. Nucl. Med., vol. 36, pp. 1714-1722, 1995. J.L. Chen, S.R. Gunn, M.S. Nixon, and R.N. Gunn, “Markov random field models for segmentation of PET images”, Information Processing in Med. Imag., pp. 468-474, 2001. J.G. Brankov, N.P. Galastsanos, Y. Yongyi, and M.N. Wernick, “Segmentation of dynamic PET or fMRI images based on a similarity metric”, IEEE Trans. Nucl. Sci., vol. 50, no. 5, pp. 1410-1414, 2003. H. Guo, R. Eanaut, K. Chen, and E. Rieman, “Clustering huge data sets for parametric PET imaging”, Biosystems, vol. 71, pp. 81-92, 2003. K. P. Wong, D. Feng, S.R. Meikle, and M.J. Fulham, “Segmentation of dynamic PET images using cluster analysis”, IEEE Trans. Nucl. Sci., vol. 49, pp. 200-207, 2002. J. Yang, and S-C. Huang, “Method for evaluation of different MRI segmentation approaches”, IEEE Trans. Nucl. Sci. vol. 46, no. 6, pp. 2259-2265, 1999. S.K. Warfield, K.H. Zou, and W.M. Wells, “Simultaneous truth and performance level estimation (STAPLE): An algorithm for the validation of image segmentation”, IEEE Trans. Med. Imag., vol. 23, no. 7, pp. 903-921, 2004. V. Chalana, and Y. Kim, “A methodology for evaluation of boundary detection algorithms on medical images”, IEEE Trans. Med. Imag. vol. 16, no. 5, pp. 642-652, 1997. W. Wells, R. Kikinis, E. Grimson, and F. Jolesz, “Statistical intensity correction and segmentation of magnetic resonance image data”, SPIE Prc. Visualization in Biomed. Comput., pp. 13-24, 1994. J.B. Antoine Maintz, and M. A. Viergever, “A survey of medical image registration”, Med. Imag. Analysis, vol. 2, no. 1, pp. 1-36, 1998. K-P. Lin, S-C. Huang, L.R. Baxter, and M.E. Phelps, “A general technique for interstudy registration of multifunction and multimodality images”, IEEE Trans. Nucl. Sci., vol. 41, pp. 2850 – 2855, 1994.
[14]
[15] [16] [17] [18] [19]
[20]
S. Minoshima, K.L. Berger, K.S. Lee, and M.A. Mintun, “An automated method for rotational correction and centering of threedimensional functional brain images, J. Nucl. Med., vol. 33, pp. 15791585, 1992. S. Minoshima, R.A. Koeppe, and M.A. Mintun, K.L. Berger, S.F. Taylor, K.A. Frey, D.E. Kuhl, “Automated detection of the intercommissural line for stereotactic localization of functional brain images”, J. Jucl. Med., Vol. 34, pp. 322-329, 1993. S. Minoshima, R.A. Koeppe, K.A. Frey, and D.E. Kuhl, “Anatomic standardization: linear scaling and nonlinear warping of functional brain images”, J. Nucl. Med., vol. 35, no. 9, pp. 1528-1537, 1994. B. Everitt, S. Landau, and M. Leese, “Cluster Analysis”, 4th edi., Arnold Publishers, 2001. J. Bezdek, “Pattern recognition with fuzzy objective function algorithm”, New York: Plenum, 1981. A. Mehnert and P. Kackway, “An improved seeded region growing algorithm”. Pattern Recognit. Letters, vol. 18, pp. 1065-1071, 1998. A.P. Zijdenbos, B.M. Dawant, R.A. Margolin and A.C. Palmer, “Morphometric analysis of white matter lesions in MR images: Methods and Validation”, IEEE Trans. Med. Imag., vol. 13, pp. 716724, 1994. I. Bankman, “Handbook of Medical Imaging: Processing and Analysis Management”, Academic Press, 2000.
0-7803-8701-5/04/$20.00 (C) 2004 IEEE