Machine Learning Approach for Estimating Sensor Deployment Regions on Satellite Images 1
Enes ATEŞ, 2*Tahir Emre KALAYCI, 1Aybars UĞUR Faculty of Engineering, Department of Computer Engineering Ege University, Turkey 2 Faculty of Engineering, Department of Computer Engineering Celal Bayar University, Turkey 1
Abstract Wireless sensor networks (WSN) are currently used in many applications and as an emerging area and many researchers have been studied on various WSN problems. If forests will be monitored by a sensor network, mountains, sea or residential areas on a satellite image are irrelevant and no sensors are dedicated to these regions. In this study, a fast technique is proposed to estimate the suitable regions for sensor network deployment. Also, complementary interactive image processing software is developed. First, whole environment image is divided into equally sized rectangular regions. After that, an expert assigns values by selecting to some characteristic regions interactively: true to regions that must be sensed or false to ones that are unsuitable. After a neural network as a machine learning approach is trained by features that are obtained from color values of these regions, all other regions are classified by the system automatically. After eliminating the regions that are out of focus, sensor count needed to deploy the whole usable area on satellite image is calculated. Technique is tested on a set of satellite images with satisfactory results and performance values are presented and discussed. Key words: Wireless sensor networks, machine learning, artificial neural networks, satellite images
1. Introduction Wireless sensor network (WSN) is an emerging research area and it is currently used in many applications. Therefore, many researchers have been studied on various WSN problems. WSN consists of small sensors with limited processing and computing resources, and they are inexpensive compared to traditional sensors [1]. These nodes can sense, measure, and gather information from the environment and they can transmit the sensed data to the user based on some local decision process [1]. Wireless sensor networks facilitate monitoring and controlling of physical environments from remote locations with better accuracy [2]. WSNs have great potential for many applications, such as environmental monitoring, military target tracking and surveillance, natural disaster relief, biomedical health monitoring, etc. [3]. By the help of the WSNs, different parts of an area can be monitored easily. This is especially * Corresponding author: Address: Faculty of Engineering, Department of Computer Engineering Celal Bayar University, 45100, Manisa TURKEY. E-mail address:
[email protected], Phone: +902362012105 Fax: +902362412143
E. Ates et al. / ISITES2014 Karabuk - TURKEY
310
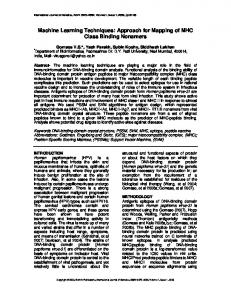
important for specific monitoring tasks at hand. For example, WSNs can be deployed and used for the monitoring of the forests. However, one important problem in such a monitoring occurs when no specific deployment is performed over the area. Even, specific deployment can be very hard for some special areas. Wireless sensor networks requires to deal with many functional and non-functional design goals, hence careful deployment can be a very effective tool for dealing such desired design goals [4]. In addition, performing a preliminary analysis of the area before the deployment using the computers and developing a strategy based on this analysis can be very important to overcome such problems. In the literature, apart from simulation tools, there are tools for large scale deployment in industrial plant [5], tools capable of generating realistic topologies of wireless sensor networks [6], and tools for managing, monitoring, and visualizing deployments [7]. Artificial Neural Networks (ANN) are an important machine learning algorithm that inspired by the brain and have many applications in the real life for prediction, classification, approximation, data processing, and control. ANN is a massively parallel distributed processor made up of simple processing units called neurons [8]. These neurons have a natural propensity for storing experiential knowledge and making it available for use [8]. As ANNs are data driven selfadaptive methods in that they can adjust themselves to the data without any explicit specification of functional or distributional form for the underlying model and as they can approximate any function with arbitrary accuracy, they are a strong classification method and they have emerged as an important tool for the classification [9]. Due to the reasons explained above, in this study, a fast technique that is based on ANN is proposed to estimate the suitable regions for sensor network deployment for special areas include forest, residential, and sea to simplify the deployment process and overcome aforementioned problems. For the estimation of the suitable regions, complementary interactive image processing software is developed. In this software, first of all, satellite image of the whole environment is divided into equally sized rectangular regions. After that, an expert assigns values by selecting to some characteristic regions interactively: true to regions that must be sensed or false to ones that are unsuitable. Then, a neural network as a machine learning approach is trained by features that are obtained from color values of these regions. All other regions are classified by the system automatically using this trained neural network. After eliminating the regions that are out of focus, sensor count needed to deploy the whole usable area on satellite image is calculated. 2. Methodology In the proposed approach, expert loads the satellite image of the area to the developed complementary software as a first step. That image can be searched using Google Maps Static API or can be loaded by hand from previously saved file. This loaded image is split into grid of square cells with edge length of r*√2 where r is sensor coverage radius (Fig. 1). Thus, expert will have a satellite image with grid cells. After loading and split of the image to the grid cells, expert must select the positive and negative cells that are going to be used for training of the ANN. Therefore, expert can enter 1 for the
E. Ates et al. / ISITES2014 Karabuk - TURKEY
311
positive cells (i.e. cells to be sensed) and 0 for the negative cells (i.e. cells not to be sensed) as training data using the GUI. A color (Red, Green, and Blue) value of all pixels of a cell is used for feature extraction (see Eq. 1 for the input set, Ravg, Gavg, Bavg as Average of Red, Green and Blue respectively, Rstd, Gstd, Bstd as Standard Deviations of Red, Green and Blue respectively, n: number of positive and negative cells selected by expert). Training data is composed of features extracted from all cells that values are set. (1)
Also if required, expert can set all the expected values (for the comparison of the ANN classification results) of the remaining cells after entering positive and negative training cells. For this, expert will enter 1 to the cells expected to be positive, and 0 to the cells expected to be negative. Thus, before the training of the ANN, expert will see training cells and expected values of the remaining cells in the GUI of the software. After setting the training data and optionally expected data, a multilayer feed forward artificial neural network (having 6 input neurons, 40 hidden layer neurons and 1 output neuron) with backpropagation is trained by the training input values (x(i)) of the expert. For the output layer Linear Transfer Function (purelin) with threshold function in Eq. 2 is used for the estimation. (2) Then, cells that are not selected for the training are estimated (positive and negative) by giving color features of these remaining cells as inputs to the trained ANN. Afterwards, estimation results of the cells are compared Figure 1. Flowchart of the proposed technique
E. Ates et al. / ISITES2014 Karabuk - TURKEY
312
with expected results (set by expert) and accuracy of the ANN is calculated. Finally, sensors with radius r are deployed to the center of the cells as estimated positive and number of sensors required to monitor the area is calculated. 3. Experimental Results To measure the success of the proposed technique, it is tested on a set of satellite images. Results and performance values are presented and discussed in this section. Complementary software has been developed using Python programming language 2.7.x with the help of PyGTK, Cairo, PIL, PyBrain and scikit-learn libraries. Experiments are performed using developed software on a AMD Phenom™ II X4 965 8MB 3.4GHz Processor x 4, 7.8 GiB memory computer with Linux Mint 16 64-bit operating system. Proposed technique has been experimented on three different satellite maps, İzmir (coordinates: 38.418897, 27.128677), İstanbul (coordinates: 41.005294, 28.977127), and Karabük (coordinates: 41.211722, 32.602959) for three different training data sizes (2 data: one positive, one negative; 6 data: three positive, three negative; 8 data: four positive, four negative; 10 data: five positive, five negative; 16 data: eight positive, eight negative). For the experiments images are split into 16x12 cells with edge of 40 pixels. After setting the positive and negative training data, expert can set the expected (i.e. ground truth, target) values using the software, hence confusion matrix [10] for the experiments can be easily generated using these training data and targets. Experiments are repeated for 50 times and average of the results is presented in Tables 13. In the experiments for the İzmir satellite image, it is assumed that expert wants to monitor the sea as the first scenario. Therefore, expert selects corresponding positive training data from the blue intensive areas of the image and negative training data from the brown intensive areas (Fig.2). Expert wants to monitor the territorial areas for the İstanbul satellite image as the second scenario. So, expert selects corresponding positive training data from the brown intensive areas of the image and negative training data from the other areas (Fig.3). And finally, expert wants to monitor the forested areas for the Karabük satellite image. Therefore, expert selects corresponding positive training data from the green areas of the image and negative training data from the other areas (Fig.3).
E. Ates et al. / ISITES2014 Karabuk - TURKEY
Figure 2. Experiment results for İzmir satellite image of 2, 6 and 10 training data
313
E. Ates et al. / ISITES2014 Karabuk - TURKEY
Figure 3. Experiment results for İstanbul satellite image of 2, 6 and 10 training data
314
E. Ates et al. / ISITES2014 Karabuk - TURKEY
Figure 4. Experiment results for Karabük satellite image of 2, 6 and 10 training data
315
E. Ates et al. / ISITES2014 Karabuk - TURKEY
316
Table 1. Confusion matrices of the test data for the İzmir satellite image
Table 2. Confusion matrices of the test data for the İstanbul satellite image
Table 3. Confusion matrices of the test data for the Karabük satellite image
Confusion matrices for different training data sizes (2 data, 6 data, 8 data, 10 data, and 16 data) are given in Tables 1, 2, and 3 for the respective satellite images. Accuracy results of the images are also presented on the right side of the confusion matrices. To calculate the accuracy results, the following equations have been used (where TP: True Positive Count, FP: False Positive Count, TN: True Negative Count, FN: False Negative Count):
E. Ates et al. / ISITES2014 Karabuk - TURKEY
317
(3)
When confusion matrices and accuracy estimation of the satellite images are analyzed, it can be easily seen that appropriate number of training data are required for the proper classification of the cells. If an improper number of training data are used it may cause wrong classification, hence ineffective results. For all the experiments, based on the complexity of the image, best results have been obtained by using different number of training data (8 for İzmir, 16 for İstanbul and Karabük). Conclusions In this paper, a fast technique to estimate the suitable regions for sensor deployment has been proposed. This technique uses the Artificial Neural Networks to classify equally sized rectangular regions of the satellite image into true (regions that require sensing) and false (regions don't require sensing) classes based on the inputs of the expert. Expert performs the training and application of the technique using complementary software which displays the satellite image with auxiliary visualization. After that, visualization of sensor deployment on the satellite image found by the technique is generated. Technique is tested on a set of satellite images (İzmir, İstanbul, and Karabük) with satisfactory results. It is clearly understood from the experiments that for an accurate classification of the regions that are suitable for deployment, an appropriate number of training data must be entered by the expert. Also expert must determine the positive and negative cells with great care. Likewise marking critical (especially transitive) cells affects the classification performance. Entering a large number of training data having regional diversity in the sense of colors and patterns will improve the efficiency of the technique. Determining the number of training data and selecting distinctive cells are very important for the success of the technique. For a future work, it is planned to investigate the estimation of required training data number by performing a color and pattern analysis of the image and application of different classification techniques.
E. Ates et al. / ISITES2014 Karabuk - TURKEY
318
Acknowledgements This work is performed under the TÜBİTAK Project No: 113E947. We would like to thank TÜBİTAK for its financial support of the project. References [1] Jennifer Yick, Biswanath Mukherjee, Dipak Ghosal, Wireless sensor network survey, Computer Networks, 2008, 52(12):2292-2330, DOI: 10.1016/j.comnet.2008.04.002 [2] Kasim Sinan Yildirim, Tahir Emre Kalayci, and Aybars Ugur, Optimizing coverage in a Kcovered and connected sensor network using genetic algorithms, In Proc. of the 9th WSEAS Int. Conf. on Evolutionary Computing (EC'08), 2008. [3] Tahir Emre Kalayci, Aybars Ugur, Genetic Algorithm-Based Sensor Deployment with Area Priority, Cybernetics and Systems, 2011, 42(8): 605-620, DOI: 10.1080/01969722.2011.634676 [4] Mohamed Younis, Kemal Akkaya, Strategies and techniques for node placement in wireless sensor networks: A survey, Ad Hoc Networks, 2008, 6(4):621-655, DOI: 10.1016/j.adhoc.2007.05.003. [5] Apala Ray, Planning and Analysis Tool for Large Scale Deployment of Wireless Sensor Network, Int. J. of Next-Generation Networks (IJNGN), 1(1):29-36. URL: http://airccse.org/journal/ijngn/papers/4.pdf [6] Tiago Camilo, Jorge Sá Silva, André Rodrigues, Fernando Boavida, GENSEN: A Topology Generator for Real Wireless Sensor Networks Deployment, Software Technologies for Embedded and Ubiquitous Systems, LNCS, 2007, 4761:436-445, DOI: 10.1007/978-3-540-75664-4_46 [7] Martin Turon, MOTE-VIEW: A Sensor Network Monitoring and Management Tool, The 2nd IEEE Workshop on Embedded Networked Sensors (EmNetS-II), 2005, pp.11-18. [8] Simon Haykin, Neural Networks and Learning Machines, 3rd Ed., Prentice Hall, 2009. [9] G. P. Zhang, Neural networks for classification: a survey, IEEE T SYST MAN CY C , 2000, 30(4):451-462, DOI: 10.1109/5326.897072 [10] Ron Kohavi and Foster Provost, Glossary of Terms, Machine Learning, 1998, 30(2/3):271274, URL: http://ai.stanford.edu/~ronnyk/glossary.html