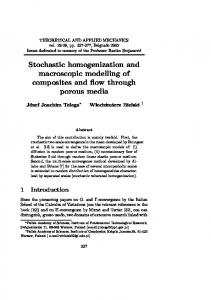
Macroscopic Modelling of Overflow Metabolism in Fed-batch Cultures of Hybridoma Cells Z. Amribt, H. Niu and Ph. Bogaerts 3BIO-BioControl, Brussels School of Engineering, Université Libre de Bruxelles, Av. F.-D. Roosevelt 50 C.P. 165/61, 1050 Brussels, Belgium Tel: +32-2-650.40.76; Fax : +32-2-650.35.75; e-mail:
[email protected] Abstract: A macroscopic model that takes into account phenomena of overflow metabolism within glycolysis and glutaminolysis is proposed to simulate hybridoma HB-58 cell cultures. The model of central carbon metabolism is reduced to a set of macroscopic reactions. The macroscopic model describes three metabolism states: respiratory metabolism, overflow metabolism and critical metabolism. It is validated with experimental data of fed-batch hybridoma cultures and successfully predicts the dynamics of cell growth and death, substrate consumption (glutamine and glucose) and metabolites production (lactate and ammonia). Model parameters and confidence intervals are obtained via a non linear least squares identification. This model, on the one hand, allows quantitatively describing overflow metabolism in mammalian cell cultures and, one the other hand, will be valuable for monitoring and control of fed-batch cultures in order to optimize the process. Keywords: hybridoma cells, mammalian cell cultures, overflow metabolism, macroscopic modelling, substrate consumption, metabolites production.
1. INTRODUCTION Mammalian cell cultures are now well established as an industrial production platform for recombinant proteins, and with the recent PAT (Process Analytical Technology) initiative from the FDA, it now seems valuable to obtain a thorough metabolic characterization of cell lines and of the relationships between the cell environment and cellular behavior. Such work can lead to the development of macroscopic models, which can be valuable tools to reduce bioprocess development time and cost (Jang and Barford, 2000). The issue of bioprocess modelling from extracellular measurements has been considered for a long time in the literature (Tremblay et al., 1992; Dhir et al., 2000; Zhou et al., 2006; Xing et al., 2010). In classical macroscopic models the cells are just viewed as a catalyst for the conversion of substrates into products which is represented by a set of chemical ‘‘macro-reactions’’ that directly connect extracellular substrates and products without paying much attention to the intracellular behavior. Dynamical mass balance models are then established on the basis of these macro-reactions by identifying appropriate kinetic models from the experimental data. Such macroscopic models rely on the category of so-called ‘‘unstructured models’’ in the standard terminology reported in the important discussion paper of Bailey (Bailey, 1998). The goal of macroscopic modelling is clearly to derive simple models that have been proved of paramount importance in bioengineering for the design of on-line algorithms for process monitoring, control and optimization. This study aims at constructing a simple and identifiable macroscopic model of hybridoma cells that takes into account
phenomena of overflow metabolism within glycolysis and glutaminolysis. These phenomena have been widely recognized in microbial biotechnology, e.g. in the case of ethanol production by Saccharomyces cerevisie (Fiechter and Gmünder, 1989; Sonnleitner and Käppeli, 1986) and acetate by Escherichia coli (Xu et al., 1999). In animal cell cultures cells convert a significant amount of glucose and glutamine to lactate and ammonia under high glucose and glutamine concentrations (Ljunggren and Häggström, 1992; Quesney et al., 2003). Therefore, mathematically describing this phenomenon is important in order to control cells at the most desirable metabolism state without unnecessary overflow metabolism. The first step of this study is to reasonably simplify central carbon metabolism networks, sketch out key reactions, and formulate a kinetic model. Then, the proposed metabolic model is validated with experimental data of fedbatch hybridoma cultures. Numerical results obtained for parameter estimation are presented and confidence intervals are also calculated. 2. MATERIALS AND METHODS The hybridoma cell line HB-58 (American Culture Collection-ATCC-), producing IgG1 monoclonal antibodies, specific for mouse kappa light chain, was used. Serum-free medium was prepared from basal medium DMEM/F12 (1:1), completed with glutamine, insulin, transferrin, cholesterol, Pluronic F-68, and HEPES etc. All supplements were purchased from Sigma-Aldrich (USA). The cells were kept as suspension cultures in the above serum-free medium in shake flasks at 37oC in a 5% CO2 incubator (Revco). The experiments have been performed by the staff at the ”State Key Laboratory of Bioreactor Engineering”, located in
East China University of Science and Technology (ECUST), Shanghai. Four experiments are used to develop, test and validate the model. The fed-batch cultures were performed in a controlled environment (37°C, 50% DO, and pH 7.0) into 1L bioreactors Super Spinner D 1000 and inoculated at a concentration of approximately 0.2 × 10⁶ cells/mL. The agitation rate was set to 120 rpm. 3. MODEL DEVELOPMENT 3.1 Metabolic pathways in mammalian cells In accordance with the literature on mammalian cells, the central metabolism of hybridoma cells (Haag et al., 2005; Provost and Bastin, 2004; Liu et al., 2008) is represented by the metabolic network depicted in (Fig. 1). This metabolic network describes only the part of the metabolism concerned with the utilization of the two main energetic nutrients (glucose and glutamine). The metabolism of the amino-acids provided by the culture medium is not considered.
biosynthesis. Ribose 5-phosphate is required for the synthesis of many important compounds like DNA, RNA, CoA and NAD+. Glutaminolysis utilizes glutamine for energy production. In glutaminolysis, glutamine is converted to pyruvate with the concomitant of NADH. The carbon skeleton of glutamine enters the TCA cycle via α-ketoglutarate (α-KG) (v16→v15) and leaves via malate which is then converted to pyruvate (v11→v13). The primary pathway of glutamine to α-KG goes through glutamate. TCA cycle (v9→v10→v11→v12) has the dual roles of generating energy and providing biosynthesis precursors. The carbon atoms from glucose via Ac-CoA are oxidized completely to CO2. This process will convert NAD+ to NADH and produce ATP. As stated above, glutamine enters the TCA cycle via a-KG and then follows the cycle to produce NADH which is used for ATP generation when coupled with oxidative phosphorylation. Taking into account all these pathways would lead to a very complex structured model, whose parameters would be impossible to identify given the limited number of measurements. Therefore a number of simplifying assumptions were retained: 1) Macroscopic reaction scheme = a set of biochemical ‘‘macro-reactions’’ linking measurable extra-cellular substrates to products, deduced from metabolism analysis. 2) Growth mainly influenced by 2 substrates (glucose and glutamine) and 2 by-products (lactate and ammonia). 3) Overflow metabolism of glucose and glutamine. 3.2 Overflow metabolism in mammalian cells
Fig. 1. Schematic diagram of simplified reaction network for mammalian cell metabolism. This network is essentially made of four fundamental pathways: the glycolysis pathway, the pentose phosphate pathway, the glutaminolysis pathway and the TCA cycle Glycolysis represents a biochemical pathway in which glucose is firstly converted into pyruvate (v1→v2→v5). Pyruvate is then used for ATP generation via TCA cycle (v8) or is converted to lactate (v6) which will be secreted from the cell to the medium. The primary function of the pentose phosphate pathway (v3) is to produce NADPH and ribose 5-phosphate. NADPH is one of the pyridine nucleotides used for reductive
Overflow metabolism denotes the incomplete oxidation, despite aerobic conditions, of an abundantly supplied energy source resulting in the excretion of organic end products. These metabolic byproducts are often inhibitory. Typical examples from microbial biotechnology are ethanol production by Saccharomyces cerevisiae (Fiechter and Gmünder, 1989; Sonnleitner and Käppeli, 1986) and acetate by Escherichia coli (Xu et al., 1999). In mammalian cell cultures overflow metabolisms are more complex than in microbial cultures. Overflow of glucose and glutamine result in formation of the toxic compounds lactate (Friesewinkel et al., 2010; Doverskog et al., 1997) and ammonia respectively (Ljunggren and Häggström, 1992; Doverskog et al., 1997). Glutamine is mainly excreted as alanine, proline and aspartate (Ljunggren and Häggström, 1992; Quesney et al., 2003). In order to develop a simple metabolic model describing phenomena of overflow metabolism within glycolysis and glutaminolysis in hybridoma cells, three typical metabolism states are proposed (Fig. 2), which are conceptually adapted from the work of Sonnleitner and Käppeli (1986).
Fig. 2. Illustration of the overflow metabolism in hybridoma cells. Case 1: Respiratory metabolism with glucose and glutamine completely consumed for cell growth; Case 2: Critical metabolism (maximum respiratory capacity) with cells maximum specific growth rate; Case 3: Overflow metabolism with excess glucose and glutamine waste. At low substrate uptake rate, glucose and glutamine are consumed with biomass growth and metabolites (lactate and ammonia) production without overflow metabolism, which is defined as respiratory metabolism. At high substrate uptake rates, there is a limitation of respiratory capacity, resulting in overflow metabolism towards excess metabolites production. The state at which overflow metabolism is initiated is referred to as critical metabolism. Based on animal cell metabolism networks, a simplified overflow metabolism is constructed, which only involves glucose and glutamine fluxes in the central carbon metabolism (Fig.3). Obviously, at the respiratory metabolism state the black pathways simply represent the glucose and glutamine flux distribution, whereas blue and red pathways (additional fluxes) indicate the occurrence of overflow metabolism of glucose and glutamine, respectively. Furthermore, other assumptions are made: 1) At the state of respiratory metabolism Pyruvate from glucose flows into two directions: entering TCA cycle (via pathway v3) and lactate production (via pathway v2). An overall macroscopic reaction of glucose consumption is given by: ϕG G → a× X + b× L
(1)
Glutamine is deaminated, yielding ammonia (via pathway v5), and also enters into the TCA cycle (via pathway v4), yielding ATP, CO2 and H2O for biosynthesis purposes (Häggström et al., 1996). An overall macroscopic reaction of glutamine consumption is given by: Gn Gn ϕ →c× X + d × N
(2)
where a (109cells/mmol), b, c (109cells/mmol) and d are the stoichiometric coefficients.
Fig. 3. Simplified metabolic network for hybridoma cells only presenting glucose and glutamine metabolic fluxes in the central carbon metabolism. 2) At the state of overflow metabolism The lactate production from glucose excess due to overflow metabolism is proposed as (Friesewinkel et al., 2010): Over−G G ϕ → 2 × L
(3)
Glutamine overflow is more complex than glucose overflow. Glutamine excess ends in production of ammonia, lactate and other amino acids as alanine, asparagine, aspartate, and proline (Ljunggren and Häggström, 1992). In accordance with element balance constraints and metabolic flux analysis (Provost and Bastin, 2004), the reaction of glutamine overflow metabolism is assumed as. Over − Gn Gn ϕ → N + (1 2) × L
(4)
3) Cell Maintenance It is assumed that consumption of glucose and glutamine for maintenance may not be neglected. This is valid because in mammalian cell cultures glucose and glutamine are considered as two energy sources for the production of ATP and reduced pyridine nucleotides; these compounds are used for maintenance of cellular integrity and for the synthesis of the required product (Häggström et al., 1996). 3.3 Kinetics of hybridoma cell cultures We propose to take inspiration from the simplified metabolic network and studies of yeast (Xu et al., 1999) with a phenomenon of overflow metabolism based on Monod-type kinetics. Global glucose consumption from substrate to pyruvate (via pathway v1) is represented as an extended Monod kinetics. The specific glucose consumption is influenced by the concentrations of glucose and glutamine (Ljunggren and Häggström, 1995; Zhou et al., 2006):
ϕ G1 = µ G max 1
G Gn XV K G + G K Gn1 + Gn
(5)
where µ Gmax1 (mmol/(109cells.h)) is the maximum specific uptake rate of glucose. Global glutamine consumption is represented by (6) where glutamine (Dhir et al., 2000) and ammonia (Zhou et al., 2006) are taken into account. ϕ Gn1 = µ Gn max 1
KN Gn XV K Gn + Gn K N + N
(6)
where µ Gnmax1 (mmol/(109cells.h)) is the maximum specific uptake rate of glutamine. At the critical state, the determination of the maximum growth capacity for glucose and glutamine (φGmax and φGnmax) is more problematic because a large number of factors appear to influence it. Initially it is assumed to introduce two factors associated to viable cells. The effects of viable cells are incorporated via two single linear terms: ϕG max = µG max 2 X V
(7)
ϕGn max = µGn max 2 X V
(8)
where µ Gmax2 and µ Gnmax2 are the maximum specific respiratory rates of glucose and glutamine, respectively. In short, the overflow metabolism model of glucose and glutamine can be described as follows: ϕ G = min( ϕ G 1 , ϕ G max ) ϕ Over − G = max( 0 , ϕ G 1 − ϕ G max ) ϕ Gn = min( ϕ Gn 1 , ϕ Gn max ) ϕ Over − Gn = max( 0 , ϕ Gn 1 − ϕ Gn max )
(9) (10)
K Gd K Gnd K Gd + G K Gnd + Gn
where µ dmax (1/h) is the maximum death rate. The consumption of glucose and glutamine for maintenance of viable cells is accounted by the maintenance coefficients mG and mGn (mmol/(109cells.h)), respectively. According to the above assumptions, the mass balance equations for the system in fed-batch mode are achieved: dX V F = aϕG + cϕ Gn − µ d X V − X V dt V
(12)
(14) (15) (16) (17)
Additionally, an indicator of overflow is proposed for each substrate (glucose and glutamine) as follows: 1 if ϕ G 1 ≥ ϕ G max Indi .over .G = 0 if ϕ G 1 < ϕ G max
(18)
1 if ϕ Gn 1 ≥ ϕ Gn max Indi .over .Gn = 0 if ϕ Gn 1 < ϕ Gn max
(19)
4. RESULTS AND DISCUSSION In this work, dynamic equations were solved by MATLAB’s ordinary differential equation solver function ode15s. The identification of parameters was performed by using the Nelder-Mead simplex optimization algorithm (function fminsearch) in order to minimize a least-squares criterion (sum of squared differences between model predictions and experimental measurements) n N
(11)
(13)
where V (L) is the reactor volume and F (L/h) the volumetric feed rate. Gin and Gnin, are the concentrations of glucose and glutamine in the feed stream.
T
J (θ ) = ∑ ∑ ( yij (θ ) − ymesij ) Qij−1 ( yij (θ ) − ymes )
The mechanisms that lead to cell death are very complex. Apoptosis and necrosis are two general ways of cell death. The exhaustion of limited nutrients was considered as a main reason of cell death (Jang and Barford, 2000). Some investigators proposed that the specific death rate is a function of more than one of the metabolites including ammonia, lactate, glucose, and glutamine in the medium (Tremblay et al., 1992; Xing et al., 2010). Others proposed that the specific death rate is a function of specific growth rate (Zhou et al., 2006). In this study, the specific death rate, µ d is assumed to be a function of the concentration of glucose, and glutamine accumulating in the culture. µ d = µ d max
dX d F = µd X V − X d dt V dG F = −ϕ G − mG X V − ϕ G −Over + (Gin − G ) dt V dGn F = −ϕGn − mGn X V − ϕ Gn−Over + (Gnin − Gn) dt V dL 1 F = bϕG + 2ϕ G −Over + ϕ Gn −Over − L dt 2 V dN F = dϕ Gn + ϕ Gn−Over − N dt V
j =1i =1
(20)
ij
where θ is the vector of the stoichiometric and kinetic T parameters to be identified (dimθ=17), y ij(θ)=[Xvij Xdij Gij Gnij Lij Nij] is the vector of the simulated variables (using model (12)-(17)) at the ith time instant in the jth experiment, ymesij is the vector of the corresponding measurements and Q-1ij is a positive-definite symmetric weighting matrix. In a first step, Qij has been defined as a diagonal matrix containing the squared maximum values of each measured state variable, in order to normalize all the signals (parameter values 1 in table 1). In a second step, Qij has been defined as a diagonal matrix containing the variances of the measurement errors (parameter values 2 in table 1), assuming the variation coefficients were time-invariant for each state variable (XV: 5%, Xd: 10%, G: 5%, Gn: 15%, L: 5%, N: 5%) Among the 4 available experiments, the 4 existing subsets of 3 experiments have been used for parameter identification and, in each case, the remaining experiment has been used for cross-validation. Due to paper length limitation, only the results of parameter identification with the experiments 123 are presented in Figure 4-5 and Table 1. Discrete-time experimental data are represented with circles (associated with their 95% confidence intervals) while model simulations are depicted as continuous lines.
3 2 1
0
50
100 Time (h)
150
1
10 5
0.5 0
0
50
100 Time (h)
150
0
200
2 1
15 10 5
0
50
100 Time (h)
150
0
200
0
50
100 Time (h)
150
200
0
50
100 Time (h)
150
200
0
50
100 Time (h)
150
200
4
20 Lactate (mM)
Glutamine (mM)
15
25
3
0
2 1.5
200
4
20
Ammoniaque (mM)
0
3 2.5 Glucose (mM)
Dead Biomasse (106 cells/ml)
Viab Biomasse (106 cells/ml)
4
0
50
100 Time (h)
150
3 2 1 0
200
1 1
0.6 0.4 0.2
0.8
0.8 Volume
Ind. Overflow Gn
Ind. Overflow G
1 0.8
0.6 0.4 0.2
0
0.6 0.4
0 0
50
100 Time (h)
150
200
0
50
100 Time (h)
150
0.2
200
4 3 2 1 0
0
50
100 Time (h)
150
200
20
3
15
2 1 0
0
50
100 Time (h)
150
10 5 0
200
30
7
4
25
6
3 2
20 15 10
1
5
0
0
0
50
100 Time (h)
150
200
Ammoniaque (mM)
5
1
0
50
100 Time (h)
150
200
0
50
100 Time (h)
150
200
0
50
100 Time (h)
150
200
0
50
100 Time (h)
150
200
5 4 3 2 1 0
1 Ind. Overflow Gn
Ind. Overflow G
4
Glucose (mM)
Dead Biomasse (106 cells/ml)
5
Lactate (mM)
Glutamine (mM)
Viab Biomasse (106 cells/ml)
Fig. 4. Comparison between model simulation and measurements of culture 1 after parameter identification with experiments 1, 2 and 3 (direct validation)
0.8 0.6 0.4 0.2
0.8 0.6 0.4 0.2
0 0
50
100 Time (h)
150
200
0
Fig. 5. Comparison between model simulation and measurements of culture 4 after parameter identification with experiments 1, 2 and 3 (cross-validation). As illustrated in Fig. 4 and 5, the profiles of glucose (G), lactate (L), glutamine (Gn), ammonia (N) and viable cell density (XV) are well simulated by the model in direct validation as well as in cross-validation. It is shown that mostly dead cells (Xd) are underestimated, which is probably due to the large measurement uncertainties of dead cells by trypan blue assay in the cultures. It is seen from indicators of overflow that all cultures start with overflow metabolism, i.e., glucose and glutamine are in excess of respiratory capacity. As a result, lactate and ammonia are overproduced. Glucose and glutamine are consumed for production of biomass, lactate and ammonium, as described in reactions (1), (2), (3) and (4) of the reaction scheme. Once the glucose and glutamine are depleted, shift metabolisms are found, around 80 h. Since then, cultures are operated on respiratory metabolism.
Table 1. Parameter values identified with experiments 123 Parameter µ Gmax1 µ Gmax2 µ Gnmax1 µ Gnmax2 µ dmax KG KGn KN KGn1 a b c d mG mGn KGd KGnd
Literature 0.05 0.05 0.05 0.05 0.029 1 0.3 5 0.3 1 2 1 0.5 0.04 0.01 1 0.02
*
Values 1
Values 2
0.2971 0.0384 0.1238 0.0218 0.1302 1.0016 0.0314 1.9268 0.1029 0.6722 1.8180 0.3466 0.4929 0.0383 0.0025 0.4347 0.0020
1.1004 0.0267 0.1774 0.0173 0.0145 28.2241 0.0016 0.9880 0.0026 1.1461 2.7666 0.4083 0.4502 0.0505 0.0035 2.0328 0.0017
Variation coefficients (%) 5,72% 7,70% 1,90% 3,01% 8,55% 8,03% 30,92% 2,12% 34,10% 7,61% 3,17% 5,26% 7,46% 0,63% 20,76% 14,74% 42,95%
*
The values are adopted from literature (Tremblay et al., 1992; Dhir et al., 2000; Xing et al., 2010)
Cultures 3 (results not shown) and 4 are operated always in glutamine overflow metabolism, which is probably due to the concentration of glutamine in the feeding medium which is twice the one of cultures 1 and 2. Concerning the parameter identification, from table 1, it is shown that the values of the 17 identified parameters are consistent with those from the literature. Furthermore, the parameters identified with the two types of weighting matrix Qij (values1 and values 2) are of the same order of magnitude. At the same time, parameters are identified with a good accuracy except KGn, KGn1 and KGnd. By comparing the magnitude orders of the sensitivity functions (derivative of each model output with respect to each model parameter) it is found that the system, whatever the output, is not sensitive to these three parameters (results not shown). In order to solve this problem of lack of precision in the identification of parameters KGn, KGn1 and KGnd, a model reduction could be considered. 5. CONCLUSIONS In this paper, a simple metabolic model, which describes the growth of mammalian cell cultures, has been presented. The new macroscopic model divides global glucose and glutamine consumption into two parts: one is respiratory metabolism and another is overflow metabolism. Accordingly, three typical metabolism states are proposed, namely respiratory metabolism, critical metabolism and overflow metabolism states. The proposed model is validated with hybridoma HB-58 cell cultures and gives satisfactory predictions during all periods of cultures. Additionally, future improvement and generalization of this overflow metabolism model to other cells cultures (CHO cells) may present some clues for understanding the mechanism of overflow metabolism. Nevertheless, a few identified parameters have large confidence intervals, which indicates that the model could be reduced. This will be the subject of further investigation. ACKNOWLEDGMENTS This paper presents research results of the Belgian Network DYSCO (Dynamical Systems, Control, and Optimization), funded by the Interuniversity Attraction Poles Programme, initiated by the Belgian State, Science Policy Office. The scientific responsibility rests with its authors. Work has been supported by FEDER (European Union and Wallonia Region) in the Hainaut-Biomed program (OCPAM project). The authors thank Prof. W. Tan (State Key Laboratory of Bioreactor Engineering, East China University of Science and Technology, Shanghai, China) for providing the experimental data.
REFERENCES Bailey, J. (1998). Mathematical modeling and analysis in biochemical engineering: past accomplishments and future opportunities. Biotechnology Progress, 14, 8-20. Dhir, S., Morrow, K. J., Rhinehart, R. R. and Wiesner, T. (2000). Dynamic optimization of hybridoma growth in a fed-batch bioreactor. Biotechnology and Bioengineering, 67(2), 197-205. Doverskog, M., Ljunggren, J., Öhman, L. and Häggström, L. (1997). Physiology of cultured animal cells. Journal of Biotechnology, 59, 103-115. Fiechter, A. and Gmünder, F.K. (1989). Metabolic control of glucose in yeast and tumor cells. Advances in Biochemical Engineering/Biotechnology, 39, 1-28. Friesewinkel, P., Niu, H., Drugmand, J.-Ch. and Bogaerts, Ph. (2010). Simple Metabolic Modelling of Vero Cell Growth on Glucose in Fixed-bed Bioreactors, Proceedings of the 11th IFAC Symposium on Computer Applications in Biotechnology (CAB2010), Leuven (Belgium), 7-9/7/2010. Haag, J., Vande Wouwer, A. and Bogaerts, Ph. (2005). Dynamic Modeling of Complex Biological Systems: A Link between Metabolic and Macroscopic Description. Journal of Mathematical Biosciences, 193, 25-49. Häggström, L., Ljunggren, J. and Ohman, L. (1996). Metabolic engineering of animal cells. Ann NY Acad Sci, 782 40-52. Jang, J.D. and Barford, J.P. (2000). An Unstructured Kinetic Model of Macromolecular Metabolism in Batch and Fed-Batch Cultures of Hybridoma Cells Producing Monoclonal Antibody. Biochemical Engineering Journal, 4(2), 153-168. Liu, Y., Bi, J., Zeng, A. and Yuan, J. (2008). A cybernetic model to describe the dynamics of myeloma cell cultivations. Applied Mathematics and Computation, 205(1), 84-97. Ljunggren, J. and Häggström, L. (1992). Glutamine limited fedbatch culture reduces the overflow metabolism of amino acids in myeloma cells. Cytotechnology, 8, 45-56. Ljunggren, J. and Häggström, L. (1995). Specific growth rate as a parameter for tracing growth-limiting substances in animal cultures. Journal of Biotechnology, 42, 163-175. Provost, A. and Bastin, G. (2004). Dynamic metabolic modelling under the balanced growth condition. Journal of Process Control, 14(7), 717-728. Quesney, S., Marc, A., Gerdil, C., Gimenez, C., Marvel, J., Richard, Y. and Meignier, B. (2003). Kinetics and metabolic specificities of Vero cells in bioreactor cultures with serum-free medium. Cytotechnology, 42, 1-11. Sonnleitner, B. and Käppeli, O. (1986). Growth of Saccharomyces cerevisiae is controlled by its limited respiratory capacity: Formulation and verification of a hypothesis. Biotechnology and Bioengineering, 28(6), 927-937. Tremblay, M., Perrier, M., Chavarie, C. and Archambault, J. (1992). Optimization of fed-batch culture of hybridoma cells using dynamic programming: single and multi-feed cases. Bioprocess and biosystems engineering, 7(5), 229-234. Xing, Z., Bishop, N., Leister, K. and Li, Z. J. (2010). Modeling kinetics of a large-scale fed-batch CHO cell culture by Markov chain Monte Carlo method. Biotechnology progress, 26 (1), 208-219. Xu, B., Jahic, M., and Enfors, S.O. (1999). Modeling of overflow metabolism in batch and fed batch cultures of Escherichia coli. Biotechnology Progress, 15, 81-90. Zhou, F., Bi, J.X., Zeng, A.-P. and Yuan, J.Q. (2006). A macrokinetic and regulator model for myeloma cell culture based on metabolic balance of pathways. Process of Biochemistry, 41, 2207-2217.