Tunable temperature induced magnetization jump in a GdVO3 single crystal L D Tung* Department of Physics, University of Warwick, Coventry CV4 7AL, United Kingdom. (dated: 20 Dec. 05, accepted to be published in Physical Review B) Abstract: We report a novel feature of the temperature induced magnetization jump observed along the a-axis of the GdVO3 single crystal at temperature TM ≈ 8 K. Below TM, the compound shows no coercivity and remanent magnetization indicating a homogenous antiferromagnetic structure. However, we will demonstrate that the magnetic state below TM is indeed history dependent and it shows up in different jumps in the magnetization only when warming the sample through TM. Such a magnetic memory effect is highly unusual and suggesting different domain arrangements in the supposedly homogenous antiferromagnetic phase of the compound.
PACS numbers: 75.50.Ee; 75.30.Kz; 75.60.Lr
____________________________ * Email address
[email protected]
1
I. INTRODUCTION The Mott insulating transition metal oxides are among systems with the richest physical properties. In the past decade or so, despite of increasingly worldwide efforts in the studies, understanding many anomalous properties of the Mott insulators is still at infancy. The RVO3 compounds (R = rare earth or Y) are Mott insulators which have some special characteristics. The magnetism of the compounds is driven mainly by the V3+ ions which have d2 configuration with two electrons coupled ferromagnetically according to the Hund’s rule. The two electrons can occupy two states of the degenerate triplet t2g orbitals, and thus orbital quantum fluctuation (OQF) is expected. When cooling to temperature below TOO (ranging from 141 K to ~200 K for different rare earths [1]), the RVO3 compounds experience the orbital ordering (OO) transition which involves marked redistribution of the valence electron density. OO is usually driven by the Jahn-Teller (JT) lattice distortion which will lift the orbital degeneracy and suppress OQF. Recently, the central discussions on the RVO3 compounds have been focused on OQF versus JT physics [2-5]. The RVO3 compounds have been reported with numerous anomalous magnetic properties including temperature induced magnetization reversal [6-11], low field sensitive character [11,12], staircaselike hysteresis loops [12] etc. In the present paper, we will report a novel feature related to the magnetic memory effect observed along the a-axis of the GdVO3 single crystal which have not been detected previously by earlier studies for polycrystalline [13-15] and single crystal sample [1]. II. EXPERIMENT GdVO3 single crystal was grown by means of the floating zone technique using a high temperature Xenon arc-furnace. Detail procedure of the crystal growth is similar to compounds with other rare earths which have been previously described [11,12].
2
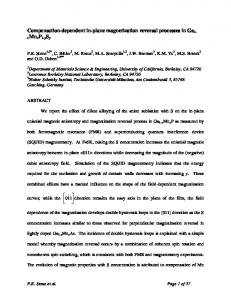
Measurements of the zero-field-cool (ZFC) [Ref.16], field-cooled (FC) magnetization and the magnetic isotherms of the sample were carried out in a commercial SQUID magnetometer. In the FC measurements, the sample is cooled from paramagnetic region to 1.8 K in an applied field. In here, the data can be taken either on cooling (FCC) or on warming (FCW). For the ZFC measurements, the sample is cooled in zero field to 1.8 K before the magnetic field is applied. The data are then taken on warming. Heat capacity measurements of the sample were carried out in a Physical Property Measurement System (PPMS) using a heat capacity option. III. RESULTS In Fig. 1, we present the heat capacity C and C/T as a function of temperature for the compound. The OO transition occurs at TOO = 199 K and then is followed by an antiferromagnetic (AF) spin ordering (SO) transition at TSO = 118 K. In the ordering region below TSO, we observed another transition at temperature TM of about 8 K. Our heat capacity data are similar with those previously reported on single crystal sample by Miyasaka et al. [1]. The results of FCC, FCW magnetization of the GdVO3 single crystal along the main axes are presented in Fig. 2. In here the a- b- and c-axes are defined according to the Pbnm orthorhombic lattice with the lattice parameters a = 5.342 Å, b = 5.604 Å, c = 7.637 Å [17]. We would like to note that, for GdVO3, the data of the neutron diffractions measurements are not available due to the neutron absorbent nature of Gd. However, for other compounds with R = La-Dy, it is known from powder neutron diffraction results [18] that the magnetic structure is of C-type, i.e. the spins order antiferromagnetically in the ab-plane and ferromagnetically along the c-axis. Since Gd is in between La and Dy, it is therefore reasonable to assume also the C-type magnetic structure for the compound.
3
From Fig. 2, it can be seen that the two transitions at TSO and TM observed from the previous heat capacity data are again shown up in the magnetization data. At the OO temperature, we cannot detect any anomaly in the inversed susceptibility (Fig. 3). The Curie-Weiss behavior is perfectly followed at temperatures few degrees above TSO and the fittings give the effective moment µeff = 8.30±0.05 µB/f.u. and Weiss temperature θp = -17±1.75 K along all the main axes. Since, in the paramagnetic region, the system consists of the two different non-interacting spins V3+ and Gd3+, the
effective
moments
can
be
estimated
through
the
relationship
3+
µeff = µeff 2 (V ) + µeff 2 (Gd 3+ ) [12]. Assuming that the spins of the V3+ and Gd3+ are in the ground state with µeff (V3+) = 2.83 µB (spin only, S = 1) and µeff (Gd3+) = 7.94 µB, an effective moment µeff (GdVO3) = 8.43 µB is obtained, which is very close to the observed experimental value. A noteworthy feature in the FCC, FCW data is also on the magnetization reversal observed along the a-axis at two temperatures denoted as To and Ts in Fig. 2. The values of To and Ts are dependent on the applied field and also on whether it is derived from FCC or FCW. At large enough field, e.g. H = 0.5 kOe, there is no magnetization reversal nor any anomaly around Ts and To (data not shown). In Fig. 4, we present the magnetic isotherms of the compounds measured along the main axes at different temperatures. In the “high” field regime, we observe a change in the features of the magnetization curves. Below TM, there appear the field induced transition(s) along the a- and b-axes and the hysteresis along all the main axes which become disappeared at temperatures above TM. The details of the magnetic isotherms around the origin are blown up and displayed in Fig. 5. It can be seen that there is also a characteristic change in the behavior of the magnetic
4
isotherms at temperatures below and above TM. Below TM, we observe no remanent magnetization and coercivity (Fig. 5a). The remanent magnetization and coercivity develop noticeably along the a-axis at temperature above TM (Fig. 5b, c, d) which result in the magnetization reversal observed only along this direction (Fig. 2). The coercivity at 110 K (close to TSO) is even higher than that obtained at 50 K and 12 K. The increase of the coercivity with increasing temperature observed in GdVO3 is in contrast with conventional magnets in which thermal energy should lead to the reduction of the coercivity. Since the a-axis is a “peculiar” direction, we have carried out in more details with further measurements. Earlier, we have reported that, in many of the RVO3 compounds, the ZFC magnetization can be seriously affected by a presence of the inevitable trapped field (TF) in the superconducting magnet of SQUID [11,12]. We have examined the TF carefully. Before each measurement, we ran the degauss sequence to minimize the TF, its absolute value is estimated to be less than 2 Oe. We can “generate” the TF with opposite sign just by reversing the sign of the magnetic fields in the degauss sequence. In Fig. 6, we present the ZFC data of the compound bound with positive TF (PTF) and negative TF (NTF). From the Figure, it can be seen that the transition temperature TM separates the ZFC curves into two distinctively different behaviors. Below TM, the ZFC magnetization always follows the direction of the applied field in which it is being measured (hereafter denoted as Hmeas). The two ZFC_PTF and ZFC_NTF curves (almost) coincide to each other (inset of Fig. 6). This observation is consistent with the fact that, below TM, the compound does not have coercivity (Fig. 5a). When warming through TM, the magnetization direction is no longer bound to the direction of Hmeas, but to the TF under which the sample had been cooled previously. It means that, in this case, the magnetization direction can
5
memorize its previous state and behaves accordingly to it, i.e. the magnetic memory effect. In order to explore this feature further, we carry out two different measurement protocols named as PA and PB. In PA, we first cool the sample in either PTF or NTF to 1.8 K. At this temperature, we start to “train” the sample by applying different magnetic field up to 50 kOe. The field is then switch to Hmeas (chosen as 50 or 10 Oe), and the data are taken following the temperature sweep-up. In Fig. 7, we display the results corresponding with cooling in PTF (7a, 7c), and NTF (7b, 7d). In each Figure, the data of the no-training ZFC curve bound with an opposite TF are also added for comparison. In the insets of the Figure we have included also expanded views of the data at temperatures below TM to indicate that, in this region, there is hardly any effect of the TF as well as the training fields on the obtained data. When warming the sample through TM, the training field clearly shows its effect through different jumps in the sign and magnitude of the magnetization. With increasing the training field, we observed systematically that the jump is suppressed to make the two ZFC_PTF and ZFC_NTF curves to behave towards each other. The jump of the magnetization at TM in a certain Hmeas, thus, can be controlled through the training field. In another measurement protocol PB, we first cool the sample in different magnetic fields (i.e. FC). Then at 1.8 K, the magnetic field is switched to Hmeas (chosen as 100 Oe, 50 Oe or 10 Oe), and the data are taken following the temperature sweep-up. In Fig. 8, we display the results with cooling in positive field (8a, c, e) and negative field (8b, d, f). We note that at a certain Hmeas, the FC_PTF and FC_NTF in Fig. 8 are exactly the same as the ZFC_PTF and ZFC_NTP with “no-training” in Fig. 7, respectively. We have also included, in the insets of Fig. 8, the extended views of the data below TM, to indicate that, in this temperature region, the different cooling
6
fields hardly have any effect on the obtained results. When warming through TM, it is again obvious that the different cooling fields systematically result in different jumps in the sign and magnitude of the magnetization. In this case, it is clear that the jump of the magnetization at TM in respect to Hmeas can be controlled both by the sign and the magnitude of the cooling field. IV. DISCUSSIONS The magnetic memory effect observed in GdVO3 is very puzzling. Since it is only shown up through a magnetization jump at a single transition temperature TM, the feature is distinctively different with other magnetic memory systems including spin glass [19] nanomagnetic particles [20] and phase separated manganites [21]. In the latter cases, aging and rejuvenation effects are usually being involved. Earlier, studies on GdVO3 polycrystalline sample [15] reported a transition at 7.5 K (close to TM of 8 K in our crystal) which was referred to as the antiferromagnetic Néel temperature of the compound. Recently, Miyasaka et al. [1] reported the heat capacity results for GdVO3 single crystal which also shows three transitions as in our heat capacity data. The transition at TM, however, was not discussed into details in their work. From the magnetic isotherms at 1.8 K in Fig. 4a, we can see that the magnetization is “saturated” above applied field of about 40 kOe with a slight anisotropy in the magnetization values obtained along different axes. The saturation magnetization obtained at 50 kOe is of about 6.7 µB/f.u. Since this value is very close to a theoretical value of 7 µB for a Gd3+ free ion and much larger than 2 µB for a V3+ free ion, it is reasonable to think that all of the Gd moments have been forced parallel at field of 50 kOe and they contribute mostly to the saturation magnetization obtained. The V3+ moments, on the other hand, are strongly antiferromagnetically coupled, as revealed by the high value of TSO and the negative Weiss temperature. Thus the
7
applied field, which is at least two orders of magnitude smaller than the V-V AF superexchange interaction, should not have any significant influence on the vanadium moments. This scenario, however, can hardly account for the field induced magnetic phase transitions observed at low temperature for the compound, taking into account the fact that Gd3+ has S spin character with no crystalline anisotropy and its behavior under the magnetic field should be relatively simple. Obviously there should be some “extra” factors, e.g. related to V3+ magnetism, to account fully for the anomalous behavior of the magnetic isotherms at 1.8 K. The importance of the V3+ magnetism is also being revealed through the magnetic memory effect at TM. The transition at TM, is clearly not just only due to the “trivial” AF ordering of the Gd moments. Apart from the magnetic memory effect, we also note that coercivity and remanent magnetization can develop only at temperatures above TM. Previously, we have proposed that these latter features as well as the magnetization reversal should be originated from the inhomogeneous nature of the compound due to OQF [11,12]. According to our model, then the transition at TM should also be related to the fact that the compound is changed from an inhomogeneous V3+ antiferromagnetism to a homogeneous one at lower temperature which apparently does not own any coercivity and remanent magnetization. To let it happen, we would speculate that there should be a (significant) JT lattice distortion caused by the AF ordering of the Gd moments at TM and so it can suppress the effect of OQF of V3+ ions. In here, the question of how come the homogeneous AF phase can memorize its history at TM remains elusive. In any case, the magnetic memory effect observed in GdVO3 compound would suggest that the magnetic state below TM is to be characterized by different configurations of the magnetic domains in which each configuration has a specific link to sample’s history. Such a different domain
8
configuration in homogenous AF phase depending on the history of the sample was observed previously for YMnO3 [22] even though with no such of the magnetic memory effect as in the case of GdVO3. V. CONCLUSIONS In summary, we have studied the magnetic properties of the GdVO3 single crystal. The compound has been shown to exhibit very rich magnetic properties including low field sensitive character, field induced phase transitions, magnetization reversal and magnetic memory effect. The latter is a unique feature of GdVO3 among other orthovanadate compounds and it is distinctively different with many other magnetic memory systems such as spin glass, magnetic nano particles and the phase separated maganites. The controllable magnetization switch in both direction and magnitude may make the compound a potential material for constructing some spin valve devices. We have suggested that the compound is homogenously AF at low temperature but it can have different configurations of domains which show up differently through the magnetization jump at TM. Further experiments, e.g. neutron diffraction to determine the magnetic structure, optical spectroscopy to visualise the domains, as well as theoretical consideration are needed to shed light on this interesting magnetic memory phenomenon. ACKNOWLEDGEMENTS We gratefully acknowledge support from EPSRC, UK. References 1. S. Miyasaka, Y. Okimoto, M. Iwama and Y. Tokura, Phys. Rev. B, 68, 100406 (2003). 2. C. Ulrich, G. Khaliullin, J. Sirker, M. Reehuis, M. Ohl, S. Miyasaka, Y. Tokura and B. Keimer, Phys. Rev. Lett., 91, 257202 (2003).
9
3. G. Khaliullin, P. Horsch and A.M. Oleś, Phys. Rev. Lett., 86, 3879 (2003). 4. Y. Motome, H. Seo, Z. Fang and N. Nagaosa, Phys. Rev. Lett., 90, 146602 (2003). 5. Z. Fang and N. Nagaosa, Phys. Rev. Lett., 93, 176404 (2004). 6. N. Shirakawa and M. Ishikawa, Jpn. J. Appl. Phys., 30, L755 (1991). 7. A.V. Mahajan, D.C. Johnston, D.R. Torgeson and F. Borsa, Physica C, 185-189 1095 (1991); Phys. Rev. B, 46, 10966 (1992). 8. Y. Kimishima, Y. Chiyanagi, K. Shimizu and T. Mizuno, J. Magn. Magn. Mater., 210, 244 (2000); Y. Kimishima, S. Nishida, T. Mizuno, Y. Chiyanagi and M. Uehara, Sol. State Comm., 122, 519 (2002). 9. Y. Kimishima, M. Uehara and T. Saitoh, Sol. State Comm., 133, 559 (2005). 10. Y. Ren, T.T.M. Palstra, D.I. Khomskii, E. Pellegrin, A.A. Nugroho, A.A. Menovsky and G.A. Sawatzky, Nature, 396, 441 (1998); Y. Ren, T.T.M. Palstra, D.I. Khomskii, A.A. Nugroho, A.A. Menovsky and G.A. Sawatzky, Phys. Rev. B, 62, 6577 (2000). 11. L.D. Tung, Phys. Rev. B, submitted (2005). 12. L.D. Tung, Phys. Rev. B, 72, 054414 (2005). 13. Y. Kimishima, M. Takahashi, K. Okada, H. Ishikawa and Y. Ichiyanagi, J. Magn. Magn. Mater., 140-144, 1185 (1995). 14. T. Sakai, G. Adachi, J. Shiokawa and T. Shin-ike, J. App. Phys., 48, 379 (1977). 15. R.M. Bozorth, H.J. Williams and D.E. Walsh, Phys. Rev., 103, 572 (1956). 16. Through out the paper, we use zero and ZFC in italics to indicate that we ignore the small trapped field in the SQUID superconducting magnet. 17. Mcllvried and McCarthy, Penn State University, University Park, Pennsylvania, ICDD Grand-in-Aid, (1974) (x-ray data base file ID 25-0205).
10
18. V.G. Zubkov, G.V. Bazuev and G.P. Shveikin, Sov. Phys. Solid State, 18, 1165 (1976). 19. V. Dupuis, E. Vincent, J.-P. Bouchaud, J. Hammann, A. Ito and H.A. Katori, Phys. Rev. B., 64, 174204 (2001). 20. M. Sasaki, P.E. Jönsson, H. Takayama and H. Mamiya, Phys. Rev. B, 71, 104405 (2005). 21. P. Levy, F. Parisi, L. Granja, E. Indelicato and G. Polla, Phys. Rev. Lett., 89, 137001 (2002). 22. M. Fiebig, D. Fröhlich, S. Leute and R.V. Pisarev, J. App. Phys., 83, 6560 (1998).
11
0.6
100
GdVO3
0.5
80 0.4
C(J/molK)
TM
TOO
0.3
40
0.2
2
TSO
C/T(J/molK )
60
0.1
20
0.0 0 0
50
100
150
200
250
300
T(K)
Fig. 1 (colors online): Heat capacity C and C/T as a function of temperature of the GdVO3 single crystal. H=0.1kOe;
FCC
FCW
1.8
a-axis
TM
1.2
TSO
To
Ts
0.6 0.0 0.4
b-axis
M(emu/g)
0.3 0.2 0.1 0.0 0.4
c-axis
0.3 0.2 0.1 0.0 0
20
40
60
80
100
120
T(K)
Fig. 2 (colors online): FCC, FCW magnetization of the GdVO3 single crystal measured at 0.1 kOe along the main axes.
12
1.0
GdVO3 H=0.1kOe
0.9
a-axis
b-axis
c-axis
1/χ(Tg/emu)
0.8
0.7
0.6
0.5
0.4 120
140
160
180
200
220
240
260
280
300
T(K)
Fig. 3 (colors online): Temperature dependence of the inverse susceptibility in the paramagnetic region of the GdVO3 single crystal.
GdVO3 a-axis
H_up
H_dn; b-axis
H_up
H_dn; c-axis
H_up
H_dn
4.5
(a) T=1.8K
6.0
(b) T=12K
M(µB/f.u.)
4.5
3.0
3.0 1.5 1.5 0.0
0.0 0
20
30
40
50
0 0.6
(c) T=50K
1.2
M(µB/f.u.)
10
10
20
30
40
50
20
30
40
50
(d) T=110K
0.4
0.8
0.2
0.4
0.0
0.0 0
10
20
H(kOe)
30
40
50
0
10
H(kOe)
Fig. 4 (colors online): The magnetic isotherms of the GdVO3 single crystal measured along the main axes at different temperatures: 1.8 K (a); 12 K (b); 50 K (c) and 110 K (d). The symbols correspond with increasing field sections, lines with decreasing sections.
13
GdVO3
0.02
M(µB/f.u.)
0.01
a-axis
b-axis
(a) T=1.8K
0.04
c-axis
(b) T=12K
0.02
0.00
0.00 -0.02
-0.01
-0.04 -0.02 -100 -80 -60 -40 -20 0.010
0
20
40
60
80
100
-300
-250
-200
-150
H(Oe)
-100
-50
0
50
100
-200
-100
0
100
H(Oe)
(c) T=50K
0.008
(d) T=110K
0.005
M(µB/f.u.)
0.004 0.000
0.000
-0.005
-0.010 -300
-0.004
-250
-200
-150
-100
H(Oe)
-50
0
50
-0.008 100 -700
-600
-500
-400
-300
H(Oe)
Fig. 5 (colors online): The expanded views around the origin of the decreasing field sections of the magnetic isotherms of the GdVO3 single crystal measured along the main axes at different temperatures: 1.8 K (a); 12 K (b); 50 K (c) and 110 K (d).
14
GdVO3 a-axis 0.6
(a)
0.4
Hmeas= 0.01kOe ZFC_PTF
ZFC_NTF
M(emu/g)
0.2 0.0 0.04
-0.2
0.02
-0.4
0.00 -0.6 -0.02 -0.8
0
2
4
20
40
60
(b)
Hmeas= -0.01kOe
6
8 80
100
120
0.4
ZFC_PTF
0.2
ZFC_NTF
M(emu/g)
0.0 0.02
-0.2
0.00
-0.4
-0.02 -0.6 -0.04 -0.8
0
20
2
4
6
8
40
60
80
100
120
T(K)
Fig. 6 (colors online): Effect of the trapped field on the ZFC magnetization measured along the a-axis of the GdVO3 single crystal in applied field Hmeas of 10 Oe (a) and 10 Oe (b). The inset shows an expanded view in the temperature region below TM.
15
GdVO3 a-axis, with training fields at T=1.8K no training 0.8
(a)
5kOe
10kOe
0.12
15kOe 0.8
0.10
ZFC_PTF
M(emu/g)
0.08
0.4
0.06
0.2
0.04
2
4
6
8
0.08
0.4
0.04
0.2
0.00
ZFC_PTF, Hmeas=0.05kOe -0.2
-0.2 ZFC_NTF
0
2
4
6
8
20
40
60
80
100
120
-0.4
ZFC_NTF, Hmeas=0.05kOe 0
0.6
0.6
ZFC_PTF, Hmeas=0.01kOe
0.0
0.0
-0.4
2
ZFC_NTF
20
120
ZFC_NTF, Hmeas=0.01kOe
0.02
-0.6
0.00
0
100
0.04
-0.4
0.02
-0.6
80
0.06
-0.2
0.04
60
ZFC_PTF
0.2
0.06
40
0.4
0.2
-0.2
20
(d)
(c)
0.4
M(emu/g)
50kOe
0.0
0.0
-0.8
40kOe 0.12
(b)
0.6
0.6
28kOe
40
4
60
T(K)
6
80
0.00
8
100
120
-0.8
0
20
40
2
4
60
6
80
8
100
120
T(K)
Fig. 7 (colors online): Effect of the training fields at 1.8 K on the temperature dependence of the ZFC_PTF (left panels) and ZFC_NTF (right panels) measured in different applied fields Hmeas of 50 Oe (top), 10 Oe (bottom) along the a-axis of the GdVO3 single crystal. The inset shows an expanded view in the temperature region below TM.
16
GdVO3 a-axis FC 1.0
PTF 5kOe 28kOe
(a)
1.2
0.1kOe 15kOe 50kOe
0.25
M(emu/g)
0.20
0.16 0.4
0.15
0.4
0.10
2
4
6
Hmeas=0.1kOe 20
40
60
80
0.12 0.08
0.2
8
0.0 0
100
0.0
120
2
M(emu/g)
PTF 5kOe 28kOe
(c)
0.8
0.12
0.6
0.09
0.4
0.06
0.2
0.03
0.1kOe 15kOe 50kOe
20
40
20
40
4
60
6
8
80
100
PTF 5kOe 28kOe
(e) 0.6
2
0.1kOe 15kOe 50kOe
0 0.2
20
M(emu/g)
8
40
60
80
-0.1kOe -15kOe -50kOe 100
120
(f)
0.0
0.06 -0.2
0.04 0.02
-0.4
2
4
6
8
0.00
0.0
2
4
6
Hmeas=0.01kOe
Hmeas=0.01kOe 60
80
100
120
-0.8
0
20
40
T(K)
8
NTF -5kOe -28kOe
-0.6
40
6
NTF -5kOe -28kOe
Hmeas=0.05kOe
-0.30
120
0.2
20
4
-0.15
0.06
0
120
0.06
0.03
-0.2
100
0.09 0.30
0.09
0.00
80
0.00
2
0.8
0.4
8
0.12
0.15
Hmeas=0.05kOe 0
6
60
(d)
0.45
0.0 -0.2
4
Hmeas=0.1kOe 0
1.2 1.0
-0.1kOe -15kOe -50kOe
0.20
0.6
0.8
NTF -5kOe -28kOe
(b)
0.8
60
80
-0.1kOe -15kOe -50kOe 100
120
T(K)
Fig. 8 (colors online): Effect of different cooling fields (positive fields on the left panel, negative fields on the right panel) on the temperature dependence of the magnetization measured in different applied fields Hmeas of 100 Oe (top), 50 Oe (middle), 10 Oe (bottom) along the a-axis of the GdVO3 single crystal. The inset shows an expanded view in the temperature region below TM.
17