J. of Cardiovasc. Trans. Res. (2012) 5:366–374 DOI 10.1007/s12265-012-9353-z
Whole Blood Gene Expression Testing for Coronary Artery Disease in Nondiabetic Patients: Major Adverse Cardiovascular Events and Interventions in the PREDICT Trial Steven Rosenberg & Michael R. Elashoff & Hsiao D. Lieu & Bradley O. Brown & William E. Kraus & Robert S. Schwartz & Szilard Voros & Stephen G. Ellis & Ron Waksman & John A. McPherson & Alexandra J. Lansky & Eric J. Topol & for the PREDICT Investigators Received: 3 December 2011 / Accepted: 15 February 2012 / Published online: 7 March 2012 # The Author(s) 2012. This article is published with open access at SpringerLink.com
Abstract The majority of first-time angiography patients are without obstructive coronary artery disease (CAD). A blood gene expression score (GES) for obstructive CAD likelihood was validated in the PREDICT study, but its relation to major adverse cardiovascular events (MACE) and revascularization was not assessed. Patients (N01,160) were followed up for MACE and revascularization 1 year
post-index angiography and GES, with 1,116 completing follow-up. The 30-day event rate was 23% and a further 2.2% at 12 months. The GES was associated with MACE/ revascularizations (p15 trended towards increased >30 days MACE/revascularization likelihood (odds ratio02.59, 95% confidence interval00.89–9.14, p00.082). MACE incidence
Clinical Trial Information: PREDICT (http://www.clinicaltrials.gov), NCT 00500617 Electronic supplementary material The online version of this article (doi:10.1007/s12265-012-9353-z) contains supplementary material, which is available to authorized users. S. Rosenberg (*) : M. R. Elashoff : H. D. Lieu : B. O. Brown CardioDx, Inc., 2500 Faber Place, Palo Alto, CA 94303, USA e-mail:
[email protected] W. E. Kraus Duke Center for Living, 3475 Erwin Road, Box 3022, Room 254, Aesthetics Building, Durham, NC 27705, USA R. S. Schwartz Minneapolis Heart Institute Foundation, Abbott Northwestern Hospital, 920 East 28th Street, Suite 620, Minneapolis, MN 55407, USA S. Voros Piedmont Heart Institute, 95 Collier Road NW, Suite 2035, Atlanta, GA 30309, USA S. G. Ellis The Cleveland Clinic, 9500 Euclid Avenue, F25, Cleveland, OH 44195, USA
R. Waksman Cardiovascular Research Institute, Medstar Research Institute, Washington Hospital Center, 110 Irving Street NW, Suite 6B-5, Washington, DC 20010, USA
J. A. McPherson Vanderbilt University, 1215 21st Avenue South, MCE 5th Floor, South Tower, Nashville, TN 37232, USA
A. J. Lansky Yale University School of Medicine, Fitkin Pavilion, New Haven, CT 06520, USA
E. J. Topol Scripps Translational Science Institute, 3344 North Torrey Pines Court, La Jolla, CA 92037, USA
J. of Cardiovasc. Trans. Res. (2012) 5:366–374
overall was 1.5% (17 of 1,116) and 3 of 17 patients had GES ≤15. For the total low GES group (N0396), negative predictive value was 90% for MACE/revascularization and >99% for MACE alone, identifying a group of patients without obstructive CAD and highly unlikely to suffer MACE within 12 months. Keywords Coronary artery disease . Peripheral blood gene expression . Genomics . Angiography . Coronary interventions . MACE Abbreviations GES Gene expression score CAD Coronary artery disease MACE Major adverse cardiovascular events NPV Negative predictive value MI Myocardial infarction QCA Quantitative coronary angiography D-F Diamond–Forrester score PCI Percutaneous coronary intervention CABG Coronary artery bypass graft TIA Transient ischemia attack
Introduction Chronic coronary artery disease (CAD) and adverse cardiovascular events are the largest sources of morbidity and mortality in the developed world and are diagnosed in more than 500,000 new patients annually in the USA [1]. Obstructive CAD diagnosis is challenging as patient presentation may often be variable and atypical symptoms are common [2]. Clinical evaluation of suspected CAD often includes stress testing followed by noninvasive imaging (stress echocardiography or nuclear perfusion) and, if indicated, invasive coronary angiography. Recent studies have highlighted the relatively high radiation exposure burden in the standard CAD workup [3, 4] and have indicated that, for patients without a prior CAD diagnosis, 10% diameter
368
stenosis (DS) in vessels with diameter >1.5 mm were visually identified, and the minimal lumen diameter (MLD), reference lumen diameter (RLD0average diameter of normal segments proximal and distal of lesion), and %DS (% DS0(1−MLD/RLD)×100) were calculated. The Diamond–Forrester (D-F) risk score, comprised of age, sex, and chest pain type, was prospectively chosen to evaluate the value of the GES with clinical factors [11]. D-F classifications of chest pain type (typical angina, atypical angina, and nonanginal chest pain) were assessed using subject interviews [11] and D-F scores assigned [12]. Obstructive CAD and Disease Group Definitions Obstructive CAD (N0422) was defined prospectively as ≥1 atherosclerotic plaque in a major coronary artery (≥1.5 mm lumen diameter) causing ≥50% luminal DS by QCA; nonobstructive CAD (N0744) had no lesions >50%. Clinical Procedure and Event Determination Clinical interventions were defined as any PCI or coronary artery bypass graft (CABG). Clinical events were defined as stroke/transient ischemia attack (TIA), MI, or death. Index coronary angiography was defined as the date of planned coronary catheterization, irrespective of intervention. Coronary procedures or events occurring within 30 days of index angiography were considered baseline endpoints associated with this procedure. In addition, specifically identified staged procedures up to 45 days post-index angiography were also considered baseline endpoints. Analysis of all procedures and events was performed for the 1,160 subjects over the entire follow-up period, as well as selective analysis for patients with procedures and events beyond the 30-day threshold. All coronary procedures and events were monitored against medical records for accuracy and were supported by medical records documenting the specific event or diagnosis and/or by supporting evidence, e.g., myocardial enzyme elevation or infarct on head computed tomography (CT). Discrepancies were resolved by direct investigator query. All other events such as aortic aneurysm repair, congestive heart failure exacerbation, and cardiac arrhythmias were reviewed and eliminated due to noncardiac origin or lack of direct association with acute coronary atherosclerosis etiology. The definitions of the MACE components, MI, stroke/TIA, and all-cause mortality are detailed in the Supplementary Methods. GES Measurements GES measurements were performed in the CardioDx clinical reference laboratory (Palo Alto, CA, USA) using the
J. of Cardiovasc. Trans. Res. (2012) 5:366–374
Corus™ CAD process [9]. Briefly, RNA was purified using an automated bead-based method from PAXgene® RNA preservation tubes (PreAnalytiX, Valencia, CA, USA). Subsequent cDNA synthesis and reverse transcription polymerase chain reaction were then carried out [9]. The GES were reported on a 1–40 scale. Statistical Analysis The primary endpoint for the study was whether the GES as a continuous variable was significantly related to the combination of procedures and MACE at 30 days and 12 months following index angiography. Subjects were censored if no event occurred prior to them being lost to follow-up. Only the first endpoint of a given type (procedure or event) was counted in the analysis. Secondary analyses included the relationship of the GES to MACE across the entire follow-up period and to the combination of revascularizations and MACE occurring >30 post-index catheterization. For categorical analyses, the GES were divided into three ranges: 1–15 (80% of
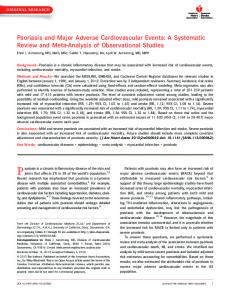
Table 4 Clinical characteristics of patients with subsequent events Patient ID
Sex
Age (years)
C002:00400185
Male
83
Control
0
15
0
31
Stroke or TIA
C003:00400346 C004:00400011
Female Female
58 73
Case Control
70 39
0 50
1 1
10 17
MIc MI
C005:00400009 C014:00400055 C015:00400040 C015:00400058 C015:00400064
Male Male Male Female Male
50 60 51 46 66
Case Case Case Control Control
100 76 57 0 15
100 90 40 0 80
1 5 3 0 0
18 29 24 2 25
CABG, MI, PCI Stroke or TIA Stroke or TIA MIe Stroke or TIA
10 566d >180d 339 321
C015:00400092 C015:00400193 C051:00400030 C058:00400054 C063:00400007 C068:00400065 C073:00400040 C073:00400065 C079:00400014
Male Female Male Male Female Male Male Male Male
49 66 63 69 76 86 73 60 78
Control Case Case Control Case Case Control Case Case
19 78 75 33 80 81 44 63 100
30 70 90 40 90 95 65 40 50
0 6 6 2 5 1 1 3 7
25 16 26 25 27 37 30 14 39
MI MI MI Death MI Stroke or TIA Stroke or TIA MI Death
>180f 129 1 >180f 177d 235d 172d 224 306
a
QCACase: Controla
QCAMax Stenosis
ClinMax Stenosis
QCANum Lesions30b
GES
Event
Prospectively defined as ≥50% maximum stenosis
b
Number of lesions >30% stenosis by QCA
c
Discrepancy between clinical and core laboratory QCA reads; QCA confirmed on subsequent independent review
d
These patients had a revascularization associated with their index catheterization
e
Likely vasospastic MI given underlying clinical condition and chart review
f
Event reported at 1 year follow-up without specific date
Days post index 328 121 259
372
J. of Cardiovasc. Trans. Res. (2012) 5:366–374
Table 5 Clinical characteristics of patients with late revascularizations Patient ID
Sex
Age (years)
QCACase: Controla
C015:00400017
Male
54.4
Case
C054:00400009
Female
70.3
Case
C015:00400060 C055:00400036
Male Female
55.5 68.3
Control Control
C068:00400058
Female
55.2
Case
C001:00400105 C015:00400177
Male Male
73.7 64.5
Case Control
C068:00400087
Male
68.1
Case
QCAMax Stenosis 60.37 100 36.43 24.2 100 60.7 43.19 100
ClinMax Stenosis
QCANum Lesions30b
Days post index
70
3
26
PCI
3
25
CABG
100 40
3 0
23 20
PCI PCI
118 345
341 75
99
8
3
PCI
347
90 50
2 2
32 26
PCI PCI
70 246
100
5
37
CABG
Prospectively defined as ≥50% maximum stenosis
b
Number of lesions >30% stenosis by QCA
c
Either PCI or CABG occurring without prior intervention associated with index catheterization
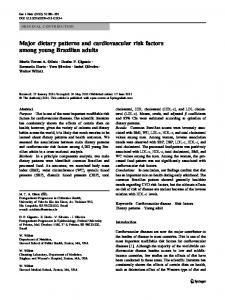
Table 6 GES components and putative biological roles
Procedurec
80
a
patients with chronic total occlusions, who were electively not intervened on, had high scores. A large recent study of patients referred for CT angiography has also shown that overall mortality risk correlated with the extent of maximum percent stenosis [14]. For the small number of patients who had events, >80% (14 of 17) had GES above the threshold of 15 (Tables 3 and 4), although this did not reach statistical significance. Retrospective analysis for the three patients with events and low GES showed one patient had no CAD angiographically with a GES of 2 and likely suffered a vasospastic MI. A second patient had no CAD by clinical angiogram, but subsequent QCA showed a 70% lesion. The third patient had a score of 14, close to the threshold, and an MI 7 months from index procedure. Thus, based upon clinical workup, 16 of 17 patients with events had scores above the threshold. Similarly, for late revascularizations, seven of eight had scores above 15. A description of the genes which comprise the GES are shown in Table 6, along with the associated biological
GES
84
functions, where known. The predominant features of these gene terms are the innate immune response, as judged by increased expression of activation genes in both neutrophils and natural killer (NK) cells, as well as an increase in proapoptotic genes (terms 1–3). In addition, term 2, and specifically S100A12, has been shown to promote coronary artery calcification in a transgenic model [15]. In addition, the somewhat counterintuitive B cell to T cell ratio comprises term 4. Although it was originally thought that B cells were atheroprotective and T cells atherogenic, recent work in mouse models has suggested a more complex picture with atherogenic B cell subsets [16] and a potential atheroprotective role for regulatory T cells [17, 18]. Given that the GES was derived to discriminate obstructive CAD, why might it have prognostic value? First, the GES is proportional to maximum percent stenosis by angiography and a recent large CT angiography study has shown that event likelihood increases with the extent of disease, even for nonobstructive disease [19]. Second, specific terms in the GES algorithm
Term
Genes
Functions
1
IL18RAP+TNFAIP6+CASP5 IL8RB+KCNE3+TLR4+TNFRSF10C S100A8+S100A12+CLEC4E RPL28 (men), NCF4+AQP9 (women)
Innate immunity, apoptosis Neutrophil activation Neutrophil activation and necrosis Calcification Neutrophil/lymphocyte ratio (men) Normalized neutrophil activation (women) Innate immunity, NK cell activation Normalized to T lymphocytes B/T cell ratio Lymphocyte subtype Unknown function genes
2
3 4 5+6
SLAMF7+KLRC4 TMC8+CD3D SPIB+CD79B TMC8+CD3D AF289562+TSPAN16 (men) TFCP2+HNRPF
J. of Cardiovasc. Trans. Res. (2012) 5:366–374
reflect cell type-specific gene expression ratios, which in the case of the neutrophil to lymphocyte ratio has been shown to have prognostic significance in a large catheterization laboratory population [20]. In addition, a very recent large study has shown that neutrophil counts alone are associated with subsequent MI and mortality [21]. Third, circulating levels of the protein products of genes which are present in the GES, such as S100A8 and S100A12, have been shown to be associated with cardiovascular events [22, 23]. Finally, the observed GES proportionality to disease burden is most likely a reflection of the dysregulation of gene expression in the circulating cells in response to both the extent and inflammatory activity of atherosclerotic plaque, perhaps reflecting plaque composition. This study had several limitations. First, the population was nondiabetic and largely symptomatic with high-risk unstable angina and low-risk asymptomatic patients excluded. Second, the follow-up period was limited and the number of events subsequent to the index catheterization small. Thus, any conclusions about the PPV of the GES for prognosis will require larger cohorts, more extended follow-up, and a higher absolute number of cumulative events. Given the observed OR for MACE in this study, we estimate that a study of 2,300 patients with 2-year follow-up would have 80% power to detect a significant relationship of the GES to MACE. The PROMISE study (http://www.clinicaltrials.gov, NCT 01174550) might be an appropriate setting to further test this hypothesis. Third, we did not have lesion-specific information to determine if revascularizations or events were due to baseline-identified lesions or disease progression. Fourth, since this was an angiographic population, it had more disease than an intended use population before referral, which may affect the results. Fifth, with respect to the GES analysis, the combined cohort may have been biased by inclusion of the algorithm development set. This seems unlikely to be a very significant factor as procedures and events were not used to derive the algorithm, and the validation subset analyses showed results indistinguishable from the entire population. Finally, while the GES added significantly to Framingham with respect to the primary composite endpoint, it did not add significantly to MACE prediction alone, although that comparison was underpowered due to the low event rate. In summary, this study examined the relationship between a peripheral blood GES measured at index angiography and revascularization and MACE at up to 12 months. Independent of the GES, more than 75% of patients had neither a procedure nor MACE in the next year. For those with low GES, representing 35% of patients, 90% were in this category. Thus, low GES appeared to identify a population at low risk for both obstructive CAD and subsequent procedures or events. While these results were encouraging
373
for a clinical correlation with the initial angiographic validation, studies in larger populations with longer-term follow-up would be needed to further support this hypothesis. Acknowledgements The authors wish to thank all the PREDICT patients who participated in this study as well as the entire PREDICT investigators group (Appendix 1) and their clinical staffs for their efforts. We particularly acknowledge the efforts of Dr. Naeem Tahirkheli during the PREDICT study enrollment. Conflict of Interest This work was funded by CardioDx, Inc.; MRE, BB, and SR are employees and have equity interests and/or stock options in CardioDx, Inc. HDL is a consultant employee at CardioDx, Inc. WEK, RSS, SV, and SGE report research support, JM reports minor consulting income, and AL reports funding for QCA studies all from CardioDx, Inc. EJT is supported in part by the Scripps Translational Science Institute Clinical Translational Science Award from the National Institutes of Health (NIHU54RR02504-01). RW reports no conflicts of interest with respect to this manuscript.
Open Access This article is distributed under the terms of the Creative Commons Attribution License which permits any use, distribution, and reproduction in any medium, provided the original author(s) and the source are credited.
Appendix 1: PREDICT Site Principal Investigators Naeem Tahirkheli, Oklahoma Cardiovascular Research Group, Oklahoma City, OK, USA; Daniel Donovan, Cardiology Clinic of San Antonio, San Antonio, TX, USA; Stanley Watkins, Alaska Heart Institute, Anchorage, AK, USA; Brian Beanblossom, Cardiovascular Associates, Louisville, KY, USA; Brent Muhlestein, Intermountain Health Care, Salt Lake City, UT, USA; Ronald Blonder, Pikes Peak Cardiology, Colorado Springs, CO, USA; Tim Fischell, Borgess Research Medical Center, Kalamazoo, MI, USA; Phillip Horwitz, University of Iowa Hospitals, Iowa City, IA, USA; Frank McGrew, The Stern Cardiovascular Center, Germantown, TN, USA; Tony Farah, Allegheny Professional Building, Pittsburgh, PA, USA; Terrance Connelly, Charlotte Heart Group Research Center, Port Charlotte, FL, USA; Cezar Staniloae, New York Cardiovascular Assoc./ Heart and Vascular Research, New York, NY, USA; Edward Kosinski, Connecticut Clinical Research, LLC, Bridgeport, CT, USA; Charles Lambert, University Community Health, Tampa, FL, USA; David Hinchman, St Luke’s Idaho Cardiology Associates, Boise, ID, USA; James Zebrack, Heart Center, Salt Lake City, UT, USA; Bruce Samuels, Cardiovascular Medical Group of Southern California, Beverly Hills, CA, USA; Matthew Budoff, Los Angeles Biomedical Research Institute at Harbor–University of California Los Angeles Medical Center, Torrance, CA, USA; Dean Kereiakes, The Lindner Clinical Trial Center, Cincinnati,
374
OH, USA; Christopher Brown, Mobile Heart Specialists, Mobile, AL, USA; Jennifer Hillstrom, Maine Cardiology, Portland, ME, USA; Donald Wood, Peninsula Cardiology Associates, Salisbury, MD, USA; Hossein Amirani, Via Christi Research, Wichita, KS,USA; Jeffrey Bruss, Hoag Heart and Vascular Institute, Newport Beach, CA, USA; Ronald Domescek, Orlando Heart Center, Orlando, FL, USA; Stephen Burstein, Los Angeles Cardiology Associates, Los Angeles, CA, USA; Mark Heckel, Carolina Heart Specialists, Gastonia, NC, USA; Barry Clemson, Heartcare Midwest SC, Peoria, IL, USA; Charles Treasure, Cardiovascular Research Foundation, Knoxville, TN, USA; Ricky Schneider, Cardiology Consultants of South Florida, Tamarac, FL, USA; Hassan Ibrahim, North Ohio Heart Center, Sandusky, OH, USA; Robert Weiss, Maine Research Associates, Auburn, ME, USA; John Eagan Jr., Office of Clinical Research, Birmingham, AL, USA; David Henderson, Cardiology Research Associates, Ormond Beach, FL, USA; Lev Khitin, Chicago Heart Institute, Elk Grove, IL, USA; and Preet Randhawa, New Jersey Heart Research, Linden, NJ, USA. References 1. Lloyd-Jones, D., Adams, R., Carnethon, M., De Simone, G., Ferguson, T. B., Flegal, K., et al. (2009). Heart disease and stroke statistics—2009 update: a report from the American Heart Association Statistics Committee and Stroke Statistics Subcommittee. Circulation, 119(3), 480–486. 2. Gibbons, R. J., Abrams, J., Chatterjee, K., Daley, J., Deedwania, P. C., Douglas, J. S., et al. (2003). ACC/AHA 2002 guideline update for the management of patients with chronic stable angina—Summary article: A report of the American College of Cardiology/American Heart Association Task Force on practice guidelines (Committee on the Management of Patients With Chronic Stable Angina). Journal of the American College of Cardiology, 41(1), 159–168. 3. Einstein, A. J., Weiner, S. D., Bernheim, A., Kulon, M., Bokhari, S., Johnson, L. L., et al. (2010). Multiple testing, cumulative radiation dose, and clinical indications in patients undergoing myocardial perfusion imaging. Journal of the American Medical Association, 304(19), 2137–2144. 4. Fazel, R., Krumholz, H. M., Wang, Y., Ross, J. S., Chen, J., Ting, H. H., et al. (2009). Exposure to low-dose ionizing radiation from medical imaging procedures. The New England Journal of Medicine, 361(9), 849–857. 5. Patel, M. R., Peterson, E. D., Dai, D., Brennan, J. M., Redberg, R. F., Anderson, H. V., et al. (2010). Low diagnostic yield of elective coronary angiography. The New England Journal of Medicine, 362 (10), 886–895. 6. Boden, W. E., O’Rourke, R. A., Teo, K. K., Hartigan, P. M., Maron, D. J., Kostuk, W. J., et al. (2007). Optimal medical therapy with or without PCI for stable coronary disease. The New England Journal of Medicine, 356(15), 1503–1516. 7. Wingrove, J. A., Daniels, S. E., Sehnert, A. J., Tingley, W., Elashoff, M. R., Rosenberg, S., et al. (2008). Correlation of peripheral-blood gene expression with the extent of coronary artery stenosis. Circulation: Cardiovascular Genetics, 1(1), 31–38. 8. Elashoff, M. R., Wingrove, J. A., Beineke, P., Daniels, S. E., Tingley, W. G., Rosenberg, S., et al. (2011). Development of a
J. of Cardiovasc. Trans. Res. (2012) 5:366–374
9.
10.
11.
12.
13. 14.
15.
16.
17.
18.
19.
20.
21.
22.
23.
blood-based gene expression algorithm for assessment of obstructive coronary artery disease in non-diabetic patients. BMC Medical Genomics, 4(1), 26. Rosenberg, S., Elashoff, M. R., Beineke, P., Daniels, S. E., Wingrove, J. A., Tingley, W. G., et al. (2010). Multicenter validation of the diagnostic accuracy of a blood-based gene expression test for assessing obstructive coronary artery disease in nondiabetic patients. Annals of Internal Medicine, 153(7), 425–434. Lansky, A. J., & Popma, J. J. (1998). Qualitative and quantitative angiography. Textbook of interventional cardiology. Philadelphia: Saunders. Diamond, G. A., & Forrester, J. S. (1979). Analysis of probability as an aid in the clinical diagnosis of coronary-artery disease. The New England Journal of Medicine, 300(24), 1350–1358. Chaitman, B. R., Bourassa, M. G., Davis, K., Rogers, W. J., Tyras, D. H., Berger, R., et al. (1981). Angiographic prevalence of highrisk coronary artery disease in patient subsets (CASS). Circulation, 64(2), 360–367. Rdc, T. (2007). R: A language and environment for statistical computing. Vienna: R Foundation for Statistical Computing. Min, J. K., Dunning, A., Lin, F. Y., Achenbach, S., Al-Mallah, M., Budoff, M. J., et al. (2011). Age- and sex-related differences in allcause mortality risk based on coronary computed tomography angiography findings results from the International Multicenter CONFIRM (Coronary CT Angiography Evaluation for Clinical Outcomes: An International Multicenter Registry) of 23,854 patients without known coronary artery disease. Journal of the American College of Cardiology, 58(8), 849–860. Hofmann Bowman, M. A., Gawdzik, J., Bukhari, U., Husain, A. N., Toth, P. T., Kim, G., et al. (2011). S100A12 in vascular smooth muscle accelerates vascular calcification in apolipoprotein E-null mice by activating an osteogenic gene regulatory program. Arteriosclerosis, Thrombosis, and Vascular Biology, 31(2), 337–344. Kyaw, T., Tay, C., Khan, A., Dumouchel, V., Cao, A., To, K., et al. (2010). Conventional B2 B cell depletion ameliorates whereas its adoptive transfer aggravates atherosclerosis. Journal of Immunology, 185(7), 4410–4419. Caligiuri, G., & Nicoletti, A. (2010). Tregs and human atherothrombotic diseases: Toward a clinical application? Arteriosclerosis, Thrombosis, and Vascular Biology, 30(9), 1679–1681. Robertson, A. K., & Hansson, G. K. (2006). T cells in atherogenesis: For better or for worse? Arteriosclerosis, Thrombosis, and Vascular Biology, 26(11), 2421–2432. Lin, F. Y., Shaw, L. J., Dunning, A. M., Labounty, T. M., Choi, J. H., Weinsaft, J. W., et al. (2011). Mortality risk in symptomatic patients with nonobstructive coronary artery disease a prospective 2-center study of 2,583 patients undergoing 64-detector row coronary computed tomographic angiography. Journal of the American College of Cardiology, 58(5), 510–519. Horne, B. D., Anderson, J. L., John, J. M., Weaver, A., Bair, T. L., Jensen, K. R., et al. (2005). Which white blood cell subtypes predict increased cardiovascular risk? Journal of the American College of Cardiology, 45(10), 1638–1643. Adamsson Eryd, S., Smith, J. G., Melander, O., Hedblad, B., & Engstrom, G. (2012). Incidence of coronary events and case fatality rate in relation to blood lymphocyte and neutrophil counts. Arteriosclerosis, Thrombosis, and Vascular Biology, 32(2), 533– 539. Averill, M. M., Kerkhoff, C., & Bornfeldt, K. E. (2011). S100A8 and S100A9 in cardiovascular biology and disease. Arteriosclerosis, Thrombosis, and Vascular Biology, 2011, 17. Shiotsu, Y., Mori, Y., Nishimura, M., Sakoda, C., Tokoro, T., Hatta, T., et al. (2011). Plasma S100A12 level is associated with cardiovascular disease in hemodialysis patients. Clinical Journal of the American Society of Nephrology, 6(4), 718–723.