Major Increase in Prevalence of Overweight and Obesity between 1987 and 2001 among Danish Adults Hanne Bendixen,* Claus Holst,† Thorkild I.A. Sørensen,† Anne Raben,* Else Marie Bartels,‡ and Arne Astrup*
Abstract BENDIXEN, HANNE, CLAUS HOLST, THORKILD I.A. SØRENSEN, ANNE RABEN, ELSE MARIE BARTELS, AND ARNE ASTRUP. Major increase in prevalence of overweight and obesity between 1987 and 2001 among Danish adults. Obes Res. 2004;12:1464 –1472. Objective: The aim of the study was to examine the secular trends in the prevalence of obesity (BMI ⱖ 30.0 kg/m2) and overweight (25.0 ⱕ BMI ⬍ 30.0 kg/m2) in Danish adults between 1987 and 2001. Research Methods and Procedures: The study included self-reported weight and height of 10,094 men and 9897 women 16 to 98 years old, collected in a series of seven independent cross-sectional surveys. Prevalence and changes in prevalence of obesity and overweight stratified by sex and age groups were determined Results: The prevalence of obesity more than doubled between 1987 and 2001, in men from 5.6% to 11.8% [odds ratio (OR) ⫽ 2.3, 95% confidence interval (CI) ⫽ 1.9 to 2.8, p ⬍ 0.0001] and in women from 5.4% to 12.5% (OR ⫽ 2.6, 95% CI ⫽ 2.1 to 3.2, p ⬍ 0.0001), with the largest increase among the 16- to 29-year-old subjects (men, from 0.8% to 7.5%, OR ⫽ 10.2, 95% CI ⫽ 4.1 to 25.3, p ⬍ 0.0001; women, from 1.4% to 9.0% OR ⫽ 7.0, 95% CI ⫽ 3.5 to 14.1, p ⬍ 0.0001). Between 1987 and 2001, the prevalence
Received for review November 22, 2002. Accepted in final form July 2, 2004. The costs of publication of this article were defrayed, in part, by the payment of page charges. This article must, therefore, be hereby marked “advertisement” in accordance with 18 U.S.C. Section 1734 solely to indicate this fact. *The Department of Human Nutrition, Centre of Advanced Food Research, The Royal Veterinary and Agricultural University, Frederksberg, Denmark; †Danish Epidemiology Science Centre, Institute of Preventive Medicine, Copenhagen University Hospital, Copenhagen, Denmark; and ‡The Danish National Library of Science and Medicine, Copenhagen, Denmark. Address correspondence to Hanne Bendixen, Novo Nordisk A/S, Krogshøjvej 51, Building 9F, DK-5880 Bagsværd, Denmark. E-mail: e-mail:
[email protected] Copyright © 2004 NAASO
1464
OBESITY RESEARCH Vol. 12 No. 9 September 2004
of overweight increased from 34% to 40% in men and from 17% to 27% in women. Discussion: The prevalence of overweight and obesity in Denmark has increased substantially between 1987 and 2001, particularly among young adults, a development that resembles that of other countries. There is clearly a need for early preventive efforts in childhood to limit the number of obesity-related complications in young adults. Key words: Denmark, secular trends, epidemiology
Introduction An increasing prevalence of obesity has been reported worldwide during the past decades in both developed (1,2) and developing (3) countries. Obesity is a disease with many serious health consequences (4,5) and large socioeconomic expenses (6). Therefore, regular monitoring of the prevalence and time trends of obesity and identification of the parameters contributing to the etiology of this disease are essential with regard to prevention and management strategies. The increased prevalence of obesity in Denmark between 1950 and 1994 has been well documented (7–10), but the development since then has not yet been established. Hence, the aim of the present study was to examine the secular trends of overweight (25.0 ⱕ BMI ⬍ 30.0 kg/m2) and obesity (BMI ⱖ 30.0 kg/m2) in Danish adults between 1987 and 2001. The data underlying these examinations were provided from self-reported weight and height from seven consecutive cross-sectional surveys.
Research Methods and Procedures Data Description To estimate the prevalence of overweight and obesity in Denmark between 1987 and 2001, we obtained data from a
Prevalence of Obesity in Danish Adults, Bendixen et al.
Table 1. Descriptive characteristics of adult Danish men (n ⫽ 10,094) and women (n ⫽ 9897) used for estimating the prevalence and time trends of overweight and obesity between 1987 and 2001 Men Year
Number
1987 1992 1994 1997 1998 2001*
2298 636 2220 630 632 3678
Age 43.5 (42.8 46.9 (45.6 43.4 (42.7 47.6 (46.4 47.9 (46.6 40.8 (40.3
to to to to to to
Women BMI
44.3) 48.2) 44.2) 48.9) 49.2) 41.2)
24.5 (24.4 24.9 (24.7 24.9 (24.8 25.2 (25.0 25.3 (25.0 25.7 (25.6
to to to to to to
Number 24.6) 25.2) 25.1) 25.5) 25.7) 25.8)
2361 617 2399 588 580 3352
Age 44.5 (43.7 48.3 (46.9 45.3 (44.5 47.9 (46.5 49.4 (48.0 39.7 (39.3
to to to to to to
BMI 45.3) 49.7) 46.0) 49.2) 50.7) 40.2)
22.8 (22.6 23.1 (22.8 23.4 (23.2 24.1 (23.8 24.3 (23.9 24.7 (24.6
to to to to to to
22.9) 23.4) 23.6) 24.4) 24.6) 24.9)
Data are given by mean and 95% CI. * Pooled data from the 2001a and 2001b surveys.
series of seven independent cross-sectional surveys conducted in Denmark in 1987 (Danish Health and Morbidity Survey), 1992 (Slimming Behavior in Denmark), 1994 (Danish Health and Morbidity Survey), 1997 (Slimming Behavior in Denmark), 1998 (Slimming Behavior in Denmark), and 2001 (2001a, Trends in Food Habits in Denmark; and 2001b, Attitudes toward Slimming Chewing Gum), respectively. In each survey, the individuals were selected on a random basis in a balanced design to ensure an equal sex distribution and stratification in geographic regions of Denmark. The surveys provided data with regard to self-reported weight, self-reported height, sex, age, and residence of the individuals. The information was obtained from self-administered questionnaires (1987, 1992, 1994, 1997, 1998, and 2001b) or from telephone interviews (2001a). The surveys from 1987 and 1994 were initiated by a mailed invitation to take part in the particular surveys, followed by a personal interview. Subsequently, individuals who agreed to participate completed a questionnaire from which the data used in the present study were obtained. The subjects participating in the surveys from 1992, 1997, and 1998 were initially interviewed by telephone, whereupon the individuals who gave consent to participate completed a questionnaire that was mailed to them. In the 2001b survey, the individuals received and completed a questionnaire using the Internet. This survey was conducted by the market research institute Zapera. The response rates were 80%, 92%, 68%, 89%, 86%, 66%, and 52% in the surveys from 1987, 1992, 1994, 1997, 1998, 2001a, and 2001b, respectively. The present study included all seven surveys and enrolled 10,094 men and 9897 women 16 to 98 years old (Table 1). Data Processing As mentioned above, some of the data samples had relatively low response rates. This may affect the data distri-
bution and stratification and, thus, their representativeness. Therefore, the distributions of weight and height were examined for each sex separately by histogram diagrams, and the distributions of age, sex, and geographic location in each survey were compared with those of the Danish population from the corresponding year (data provided from Statistics Denmark). All samples exerted similar distributions with regard to weight and height, and the sex and geographic distributions of the samples corresponded to those of the Danish population. BMI was calculated from self-reported height and weight of the individuals, and the World Health Organization classification of BMI was used: underweight, BMI ⬍ 18.5 kg/m2; normal weight, 18.5 ⱕ BMI ⬍ 25.0 kg/m2; overweight, 25.0 ⱕ BMI ⬍ 30.0 kg/m2; and obesity, BMI ⱖ 30.0 kg/m2. The age of the individuals was stratified by three groups: below 30 years (16 to 29 years), between 30 and 49 years (30 to 49 years), and from 50 years and above (50⫹ years). Statistical Analyses All statistical analyses in the study were performed using SAS software (version 8.0; SAS Institute, Cary, NC) with a significance level of p ⬍ 0.05. We used logistic regression to analyze the overall time trends of obesity. Time trends of obesity risk are reported as odds ratios (ORs),1 defined as the odds of being obese in a given year divided by the odds of being obese in a reference year (1987). The analyses were conducted on each sex separately, and we adjusted for the confounding effect of age. Likewise, time trends stratified by age groups were analyzed for each sex. In addition, we examined whether obesity risk was related to age groups by using the odds of
1
Nonstandard abbreviations: OR, odds ratio; CI, confidence interval.
OBESITY RESEARCH Vol. 12 No. 9 September 2004
1465
Prevalence of Obesity in Danish Adults, Bendixen et al.
being obese in the 16- to 29-year-old subjects as reference. Corresponding analyses were performed to examine the time trends of overweight (25.0 ⱕ BMI ⬍ 30.0 kg/m2). The surveys from 2001a and 2001b were merged in the statistical analyses.
Results The crude prevalence of overweight and obesity is given by category in percentage. Time trends of overweight and obesity risks are presented as ORs and 95% confidence intervals (CIs). Overall Prevalence and Time Trends The prevalence of obesity and the risk of being obese have increased substantially between 1987 and 2001: in women, the prevalence of obesity more than doubled between 1987 (5.4%) and 2001 (12.5%) (OR ⫽ 2.6, CI ⫽ 2.1 to 3.2) (Figure 1; Table 2). In men, the prevalence of obesity increased from 5.6% in 1987 to 11.8% in 2001 (Table 2), and the OR of being obese in 2001 was 2.3 (CI ⫽ 1.9 to 2.8) (Figure 1). In men, the prevalence of overweight increased from 34% to 40% between 1987 and 2001 (Table 2), and this development was associated with a significantly increased risk (OR ⫽ 1.3, CI ⫽ 1.2 to 1.4) (Figure 2). In women, the risk of being overweight increased significantly during all years (Figure 2), and in 2001, 27% of the adult Danish women were overweight (Table 2), which was associated with an overweight risk that was doubled in 2001 compared with 1987 (OR ⫽ 2.0, CI ⫽ 1.8 to 2.3) (Figure 2). Prevalence and Time Trends Stratified by Age Groups In both men and women, the prevalence of overweight and obesity was lowest in the youngest age group (16 to 29 years) and highest in the oldest age groups (30 to 49 years old and 50⫹ years old) (Figure 3), and belonging to the 50⫹-year-old or 30- to 49-year-old age groups was, indeed, associated with increased overweight and obesity risks compared with the 16- to 29-year-old age group (data not shown). Notably, however, obesity risk increased more rapidly in the 16- to 29- and 30- to 49-year-old age groups than in the oldest age group (Figure 4), and in 2001, substantially increased obesity risks were observed in the 16- to 29-yearold age group (men, OR ⫽ 10.2, 95% CI ⫽ 4.1 to 25.3; women, OR ⫽ 7.0, 95% CI ⫽ 3.5 to 14.1). Overweight has become far more profound among women in the two youngest age groups since 1987 (Figure 3), and this development has been associated with considerably increased risks since 1994 (Figure 5). In 2001, men in the two youngest age groups were also at increased risk of being overweight (Figure 5), whereas this was not observed in the 50⫹-year-old age group. 1466
OBESITY RESEARCH Vol. 12 No. 9 September 2004
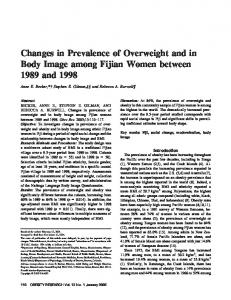
Figure 1: Age-adjusted time trends of obesity (BMI ⱖ 30.0 kg/m2) risk (given by ORs) between 1987 (reference) and 2001 in Danish men (upper panel) and women (lower panel). 95% CI is indicated by dots. p values are also evident from the figure when significant risks were found. Data from a national sample of adult Danish men (n ⫽ 10,094) and women (n ⫽ 9897).
Discussion Overall Prevalence and Time Trends The main finding of the present study is that the prevalence of obesity in Danish adults has doubled in both sexes between 1987 and 2001. Obesity was more frequent in women than in men, whereas more men than women were overweight (Table 2). These results are in accordance with population studies from other countries (11–14).
2298 636 2220 630 632 3678
NW 58.9 (1353) 54.7 (348) 54.6 (1213) 48.4 (305) 48.6 (307) 47.3 (1739)
UW
1.4 (32) 0.3 (2) 1.1 (25) 1.4 (9) 1.0 (6) 0.8 (30)
OB
34.1 (784) 5.6 (129) 37.4 (238) 7.6 (48) 36.0 (799) 8.2 (183) 41.4 (261) 8.7 (55) 42.9 (271) 7.6 (48) 40.1 (1475) 11.8 (434)
OW 39.7 (913) 45.0 (286) 44.2 (982) 50.2 (316) 50.5 (319) 51.9 (1909)
OWOB 2361 617 2399 588 580 3352
Number of observations 7.6 (180) 5.5 (34) 5.8 (138) 3.6 (21) 3.3 (19) 3.8 (127)
UW 70.3 (1659) 68.1 (420) 66.4 (1592) 61.6 (362) 60.9 (353) 56.8 (1904)
NW
OW
OB
16.7 (394) 5.4 (128) 22.5 (139) 3.9 (24) 20.9 (502) 7.0 (167) 25.5 (150) 9.4 (55) 27.2 (158) 8.6 (50) 26.9 (902) 12.5 (419)
Women
22.1 (522) 26.4 (163) 27.9 (669) 34.9 (205) 35.9 (208) 39.4 (1321)
OWOB
Data are given in percentage (number). Underweight (UW), BMI ⬍ 18.5 kg/m2; normal weight (NW), 18.5 ⬍ 25.0 kg/m2; overweight (OW), 25.0 ⱕ BMI ⬍ 30.0 kg/m2; obesity (OB), BMI ⱖ 30.0 kg/m2; overweight or obesity (OWOB), BMI ⱖ 25.0 kg/m2. * Pooled data from the 2001a and 2001b surveys.
1987 1992 1994 1997 1998 2001*
Number of Year observations
Men
Table 2. Crude prevalence of underweight, normal weight, overweight, and obesity in a national sample of adult Danish men (n ⫽ 10,094) and women (n ⫽ 9897) between 1987 and 2001
Prevalence of Obesity in Danish Adults, Bendixen et al.
Figure 2: Age-adjusted time trends of overweight (25.0 ⱕ BMI ⬍ 30.0 kg/m2) risk (given by ORs) between 1987 (reference) and 2001 in Danish men (upper panel) and women (lower panel). 95% CI indicated by dots. p values are also evident from the figure when significant risks were found. Data from a national sample of adult Danish men (n ⫽ 10,094) and women (n ⫽ 9897).
The prevalence of overweight increased substantially in both sexes between 1987 and 2001 (men, from 34% to 40%; and women, from 17% to 27%). Thus, considerably more Danish men than women are overweight. However, the present study indicates that increase in the prevalence of overweight is occurring far more rapidly in women than in men (Figure 2). This finding suggests that overweight might be as profound in women as in men in the foreseeable future. Our findings contradict the view regarding the dietary and exercise habits of the Scandinavian population that
OBESITY RESEARCH Vol. 12 No. 9 September 2004
1467
Prevalence of Obesity in Danish Adults, Bendixen et al.
Figure 3: The prevalence of obesity (BMI ⱖ 30.0 kg/m2) (left panel) and overweight (25.0 ⱕ BMI ⬍ 30.0 kg/m2) (right panel) between 1987 and 2001 among three age groups in men (upper panel) and women (lower panel). Data from a national sample of adult Danish men (n ⫽ 10,094) and women (n ⫽ 9897).
Figure 4: Time trends of obesity (BMI ⱖ 30.0 kg/m2) risk (given by ORs) stratified by age groups in Danish men (upper panel) and women (lower panel) between 1987 (reference) and 2001. 95% CI is indicated by dots. p values are also evident from the figure when significant risks were found. Data from a national sample of adult Danish men (n ⫽ 10,094) and women (n ⫽ 9897).
1468
OBESITY RESEARCH Vol. 12 No. 9 September 2004
Prevalence of Obesity in Danish Adults, Bendixen et al.
Figure 5: Time trends of overweight (25 ⱕ BMI ⬍ 30.0 kg/m2) risk (given by ORs) stratified by age groups in Danish men (upper panel) and women (lower panel) between 1987 (reference) and 2001. 95% CI is indicated by dots. p values are also evident from the figure when significant risks were found. Data from a national sample of adult Danish men (n ⫽ 10,094) and women (n ⫽ 9897).
often are regarded as being protective of obesity. For instance, the dietary fat consumption in Denmark has decreased from a median value of 43% of total energy in 1985 to 37% of total energy in 1995 (15). Nevertheless, the positive effect this might exert on body weight regulation has likely been counteracted by an increased intake of sugared beverages (16) and a decreased level of physical activity over the past 2 decades (17,18). Furthermore, the prevalence of obesity has been low in the Scandinavian countries as compared with countries elsewhere in the world. This view, however, is now contradicted by our results that show a dramatic increase in overweight and obesity in Denmark between 1987 and 2001. Prevalence and Time Trends Stratified by Age Groups In both sexes, the prevalence of overweight and obesity increased in all age groups over the years. In accordance with findings from other countries (19,20), the prevalence of obesity increased with increasing age: individuals from 50 years old and above were more likely to be obese than individuals in the two younger age groups, and individuals between 30 and 49 years old were more likely to be obese than those between 16 and 29 years. When considering the time trends of obesity in each age group, however, we found a far more increased obesity risk in women between 16 and 29 years old in 2001 than in the older age groups. This was also observed in men in 1992, 1994, and 2001. Also, we observed that the risk of being overweight increased significantly in women belonging to this age group in all years
under investigation, suggesting that the increasing prevalence of obesity in 16- to 29-year-old women is likely to continue. In addition, overweight became more prevalent over the years among the 30- to 49-year-old age group, particularly in women, whereas the development appeared to be less profound among the 50⫹-year-old age group. The increasing prevalence of overweight and obesity in the younger age groups is consistent with findings from other studies reporting a major global increase in prevalence of obesity in children and adolescents (21–25), and a similar development is emerging in Danish children (26,27). Concomitantly, obesity comorbidities such as type 2 diabetes (28,29) and hypertension (30) are now more frequently observed in children and adolescents. In addition to these adverse health effects, childhood obesity is known to be associated with great psycho-social problems (31,32) that are likely to continue into adulthood (33). Finally, the high prevalence of overweight and obesity in the elderly needs attention because the risk of developing obesity-related comorbidities increases substantially with increasing grades of obesity (5,34,35). In addition, aging itself is important because obesity-related comorbidities, such as type 2 diabetes, are more likely to emerge when overweight or obesity has been present for some time. Methodological Considerations Estimating Obesity Prevalence from BMI Calculated from Self-Reported Weight and Height. The best assessment of true BMI in a population is achieved from measured OBESITY RESEARCH Vol. 12 No. 9 September 2004
1469
Prevalence of Obesity in Danish Adults, Bendixen et al.
height and weight of the individuals done by an independent, skilled observer. However, as is the case in the present study, the prevalence and time trends of obesity estimated from BMI in population surveys are often calculated from self-reported height and weight data. A large body of evidence has shown that the prevalence of obesity based on such data may be biased because misreporting of true weight and height is quite prevalent. The majority of these studies have found an overall tendency of individuals to underreport their true weight (36 –39), whereas height is often overreported when compared with measured height (36 – 40). Furthermore, some of these studies have shown that particularly tall persons underestimate their height (41,42), whereas shorter subjects overestimate their height (41,42). Heavy subjects are more likely to underreport their weight (39,41– 43), whereas the opposite is true in lean individuals (39,41,42). Finally, the validity of self-reported height and weight may vary with sex (36,38,42), BMI status (36,37,39,40,43,44), age (36,37,39,40,43– 45), and socioeconomic status (36,37), although discrepancies from some of these findings can also be found in the literature (46,47). We obtained similar findings in another study where we compared the prevalence of obesity estimated from selfreported weight and height with that calculated from measured weight and height from 448 Danish men and women (H. Bendixen, C. Holst, T.I.A. Sørensen, A. Raben, E.M. Bartels, A. Astrup, unpublished data), and we found that women, in particular, misreport their true weight and height. Hence, the true prevalence of overweight and obesity has unquestionably been underestimated in the present study because BMI has been estimated from self-reported values of weight and height. Response Rates. The response rates were relatively large in the surveys from 1992, 1997, and 1998 compared with the other surveys included in our investigations. This is probably due to the simpler data collection procedure used in the surveys from 1992, 1997, and 1998 and to the many fewer questions in these questionnaires (six questions) compared with those from 1987 and 1994 (60 questions). Finally, it is known that response rates in studies of this kind show a decreasing time trend (48), and this may explain the relatively low response rates in the 2001 surveys. However, as outlined above, all samples used in the present study exerted similar distributions with regard to weight and height. Furthermore, the sex and geographic distributions of each sample corresponded to those of the Danish population. Hence, the samples were representative of the Danish population distribution. Data Collection Procedure. The data used in the present study were collected by interviews and mail questionnaires. It is likely that the nonresponse rate is higher in obese than in nonobese subjects, as found in a previous analysis of the participation rate in a health examination (49). If this applies to interviews and mail questionnaires as well, then the 1470
OBESITY RESEARCH Vol. 12 No. 9 September 2004
overall prevalence of obesity is underestimated. This obesity-related nonresponse could have changed over time and, thereby, contributed to the observed change in prevalence, but it is unlikely that it itself could have produced the observed increase. 2001 Surveys. The 2001b survey was conducted by the Market Research Institute Zapera using the Internet, whereas the 2001a survey was a telephone interview. Population surveys performed using the Internet have emerged rapidly during recent years, and the interest in using this method is evident, due to the widespread use of the Internet: in 2002, 70% of the Danish population had access to the Internet, and this figure is increasing rapidly. Data collections by Zapera are performed by an initial registration of 25,000 persons consenting to participate in one of Zapera’s population surveys. From this panel, a representative sample of the Danish population is randomly selected to receive a questionnaire for a particular study. Thus, this procedure ensures a representative distribution and stratification with regard to sex and geographic regions of Denmark, and our data processing procedures indicated that this, indeed, was the case. Both 2001 surveys indicated an increasing prevalence of obesity in men, whereas in women, the two surveys indicated different trends. Recent data, however, confirm the increasing prevalence of obesity in women since 1998: a population survey from 2000 (50) based on self-reported height and weight data from ⬎4000 Danish adults indicated that 10% of the men and 9% of the women were obese in the year 2000. Furthermore, the Institute of Market and Opinion Analyses (Sonar) conducted a population survey, representative of the adult Danish population in January 2003. These data show that the prevalence of obesity estimated from self-reported weight and height was 10% in women (G. Sehested-Larsen, Sonar, personal communication). Thus, taken together, these recent data indicate an increasing prevalence of obesity between 1998 and 2003 in women, and we believe that the increase found from the 2001b data in the present study is indicative of the existing trend in Denmark in 2001. This is further supported by the larger sample size of this survey (6063 individuals) compared with that of the 2001a survey (967 individuals). The decrease found in women in the 2001a study may be related to a more prevalent refusal among overweight women to participate in a health survey concerning food habits, i.e., an obesityrelated nonresponse bias. Conclusions and Perspectives Substantially increased prevalence and risk of obesity and overweight among Danish adults between 1987 and 2001 have been demonstrated in the present study. This development is particularly evident in women. In addition, we observed a dramatic increase in younger adults. This finding indicates that the serious health and psychosocial problems associated with obesity are likely to emerge also
Prevalence of Obesity in Danish Adults, Bendixen et al.
in Danish children and young adults. Our investigations indicate that public health strategies have been insufficient to slow down the increase in obesity prevalence and emphasize that much greater preventive efforts are needed already in childhood to influence the development. These initiatives have to be assisted by continued monitoring of obesity prevalence both in adults and in children.
Acknowledgments We thank Anja Weirsøe Dynesen (Danish Nutrition Council, Søborg, Denmark), Gunnar Sehested Larsen (The Institute of Market and Opinion Analyses, Sonar, Hørsholm, Denmark), Ulrik Boesen (Jyllandsposten, Copenhagen, Denmark), Jesper Kruse (Fertin Pharma, Vejle, Denmark), and Inge Lissau (The National Institute of Public Health, Copenhagen, Denmark) who provided the data used in this study. We are grateful to Christina Cuthbertson, Frederiksberg, Denmark, for her excellent secretarial assistance. The Danish National Research Foundation supports the Danish Epidemiology Science Centre. References 1. Mokdad AH, Ford ES, Bowman BA, et al. Prevalence of obesity, diabetes, and obesity-related health risk factors, 2001. JAMA. 2003;289:76 –9. 2. Visscher TL, Kromhout D, Seidell JC. Long-term and recent time trends in the prevalence of obesity among Dutch men and women. Int J Obes Relat Metab Disord. 2002;26: 1218 –24. 3. Monteiro CA, D’A Benicio MH, Conde WL, Popkin BM. Shifting obesity trends in Brazil. Eur J Clin Nutr. 2000;54: 342– 6. 4. Fontaine KR, Redden DT, Wang C, Westfall AO, Allison DB. Years of life lost due to obesity. JAMA. 2003;289:187– 93. 5. Willett WC, Dietz WH, Colditz GA. Guidelines for healthy weight. N Engl J Med. 1999;341:427–34. 6. Thompson D, Wolf AM. The medical-care cost burden of obesity. Obes Rev. 2001;2:189 –97. 7. Sonne-Holm S, Sorensen TI. Post-war course of the prevalence of extreme overweight among Danish young men. J Chronic Dis. 1977;30:351– 8. 8. Sorensen HT, Sabroe S, Gillman M, et al. Continued increase in prevalence of obesity in Danish young men. Int J Obes. 1997;21:712– 4. 9. Sorensen TI, Price RA. Secular trends in body mass index among Danish young men. Int J Obes. 1990;14:411–9. 10. Heitmann BL. Ten-year trends in overweight and obesity among Danish men and women aged 30-60 years. Int J Obes Relat Metab Disord. 2000;24:1347–52. 11. Popkin BM, Doak CM. The obesity epidemic is a worldwide phenomenon. Nutr Rev. 1998;56:106 –14. 12. Seidell JC, Flegal KM. Assessing obesity: classification and epidemiology. Br Med Bull. 1997;53:238 –52. 13. Flegal KM, Carroll MD, Kuczmarski RJ, Johnson CL. Overweight and obesity in the United States: prevalence and trends, 1960-1994. Int J Obes Relat Metab Disord. 1998;22: 39 – 47.
14. Torrance GM, Hooper MD, Reeder BA. Trends in overweight and obesity among adults in Canada (1970-1992): evidence from national surveys using measured height and weight. Int J Obes Relat Metab Disord. 2002;26:797– 804. 15. Haraldsdottir J. Dietary guidelines and patterns of intake in Denmark. Br J Nutr. 1999;2(Suppl 81):S43– 8. 16. Raben A, Vasilaras TH, Moller AC, Astrup A. Sucrose compared with artificial sweeteners: different effects on ad libitum food intake and body weight after 10 wk of supplementation in overweight subjects. Am J Clin Nutr. 2002;76: 721–9. 17. Gerdes LU, Bronnum-Hansen H, Osler M, Madsen M, Jorgensen T, Schroll M. Trends in lifestyle coronary risk factors in the Danish MONICA population 1982-1992. Public Health. 2002;116:81– 8. 18. Matthiessen J, Andersen NL, Ovesen LF. The significance of diet and physical activity for the development of obesity in Denmark from 1985 to 1995. Ugeskr Laeger. 2001;163: 2941–5. 19. Kuskowska-Wolk A, Rossner S. Body mass distribution of a representative adult population in Sweden. Diabetes Res Clin Pract.1990;10(Suppl 1):S37– 41. 20. Kuczmarski RJ, Flegal KM, Campbell SM, Johnson CL. Increasing prevalence of overweight among US adults: the National Health and Nutrition Examination Surveys, 1960 to 1991. JAMA. 1994;272:205–11. 21. Tremblay MS, Katzmarzyk PT, Willms JD. Temporal trends in overweight and obesity in Canada, 1981-1996. Int J Obes Relat Metab Disord. 2002;26:538 – 43. 22. Kautiainen S, Rimpela A, Vikat A, Virtanen SM. Secular trends in overweight and obesity among Finnish adolescents in 1977-1999. Int J Obes Relat Metab Disord. 2002;26:544 –52. 23. Wang Y, Monteiro C, Popkin BM. Trends of obesity and underweight in older children and adolescents in the United States, Brazil, China, and Russia. Am J Clin Nutr. 2002;75: 971–7. 24. Strauss RS, Pollack HA. Epidemic increase in childhood overweight, 1986-1998. JAMA. 2001;286:2845– 8. 25. Chinn S, Rona RJ. Prevalence and trends in overweight and obesity in three cross sectional studies of British Children, 1974-94. BMJ. 2001;322:24 – 6. 26. Engbaek S, Foldspang A. Epidemiology of obesity among school children: I. Prevalence. Ugeskr Laeger. 1980;142: 1704 –7. 27. Thomsen BL, Ekstrom CT, Sorensen TI. Development of the obesity epidemic in Denmark: cohort, time and age effects among boys born 1930-1975. Int J Obes Relat Metab Disord. 1999;23:693–701. 28. Rosenbloom AL, Joe JR, Young RS, Winter WE. Emerging epidemic of type 2 diabetes in youth. Diabetes Care. 1999; 22:345–54. 29. Dabelea D, Pettitt DJ, Jones KL, Arslanian SA. Type 2 diabetes mellitus in minority children and adolescents: an emerging problem. Endocrinol Metab Clin North Am. 1999; 28:709 –29. 30. Sorof J, Daniels S. Obesity hypertension in children: a problem of epidemic proportions. Hypertension. 2002;40:441–7. OBESITY RESEARCH Vol. 12 No. 9 September 2004
1471
Prevalence of Obesity in Danish Adults, Bendixen et al.
31. Schwimmer JB, Burwinkle TM, Varni JW. Health-related quality of life of severely obese children and adolescents. JAMA. 2003;289:1813–9. 32. Dietz WH. Health consequences of obesity in youth: childhood predictors of adult disease. Pediatrics. 1998;101:518 –25. 33. Gortmaker SL, Must A, Perrin JM, Sobol AM, Dietz WH. Social and economic consequences of overweight in adolescence and young adulthood. N Engl J Med. 1993;329:1008 –12. 34. Huang Z, Willett WC, Manson JE, et al. Body weight, weight change, and risk for hypertension in women. Ann Intern Med. 1998;128:81– 8. 35. Must A, Spadano J, Coakley EH, Field AE, Colditz G, Dietz WH. The disease burden associated with overweight and obesity. JAMA. 1999;282:1523–9. 36. Niedhammer I, Bugel I, Bonenfant S, Goldberg M, Leclerc A. Validity of self-reported weight and height in the French GAZEL cohort. Int J Obes Relat Metab Disord. 2000;24:1111– 8. 37. Bostrom G, Diderichsen F. Socioeconomic differentials in misclassification of height, weight and body mass index based on questionnaire data. Int J Epidemiol. 1997;26:860 – 6. 38. Millar WJ. Distribution of body weight and height: comparison of estimates based on self-reported and observed measures. J Epidemiol Community Health. 1986;40:319 –23. 39. Kuskowska-Wolk A, Karlsson P, Stolt M, Rossner S. The predictive validity of body mass index based on self-reported weight and height. Int J Obes. 1989;13:441–53. 40. Roberts RJ. Can self-reported data accurately describe the prevalence of overweight? Public Health. 1995;109:275– 84. 41. Kuskowska-Wolk A, Bergstrom R, Bostrom G. Relationship between questionnaire data and medical records of height, weight and body mass index. Int J Obes Relat Metab Disord. 1992;16:1–9.
1472
OBESITY RESEARCH Vol. 12 No. 9 September 2004
42. Schlichting P, Hoilund-Carlsen PF, Quaade F. Comparison of self-reported height and weight with controlled height and weight in women and men. Int J Obes. 1981;5:67–76. 43. Jalkanen L, Tuomilehto J, Tanskanen A, Puska P. Accuracy of self-reported body weight compared to measured body weight: a population survey. Scand J Soc Med. 1987;15: 191– 8. 44. Rowland ML. Self-reported weight and height. Am J Clin Nutr. 1990;52:1125–33. 45. Kuczmarski MF, Kuczmarski RJ, Najjar M. Effects of age on validity of self-reported height, weight, and body mass index: findings from the Third National Health and Nutrition Examination Survey, 1988-1994. J Am Diet Assoc. 2001;101: 28 –34. 46. DelPrete LR, Caldwell M, English C, Banspach SW, Lefebvre C. Self-reported and measured weights and heights of participants in community-based weight loss programs. J Am Diet Assoc. 1992;92:1483– 6. 47. Stunkard AJ, Albaum JM. The accuracy of self-reported weights. Am J Clin Nutr. 1981;34:1593–9. 48. Richelsen B, Astrup A, Hansen GL, et al. [Den danske fedmeepidemi. Oplæg til en forebyggelsesindsats]. Rosendahl, 2002. 49. Sonne-Holm S, Sorensen TI, Jensen G, Schnohr P. Influence of fatness, intelligence, education and sociodemographic factors on response rate in a health survey. J Epidemiol Community Health. 1989;43:369 –74. 50. Kjøller M, Rasmussen NK. The Danish Health and Morbidity Survey in Denmark 2000 and the Development Since 1987. Copenhagen, Denmark: The National Institute of Public Health; 2002.