Making networks fit for renewables ⦠.... CC/GT. -10/-20%. +2.5%/. +5%. 30/50. RT: 10/20%. No new. DG: -50% ... and used for method illustration purposes.
Transmission Planning Under Uncertainty: A Two‐Stage Stochastic Modelling Approach g pp Harry van der Weijde EPRG University of Cambridge EPRG, University of Cambridge
& Benjamin F. Hobbs j EPRG, Johns Hopkins University, & California ISO YEEES Cambridge 09 04 10 YEEES, Cambridge, 09.04.10 Making networks fit for renewables … www.eprg.group.cam.ac.uk
Outline • • • •
Basic questions g Modeling framework Assumptions Results – Robust plans – Value of information – Cost of naiveté – Option value
Making networks fit for renewables … www.eprg.group.cam.ac.uk
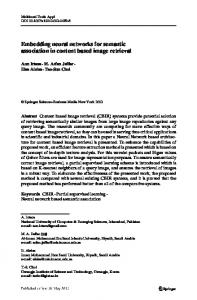
Plan transmission, but consider market response! market response! Stakeholders
Regulator
• A “multilevel” (Stackelberg) game: – Upper Upper level: level: planners (& regulator, planners (& regulator, stakeholders), who anticipate reactions of … – Lower level: Lower level: market response of market response of consumers, generators
Transmission Planner
Gen 2 Gen 1
Gen 3
M k t Market
Emissions & Renewables Markets
Demand-Side Planning
Gen 4
System Operation
Consumers
• Account for responses: – P Price effects on gen type and siting i ff t t d iti decisions – Influence of policy on above
• Account for uncertainties: – Want robust plans that do well under a range of possible futures g p
Making networks fit for renewables … www.eprg.group.cam.ac.uk
Basic questions • Optimal strategy under multiple scenarios? Optimal strategy under multiple scenarios? • Solve stochastic two‐stage model: “OPT”
• Value of perfect information (EVPI)? • Optimize separately for each scenario s: “PIs” • Compare cost of PIs vs OPT, averaged over scenarios
• Cost of ignoring uncertainty (ECIU)? C t fi i t i t (ECIU)? • Solve naïve model (no uncertainty): “NAÏVE” • Compare cost of NAÏVE vs Compare cost of NAÏVE vs OPT averaged over scenarios averaged over scenarios
• Option value? • Solve model assuming no options later: “OPENLOOP” • Compare cost of OPENLOOP vs OPT
Deterministic planning can’t answer these! Making networks fit for renewables … www.eprg.group.cam.ac.uk
Modelling framework • Two‐stage Stackelberg game: g gg 1. TSOs decide on transmission investment 2. Generators decide on generation investment 3 Decisions are implemented; Market operation 3. Decisions are implemented; Market operation 4. Repeat 1‐3
Making networks fit for renewables … www.eprg.group.cam.ac.uk
Modelling framework • If objectives are aligned: 1. Decisions on transmission+generation investment 2. Decisions are implemented; Market operation 3. Repeat 1‐2 p
• Our approach: – two stage stochastic programming – Mixed integer program (0‐1 transmission variables) g p g Making networks fit for renewables … www.eprg.group.cam.ac.uk
Modelling framework Scenarios Period 1 Period 1
2010 {z, Δx}
z Δx y
Period 2 Period 2
2020 {z, Δx, y}
Period 3 Period 3
2030 {y}
transmission investment decisions decisions to build new generation capacity ggeneration dispatch p Making networks fit for renewables … www.eprg.group.cam.ac.uk
Modelling framework: Two stage optimization Two stage optimization • Objective: MIN InvestCost2010 + Σs Ps (InvestCost2020,s + O&MCost + Σ + O&MCost2020+2030,s) • Subject to constraints: – Build limits for 2010 and each s in 2020: Build limits for 2010 and each s in 2020: • Transmission • Regional gen capacity
– Operating constraints for each s in 2020 & 2030: O ti t i t f h i 2020 & 2030 • Capacity constraints upon gen & flows • Kirchhoff’s laws for power flow • Renewable target
• ~ 0.5M variables, constraints – Coefficients, constraints can vary by s Coefficients constraints can vary by s Making networks fit for renewables … www.eprg.group.cam.ac.uk
Assumptions I ‐ Structural • Alignment of transmission & gen objectives • Generation: G ti – linear cost functions – no start‐up costs, min run levels, no start up costs min run levels ‘lumpy’ lumpy investment investment
• Transmission: constant flow limits • Demand: – constant regional fractions – no demand response p
• Renewables targets: met in most efficient way g • Storage Making networks fit for renewables … www.eprg.group.cam.ac.uk
Assumptions II ‐ Numerical • Wind data from Neuhoff et al. (2006) ( ) – One year of wind output in each region
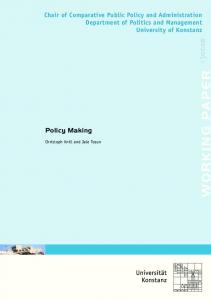
• Transmission Transmission constraints from National Grid constraints from National Grid • Existing capacity and demand data from DECC • Transmission investment alternatives from f ENSG • Sampling Making networks fit for renewables … www.eprg.group.cam.ac.uk
Assumptions II ‐ Numerical Regions and Transmission investment alternatives Various new// upgrades £260M
SCO
Subsea HVDC £575M UNO
Subsea HVDC £575M
NOR MID
Various new/ upgrades £410M
CEN SWE
Making networks fit for renewables … www.eprg.group.cam.ac.uk
Onshore HVDC £410M EST
Assumptions II – Numerical Scenarios Investment Fuel cost cost t
Trans. C t Cost
Demand
CO2 price i
Other
15/15
No Renewables target
30/50
RT: 10/20%
Status
CC/GT/DG:
+2.5%/
Quo
+30/+80%
+5%
CC/GT
+2.5%/
‐10/‐20%
+5%
Low cost DG
DG ‐50%
No new
DG: ‐50% Low Cost Renewables CC/GT/DG Large Large ‐40% +60/+160 Scale Green
nuclear ‐20%/ ‐ 30%
Making networks fit for renewables … www.eprg.group.cam.ac.uk
50/80
RT: 20/30%
Assumptions II – Numerical Scenarios Investment Fuel cost cost Low Cost Conven‐ CC/GT/DG: Conven‐ tional ‐10/‐20% 10/ 20% ti tional l ‐30% 30%
Trans. Cost
Paralysis
CO2 price
Other
+20%/
20/25
No RT
30/50
RT: 10/20%; No new nuclear
/ 30/50
20/30% /
+40%
All except
CC/GT/DG:
offshore ff h
+30/+80% /
Onshore +20%/ +100% Others +40% +20%
CC/GT/DG: / /
All ‐20% ll
wind +100% Techno+ h
Demand
All ‐30% ll
+30/+80%
+10%// +20%
Making networks fit for renewables … www.eprg.group.cam.ac.uk
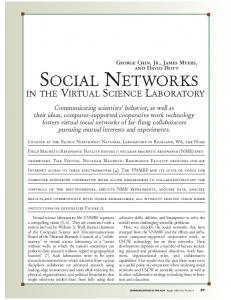
Results 1. Optimal robust solution Optimal robust solution – Two‐stage stochastic model
2. Value of Information (EVPI) – Deterministic model (best trans & gen solution for each scenario) Æ EVPIT&G – Deterministic model with generation decisions fixed Æ Deterministic model with generation decisions fixed Æ EVPITrans (lower bound)
3. Cost of naïve decision (ECIU) – Stochastic model, imposing naïve 1st stage transmission decisions Æ ECIUTrans
4 Option value of transmission 4. Option value of transmission – Stochastic with same transmission decision in every scenario p Æ Option value Trans Making networks fit for renewables … www.eprg.group.cam.ac.uk
Disclaimer The following results are (very) preliminary and used for method illustration purposes only. They cannot be used to evaluate proposed transmission investments.
Making networks fit for renewables … www.eprg.group.cam.ac.uk
Stochastic model – stage 1 Onshore wind
CC
2010 SCO
Offshore Off h wind Nuclear
GT UNO NOR
DG
MID
Biomass
CEN SWE
Making networks fit for renewables … www.eprg.group.cam.ac.uk
EST
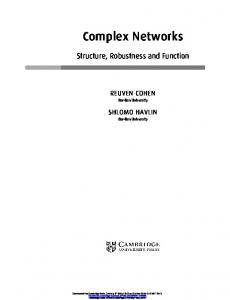
Stochastic model – stage 2 Scenarios: Low Cost DG; Paralysis
2020
2020 SCO
SCO
UNO NOR
NOR
MID
MID
CEN SWE
UNO
CEN
EST SWE
Making networks fit for renewables … www.eprg.group.cam.ac.uk
EST
What if you had perfect foresight? Low Cost Large Scale Green, stages 1 & 2
2020
2010 SCO
SCO
UNO
UNO
NOR
NOR
MID
MID
CEN
CEN
EST
SWE
SWE
Making networks fit for renewables … www.eprg.group.cam.ac.uk
EST
Value of Perfect Information • Total EVPI = TC stoch − ∑π TC s = £7,182M (7.37% of TCstoch ) • EVPI when generators do in the 1 EVPI when generators do in the 1st stage what stage what they did in the stochastic model = £10M (0.01%) £10M (0 01%) = lower bound on EVPITrans s
s determ
Making networks fit for renewables … www.eprg.group.cam.ac.uk
What if you think you have perfect foresight?
2010
SCO
E.g., Paralysis imposed stage 1 stage 1
UNO NOR MID CEN
EST
SWE
Making networks fit for renewables … www.eprg.group.cam.ac.uk
Cost of Naïve Decisions: ECIUTrans Impose p Status Quo
£261M
0.27%
Impose Low Cost DG
£261M
0.27%
Impose Low Cost Large Scale Green £ 79M
0 08% 0.08%
Impose Low Cost Conventional
£261M
0.27%
Impose Paralysis
£ 36M
0.04%
Impose Techno+ Average
£ 36M
0.04%
£156M
0.16%
Comparable to 1st stage Transmission Investments Making networks fit for renewables … www.eprg.group.cam.ac.uk
What if there is no optionality? Same Stage 2 Transmission Investments in all scenarios
2010 SCO
UNO NOR MID CEN
EST
SWE
Making networks fit for renewables … www.eprg.group.cam.ac.uk
Option Value (Transmission) = Increase in cost when eliminate optionality p y = £117M (0.12%)
Making networks fit for renewables … www.eprg.group.cam.ac.uk
Conclusions • Main insights g – Ignoring risk has quantifiable economic consequences q – Option values can be significant – Approach useful for policy/planning questions pp p y/p gq
• Future work – Revisit assumptions Revisit assumptions – Bi‐level formulation Making networks fit for renewables … www.eprg.group.cam.ac.uk