Sporer, S. L. (2012). Making the subjective objective? Computer-assisted quantification of qualitative content cues to deception. In In E. Fitzpatrick, J. Bachenko, & T. Fornaciari (Eds.), Proceedings of the Workshop on Computational Approaches to Deception Detection (pp. 7885). Stroudsberg, PA: Association for Computational Linguistics.
Making the Subjective Objective? Computer-Assisted Quantification of Qualitative Content Cues to Deception Siegfried L. Sporer Department of Psychology and Sports Science University of Giessen, Germany
[email protected]
Abstract
Introduction
Research syntheses suggest that verbal content cues are more diagnostic than other cues in discriminating between truth and deception. In many studies on content cues, raters are trained to rate the presence of specific content cues, an inherently subjective process. This necessitates to demonstrate inter-coder reliability first. Depending on the statistical coefficient used, establishing adequate inter-rater reliabilities for these subjective judgments often creates a problem. To address some of these problems, a new method for coding these content cues with a computer program developed for qualitative research, MaxQDA (www.maxqda.de), is proprosed. The application of the program is demonstrated using the Aberdeen Report Judgment Scales (ARJS; Sporer, 2004) with a set of 72 deceptive and true accounts of a driving examination. Data on different types of inter-coder reliabilities are presented and implications for future research with computer-assisted qualitative coding procedures as well as training of coders are outlined.
Human judges are often only slightly better than chance at discriminating between truths and lies (Bond, & DePaulo, 2006). Likewise, a recent meta-analysis of training programs designed to teach lie detection has shown only small to medium effect sizes in improving judges' detection accuracy (e.g., Hauch, Sporer, Michael, & Meissner, 2010). This meta-analysis has also shown that training effects are larger when the content of messages are considered than when only relying on nonverbal or paraverbal cues. In a series of studies, Reinhard, Sporer, Scharmach, and Marksteiner (2011) further demonstrated that paying attention to verbal content cues improved lie detection accuracy compared to participants who relied on heuristic nonverbal cues. Therefore, particular attention should be paid to find valid content cues to detect deception (DePaulo, Lindsay, Malone, Muhlenbruck, Charlton, & Cooper, 2003; Sporer, 2004; Vrij, 2008). Most of the research to date has relied on Criteria-based Content Analysis (CBCA; Steller & Koehnken, 1989; for a review, see Vrij, 2005) or reality monitoring approaches (e.g., Sporer, 1997; for reviews, see Masip, Sporer, Garrido, & Herrero, 2005; Sporer, 2004). Usually, a small set of raters is trained more or less extensively with these content criteria to apply them to transcripts of oral accounts. Due to the subjective nature of these codings, establishing inter-coder reliability of any such coding system is a necessary prerequisite for its validity (Anson, Golding, & Gully, 1993).
Credits This research has been supported by a grant from the German Science Foundation (Deutsche Forschungsgemeinschaft (DFG): Sp262/3-2) to the present author. The author would like to thank Edda Niederstadt and Nina F. Petermann for the coding of the data, and to Jaume Masip, Valerie Hauch, and Sarah Treiber for comments on an earlier version of this manuscript.
1.1
The Problem of Inter-Coder Reliability
Whenever content cues are to be coded from transcripts, raters usually assign a binary code (0/1) regarding the presence of a certain criterion to the whole account. Alternatively, coders rate the extent of the presence of a criterion on some scale (0/1/2; 0-4; 1-7), which is usually treated as
78 Proceedings of the EACL 2012 Workshop on Computational Approaches to Deception Detection, pages 78–85, c Avignon, France, April 23 - 27 2012. �2012 Association for Computational Linguistics
a Likert type scale and analyzed statistically as if it were an interval-scale measurement. Using frequency counts of criteria. Other researchers have raters count the frequencies of occurrences of a given criterion and use this as a dependent variable, similarly treating it as an interval-scale measurement. In other words, not the overall presence vs. absence in an account is coded, but specific instances of occurrencies of a given criterion throughout a text corpus are noted which are subsequently added up. One problem with this method is that the resulting distributions may be skewed which will obfuscate the use of Pearson's r as a measure of inter-rater agreement. Therefore, in case of skewness, Spearman rho may be a preferred method for ordinal-scale data. Another potential problem with the frequency count method is that the frequency of occurrence of a given criterion depends on the length of a given account (i.e., the number of words it contains). To the extent to which true accounts are likely to be longer than deceptive accounts (e.g., Colwell, HiscockAnisman, Memon, Taylor, & Prewett, 2007; but see the meta-analyses by DePaulo et al., 2003; Sporer & Schwandt, 2006), using frequency counts may yield erroneous conclusions. For example, if longer accounts contain more details, which are considered as an indicator of truthfulness, merely counting the number of details may be an artefact of story length. To our knowledge, in most studies the length of the accounts (i.e., the number of words) has not been considered in the resulting statistical analyses although standardizing frequencies per minute (or per 100 words) appears to be a common procedure when investigating nonverbal and paraverbal cues; see DePaulo et al., 2003; Sporer & Schwandt, 2006, 2007; for a noteworthy exception see Granhag, Stroemwall, & Olsson, 2001). Binary coding of criteria. Some authors dichotomize the obtained frequency distributions via a median-split, resulting in a binary judgment regarding the presence/absence of a given criterion for the whole account (e.g., Vrij, Akehurst, Soukara, & Bull, 2004). For binary judgments, percentage agreement is usually reported as a measure of inter-coder reliability, yielding usually quite high levels of agreement, which in turn are interpreted as being highly satisfactory (see Vrij, 2005, 2008). However, it has long been known that percentage agreement is a problematic measure of inter-rater reliability because it does not correct for chance agreement
(Cohen, 1960, 1973; Rosenthal, 1995; Shrout & Fleiss, 1974; Wirtz & Caspar, 2002). Here, Cohen's (1960) kappa would be preferable. In addition, phi should be reported to make results more comparable with other studies' reporting of reliabilty coefficients like Pearson r for continuous ratings. Reliability of coding of specific occurrencies. A problem inherent to frequency counts is the fact that even though two raters may have agreed upon the presence of some criterion (e.g., "Unusual detail") in a given account, this agreement may or may not refer to the same factual aspect of a statement. Thus, different segments of a transcript may be assigned a specific code by different raters. This begs the question regarding the segment length and the semantic boundaries of a given cue in this text corpus. A given cue may occur at a specific location in a given text corpus, which has to be marked by a coder. Hence, it is possible that raters may not agree on the specific text passage where a criterion occurs although they may both conclude that a given criterion is present in an account. To my knowledge, this issue has never even been addressed in the literature on deception of detection (except for a German legal dissertation that illustrated this problem with a case of perjury in the Appendix; Bender, 1987). Thus, in practically all empirical studies to date, interrater reliability for any given content cue is only established for each account as a whole--not for specific text passages. This is where computer programs developed for qualitative research can be useful. For example, the program MAXQDA (see below) allows different coders to mark specific text passages in a text corpus (either words, phrases, sentences or longer passages) and assign a given code, which is shown at the margin. Different codes for different criteria, as well as codes from different raters, can be entered in different colors which allows comparisons between raters. This way, reliability can be established not only across accounts but for any single account. Adding up occurrences of a given criterion. When raters code the presence of certain criteria rater in a given account, and researchers subsequently add up the frequencies for this account, another problem arises. For example, rater A may observe the occurrence of a given criterion in sentence 1, 3, 5, 7, and 9, while rater B observes this criterion in sentences 2, 4, 6, 8, and 10 in the same account. For each rater, 5
79
occurences will be noted. This may lead to an illusion of perfect agreement, as both raters report an agreement of 5 occurrences for this account, even though they did not actually agree in a single instance. Again, computerized coding as demonstrated here could help to detect such problems. Here, we only report overall agreement as in previous studies across accounts, not separately for each account as suggested in this example, which would be very tedious for a large number of accounts.
1.2
report and subsequently were randomly assigned to one of two question types in the following interview. During the interview, participants answered either a series of W-questions (Who? What? Where? etc.; cf., Camparo, Wagner, & Saywitz, 2001) or questions that specifically asked for information typically used to evaluate the presence of content criteria of credibility. Importantly, the interviewer was blind with respect to truth status. To enhance participants' motivation they were promised 5 Euros (in addition to the participation fee of 8 Euros) if their account was judged to be truthful by the experimenter at the end of the interview.
Goal of the Present Study
These issues will be addressed in the present study. Using the computer program MaxQDA (www.maxqda.de) which was developed for qualitative research in the social sciences, accounts of true and fabricated experiences were coded by two independent raters with respect to specific occurrences of the Aberdeen Report Judgment Scales criteria (ARJS; Sporer, 2004) at specific text passages. In the following, the adaptation of MaxQDA applied to these content criteria is demonstrated and results for different reliability coefficients are presented.
1.5
All interviews were both video- and audiotaped, and transcripts were typed from audiotapes according to specified transcription rules. The transcripts were coded by two independent raters who were blind with respect to the truth status of the accounts.
1.6
Design
In a 2 x 2 x 2 factorial design, truth status (experienced vs. deceptive) and format of questions (W-questions vs. Content-criteria questions) were manipulated as between-, and report form (free report vs. subsequent interview) as within-participants factor. Questions varied only during the interview.
1.4
Computer-based Coding
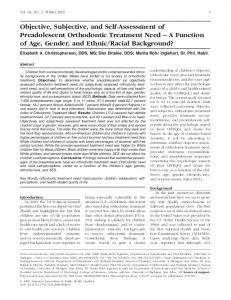
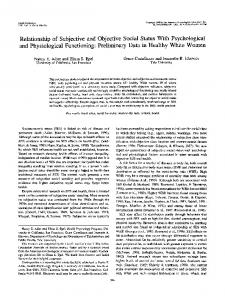
In the following, we explain the different menus of the program and explain step by step the coding procedure. 1. Accounts are entered into MaxQDA as Microsoft Word *.rtf files (in a newer version of the program, *.doc files can also be used). 2. A list of codes is entered into MaxQDA using short labels which later can be used as variable labels in Excel spreadsheets or in SPSS analyses. Figure 1 lists codes to be assigned to text passages. New codes can be added via a context menu. 3. Codes are assigned to specific text passages by highlighting a passage in the text browser and then assigning a specific code (see Figure 2). More than one code can be assigned to a specific code, and the codes assigned are visible in the margin of the text window.
Method 1.3
Stimulus Material and Coding
Participants and Procedure
Young adults (N = 72; 36 male, 36 female) between 17 and 45 years of age (Mdn = 18 years; mostly high school students) were asked to provide a convincing story of their driving test for obtaining their driver's license, which they either had recently passed (true condition), or which was immediately ahead of them (deceptive condition). Participants first provided a free
80
Figure 1. Menu of list of codes to be assigned to text passages. New codes can be added via a context menu.
Figure 2. Assigning a specific code to a selected text passage.
81
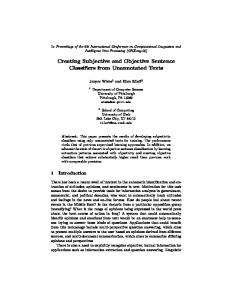
Figure 3. Codes and frequencies of codes assigned to a given text. Codes can be viewed separately per rater as indicated by the context menu.
Figure 4. Relative frequencies of codes in different accounts (stories). Size of symbols represents relative frequencies.
82
4. The frequencies of codes assigned can be listed for all raters together, or separately for different raters. This feature is particularly useful for comparing ratings of specific passages (see Figure 3). 5. An overview of the relative frequencies of all variables coded in different accounts can also be obtained in the Matrix Browser (see Figure 4). The size of symbols corresponds to the relative frequencies in each account (story). 6. Data can be exported as Excel files, which in turn can be imported into statistical programs directly or as ASCII files. All codes assigned by the two raters for each account were exported into SPSS and different types of reliability coefficients were computed. Table 1 displays means (and SDs) of all accounts as well as the inter-coder reliabities (percentage agreement, Cohen's kappa for binary coding after a Median split, Spearman rho, Pearson's r, and two types of intra-class correlation coefficients [ICC]; see McGraw & Wong, 1996; Orwin & Vevea, 2009; Shrout & Fleiss, 1974; Wirtz & Caspar, 2002).
Contradictions", which resulted in a 2 x 2 Table (see Table 1). Both raters agreed on 66 nonoccurrences. Furthermore, rater A found some implausible details in 3 accounts, and rater B found Implausible Details in 3 other accounts, totalling in 6 disagreements. In other words, they really did not agree at all on the occurrence of these types of details. Nonetheless, this resulted in a percentage agreement of 91.7%--which most authors would consider quite impressive.
In contrast, using Cohen's kappa, which corrects for chance agreement, resulted in kappa = -.04, that is, no agreement at all. Other coefficients similarly showed very low inter-coder reliabilities for this variable. This discrepancy makes it clear that asymmetric marginal distributions as shown in Table 1, that is, scales with either floor or ceiling effects, are likely to render divergent results for different types of reliability coefficients. Thus, none of the coefficients should be interpreted in isolation. We recommend always to calculate other supplementary coefficients in addition to percentage agreement for comparison. Table 2 displays the different types of reliabilities for this and the remaining variables. In line 2, the coefficients for the interview condition (W-questions) are inserted for comparison which appear somewhat higher. This is likely to have resulted from the higher baserate. Some of the differences between the Spearman rho and Pearson r coefficients may be a function of the skewness of the underlying frequency distributions of the two raters. We recommend always to examine the scatter plots before
Results and Discussion All codes assigned by the two raters for each account were exported into SPSS and different types of reliability coefficients were computed. Table 1 displays means (and SDs) of all accounts as well as the inter-coder reliabilities (percentage agreement, Cohen's kappa for binary coding after a Median split, Spearman rho, Pearson's r, and two types of intra-class correlation coefficients [ICC]; see McGraw & Wong, 1996; Orwin & Vevea, 2009; Shrout & Fleiss, 1974; Wirtz & Caspar, 2002). Most noteworthy, for "Implausible Details and Contradictions", which showed a very low baserate, percentage agreement was very high, whereas all other coefficients suggest that reliability for this scale is very poor. How can we explain this discrepancy? Here, 2 raters coded all 72 accounts regarding the presence of "Implausible Details and
83
Table 2 Base Rates of Raw Frequencies and Reliability Coefficients of ARJS Criteria Corrected for the Number of Words ARJS Scales M SD PA kappa rho r ICC-s Implausible Elements and Contradictions (a) 0.05 0.17 91.7 -.04 -.04 -.04 .00 Implausible Elements and Contradictions (b) 0.09 0.23 91.7 .36 .40 .76 .76 Clarity and vividness 0.74 1.18 75.0 .49 .68 .68 .59 Details 3.29 2.65 65.3 .31 .57 .45 .30 Spatial Details 0.39 0.65 100.0 1.00 .63 .67 .65 Time Details 1.26 1.53 97.2 .94 .95 .93 .92 Sensory Impressions 0.26 0.48 94.4 .85 .86 .83 .83 Emotions and Feelings 3.01 2.43 87.5 .75 .87 .82 .79 Thoughts 1.08 1.58 72.2 .45 .52 .68 .67 Memory Processes and Rehearsal 0.42 0.63 72.2 .37 .44 .47 .34 Nonverbal and Verbal Interactions 1.64 1.77 79.2 .58 .73 .66 .60 Complications/Unusual details 0.38 0.54 72.2 .31 .35 .41 .40 Errors and Lack of Social Desirability 1.58 1.58 70.8 .42 .58 .63 .63 Personal Significance 0.54 0.73 66.7 .30 .35 .35 .29 Mean (a) 80.3 .65 .64 .59 Mean (b) 80.3 .67 .68 .64 Mean (without Implausible Elements) 79.8 .68 .67 .63 Note. (a) Free report; (b) After "W"-questions. ICC-s = single measure ICC ICC-av = average measure ICC
employing Pearson's r, and, in case of outliers, to use Spearman's rho or Kendall's tau instead. The intra-class coefficient ICC has the additional advantage that it also takes systematic differences between raters into account (i.e., when one rater gives generally higher ratings than another). ICCs can also be calculated for more than two raters. When two (or more raters) rate all accounts, the ICC-av provides an estimate of inter-coder reliability for a given study which is higher than that for single raters (analogously to the Spearman-Brown formula in testing theory; Rosenthal, 1995). Different types of ICCs are available depending on how many coders rated either all or only portions of the accounts (see Orwin & Vevea, 2009; Shrout & Fleiss, 1974; Winer, 1971; Wirtz & Caspar, 2002). In conclusion, this study demonstrated that it seems well worth to use a computer-assisted coding system. A particular value of this system may also lie in the possibility to train raters where a supervisor can point out agreements and discrepancies in specific accounts to further improve inter-rater agreement. Specific discrepancies can also be resolved by two or more coders by comparing the color codes in a MAXQDA file. Such a procedure with this or similar computer programs should improve interrater reliabilities of any type of verbal content cues to deception.
ICC-av .00 .86 .74 .46 .79 .96 .91 .88 .80 .50 .75 .57 .77 .45 .73 .77 .77
References Anson, D. A., Golding, S. L., & Gully, K. J. (1993). Child sexual abuse allegation: Reliability of criteria-based content analysis. Law and Human Behavior, 17, 331-341. Bender, H. (1987). Merkmalskombinationen in Aussagen [Criteria combinations in statements]. Tuebingen: J. C. B. Mohr. Bond, C. F., & DePaulo, B. M. (2006). Accuracy of deception judgments. Personality and Social Psychology Review, 10, 214-234. Camparo, L. B., Wagner, J. T., & Saywitz, K. J. (2001). Interviewing children about real and fictitious events: Revisiting the narrative elaboration procedure. Law and Human Behavior, 25, 63-80. Colwell, K., Hiscock-Anisman, C. K., Memon, A., Taylor, L., & Prewett, J. (2007). Assessment Criteria Indicative of Deception (ACID): An Integrated System of Investigative Interviewing and Detecting Deception. Journal of Investigative Psychology and Offender Profiling, 4, 167-180. DePaulo, B. M., Lindsay, J. J., Malone, B. E., Muhlenbruck, L., Charlton, K., & Cooper, H. (2003). Cues to deception. Psychological Bulletin, 129, 74-118. Granhag, P. A., Stroemwall, L., & Olsson, C. (2001, June). Fact or fiction? Adults' ability to assess children's veracity. Paper presented at the 11th European Conference on Psychology and Law in Lisbon, Portugal. Hauch, V., Sporer, S. L., Michael, S. W., & Meissner, C. A. (2010, June). Does training improve detection of deception? A meta-analysis. Paper
84
presented at the 20th Conference of the European Association of Psychology and Law, Gothenburg, Sweden.
Vrij, A. (2008). Detecting lies and deceit: Pitfalls and opportunities. Chichester, England: Wiley. Vrij, A., Akehurst, L., Soukara, S., & Bull, R. (2004). Let me inform you how to tell a convincing story: CBCA and Reality Monitoring scores as a function of age, coaching and deception. Canadian Journal of Behavioral Science, 36, 113-126.
Masip, J., Bethencourt, M., Lucas, G., Sánchez-San Segundo, M., & Herrero, C. (2011). Deception detection from written accounts. Scandinavian Journal of Psychology. DOI: 10.1111/j.14679450.2011.00931.x
Winer, B. J. (1971). Statistical principles in experimental design. New York: McGraw-Hill.
Masip, J., Sporer, S. L., Garrido, E., & Herrero, C. (2005). The detection of deception with the reality monitoring approach: A review of the empirical evidence. Psychology, Crime, and Law, 11, 99122.
Wirtz, M., & Caspar, F. (2002). Beurteilerübereinstimmung und Beurteilerreliabilität [Interrater agreement and inter-rater reliability]. Göttingen: Hogrefe.
McGraw, K. O., & Wong, S. P. (1996). Forming inferences about some intraclass correlations coefficients. Psychological Methods, 1, 31-43. Newman, M. L., Pennebaker, J. W., Berry, D. S., & Richards, J. M. (2003). Lying words: Predicting deception from linguistic styles. Personality and Social Psychology Bulletin, 29, 665–675. Orwin, R. G., & Vevea, J. L. (2009). Evaluating coding decisions. In H. Cooper, L. V., Hedges, & J. C. Valentine (Eds.), The handbook of research synthesis and meta-analysis (2nd ed., pp. 177-203). New York, NY: Russell Sage Foundation. Reinhard, M. A., Sporer, S. L., Scharmach, M., & Marksteiner, T. (2011, June 27). Listening, not watching: Situational familiarity and the ability to detect deception. Journal of Personality and Social Psychology. Advance online publication. doi: 10.1037/a0023726 Rosenthal, R. (1995). Methodology. In A. Tesser (Ed.), Advanced social psychology (pp. 17-49). New York: McGraw-Hill. Sporer, S. L. (1997). The less traveled road to truth: Verbal cues in deception detection in accounts of fabricated and self-experienced events. Applied Cognitive Psychology, 11, 373-397. Sporer, S. L. (2004). Reality monitoring and the detection of deception. In P.-A. Granhag & L. Stromwall (Eds.), Deception detection in forensic contexts (pp. 64-102). Cambridge University Press. Sporer, S. L., & Schwandt, B. (2006). Paraverbal indicators of deception: A meta-analytic synthesis. Applied Cognitive Psychology, 20, 421 - 446. Sporer, S. L., & Schwandt, B. (2007). Moderators of nonverbal indicators of deception: A meta-analytic synthesis. Psychology, Public Policy, and Law, 13, 1-34. Vrij, A. (2005). Criteria-Based Content Analysis. A qualitative review of the first 37 studies. Psychology, Public Policy, and Law, 11, 3-41.
85