Received: September 17, 2018
22
Mammography Images Segmentation via Fuzzy C-mean and K-mean Mohammed Y. Kamil 1*
Ali Mohammed Salih 1
1
College of Sciences, Mustansiriyah University, Baghdad, Iraq * Corresponding author’s Email:
[email protected]
Abstract: Breast Cancer is one of the common and dangerous among women at the age of forty, so it is better for woman to have mammography testing as a significant step for the early detection of breast cancer and is diagnosis for treatment; There is an important need to an algorithm is used to determine the boundaries of the tumor in a finite accuracy. In this work, two algorithms were built depending on clustering approach as segmentation method. In the first algorithm has employed (K-mean) method, whilst in the second algorithm has employed fuzzy c-mean method (FCM). In both, the lazy snapping algorithm was used as an additional step to improve the segmentation performance of the detection of abnormal area. The proposed methods have been tested using mini-MIAS database, after assessment the results obtained. it indicates the accuracy of segmentation first algorithm, are 91.18% and accuracy of second algorithm is 94.12%. from results, it concludes that the proposed second algorithm is capable of estimate breast abnormal region boundary at high accuracy because it used fuzzy logic technique. Keywords: Segmentation, FCM, K-mean, Clustering, Mammography
1. Introduction Breast cancer is one of the commonest sort of disease adding to the expansion in mortality between ladies around the world. Recent insights show that breast cancer affect one of every eight in the United States and one of every ten ladies in Europe [1]. Computer aided detection (CAD) framework is an apparatus which backing the specialists by specify the anomalous districts and reduction the oversight mistake. CAD system framework for breast cancer examinations the attributes of various kinds of breast anomalies by means of utilizing different image modalities like mammography, ultrasound [2], magnetic resonance imaging and so forth [3]. Early discovery important affects the successful therapy of disease, once medical therapy ends and becomes harder in late stages. A standout amongst the best procedures for breast cancer investigation is mammography [4, 5]. Nonetheless, mammography investigation and visual comprehension can be a hard errand even to an radiologist, once such a technique can be influenced by image quality viewpoints, tumor shape, and radiologist experience
[6]. Amid this period, breast imaging is basic, both for early discovery and tumor checking. Tumor volume plays a demon part in the arranging of breast cancer therapy, abstaining from mutilating surgeries, like mastectomy [7]. Moreover, image investigation and diagnosis are unpredictable, for the most part in view of vast fluctuation of cases so for this CAD has been assuming an import part to help radiologist and other related health proficient is enhancing the precision of their determination [8]. The volume of the segmented tumor is a determinant factor in mammogram diagnosis. It is exceptionally identified with the harm of the tumor where a distinction of only a few of centimeters in the most extreme measurement can decide if is important to complete a surgery or not. It can be an exceptionally hard to identify contour of the tumor precisely relying upon a various factor, like size, tumor shape, location, density and general image quality [9]. As of late, there have been various studies for boundary identification in mammography. R. S. C. Boss, et al.[10] proposed mammogram image division utilizing Fuzzy C-Means clustering algorithm. Median filter is utilized for pre-preparing of image. It is typically used to lessen clamor in an image. The 14
International Journal of Intelligent Engineering and Systems, Vol.12, No.1, 2019
DOI: 10.22266/ijies2019.0228.03
Received: September 17, 2018
Haralick highlights are extracted from mammogram image utilizing Gray Level Co-occurrence Matrix (GLCM) for various angles. The features are set by FCM and K-Means algorithms with a specific end goal to portion the region of interests for facilitate classification. Z.-z. Han, et al., [11] is proposed in this paper. Initial, a mathematical model (MM) of the mass is displayed to recognize the location of mass. Second, in light of the time arrangement features created by Pulse Coupled Neural Network (PCNN), the pixels are ordered by Fuzzy C-Means clustering. To test the unwavering quality and legitimacy of the algorithm, (59) illustrations are arbitrarily chosen from the Mammographic Image Analysis Society (MIAS) database. The experimental outcomes demonstrate that mass identified by this method is accurate reached 98.82%. L. Vivona, et al., [12] introduced a conceivably intense microcalcifications cluster improvement strategy relevant to mammograms. The division stage utilizes a form filter, got from LoG filter, to overcome the reliance from target measurements and to streamline the acknowledgment effectiveness. A clustering method, in light of a Fuzzy C-means, has been produced. This technique has been tried on an arrangement of image from the mini-Mammographic database gave by (MIAS) openly accessible. Accomplished accuracy 94%. A. Elmoufidi, K. El Fahssi, et al. [13] shows a strategy for segment and distinguishes the limit of various breast tissue districts in mammograms by utilizing Seed Based Region Growing (SBRG) method and dynamic K-means clustering algorithm. G. K. Kanungo, et al. [14] to diminish false outcomes, image segmented is carried out for discover breast cancer mass. Image segmentation utilizing Fuzzy clustering: FCM, K means, and FPCM demonstrates result superior to other existing methods but sensitivity to noise don't improve them to accomplish exactness. S. Gu, et al. [15] proposed an automatic breast mass division technique in view of generalized hierarchical Fuzzy C Means (GHFCM) and patch merging method. The division execution from experimentations shows that our methods outflanks the other looked at methods. Touil and K. Kalti, [16] proposed another region-based method to appropriately portion breast and background regions in mammographic images. These locales are assessed by an Iterative Fuzzy Breast Segmentation method (IFBS). In view of the Fuzzy C-Means (FCM) algorithm, IFBS method iteratively increases the exactness of at first extricated breast region. R. M. Prakash, et al. [17] proposed three segmentation mehtods, Fuzzy C-Means (FCM) , K-Means and Gaussian Mixture Model - Expectation Maximization (GMMEM) are utilized to portion the IR breast
23
pictures and compared. C. L. Chowdhary and D. Acharjya, [18] proposed a novel intuitionistic possibilistic Fuzzy C Means algorithm. Intuitionistic FCM and possibilistic FCM are hybridized to conquer the issues of FCM. The analyses result in high exactness with clustering and breast cancer identification.
2. Methods 2.1 Fuzzy c-means method
The (FCM) algorithm is a fuzzy clustering technique in view of the minimization of a quadratic paradigm where clusters are represented to via their separate centers. The FCM algorithm was proposed by Dunn in 1973 and improved by Bezdek [19] in 1981. For a group of C information patterns 𝑋 = {𝑥1 , 𝑥2 , ⋯ , 𝑥𝑁 } the algorithm permits to segment the information space, by figuring the centers of classes and the membership matrix, furthermore, by limiting an objective function 𝐽 regarding these focuses and membership degrees as takes after: 𝑁
𝐶
𝑚 𝐽 = ∑ ∑ 𝜇𝑖𝑘 ‖𝑥𝑖 − 𝑐𝑗 ‖
2
(1)
𝑖=1 𝑗=1
J is the objective function. After one iteration of the algorithm the estimation of J is littler than previously. It implies the algorithm is joining or drawing nearer to a decent division of pixels into groups. C is the number of clusters utilized as a part of the algorithm, and must be chosen before execution, N is the quantity of pixels in the image, is the membership table – a table of N×C sections which contains the membership estimations of every datum point and 𝑚 every cluster [20]. 𝜇𝑖𝑘 is the degree of membership of xi in the cluster j , m is a fuzziness factor (an esteem greater than 1), xi is the ith pixel in N, cj is jth cluster in C and difference between (xi - cj) is the Euclidean distance amongst xi and cj [21]. 2.2 K-means method
K-means is one of the easiest unsupervised learning algorithms that tackle the outstanding clustering issue. K-means clustering algorithm is a straightforward clustering technique. K-means methods this approach begins by setting K centroid set regions randomly or in view of some heuristic [22]. At that point, we allocate every pixel to a cluster with the closest centroid, we move from there on every centroid to the mean of the pixels allotted to it. The algorithm proceeds until the point
International Journal of Intelligent Engineering and Systems, Vol.12, No.1, 2019
DOI: 10.22266/ijies2019.0228.03
Received: September 17, 2018
24
when no pixels change cluster membership. we describe an algorithm which accentuates through two activities at first is to expect the gathering centers are known, and assign each point to the cluster center and second is to acknowledge the distribution is known, and pick another course of action of cluster centers. Each center is the mean of the concentrations assigned to that gathering. K-means algorithm is simple. Be that as it may, the execution relies upon the firstly places of the centroids. 𝑘
4. Results and discussion First Algorithm has been proposed to detect the breast abnormal areas; the proposed algorithms were applied on an image taken from mini-MIAS. In this item; the results - obtained after applying the proposed algorithms of three different images in terms of the case position, shape and size - will be shown; three images of three different results have been selected in terms of accuracy of high, medium and low degree.
𝑛
𝐹 = ∑ ∑‖𝑥𝑖 − 𝑐𝑗 ‖
2
(2)
𝑗=1 𝑖=1
where F is a picked distance measure between an data point 𝑥𝑖 and the cluster center cj , is a pointer of the separation of the n data point from their particular cluster centers [23, 24].
3. Proposed algorithm 1. Input raw image from data set (mini MIAS database). 2. Pre-processing image to extract breast profile region only. By using convert image to binary image and using morphological operation. 3. Either using k-means algorithm (for the First Algorithm) by select the number of clusters (=6) and the number of Iteration (≤100) for clustering region. OR using Fuzzy c-means algorithm (for the Second Algorithm) for clustering region by select the number of clusters (=6) and maximum number of Iteration (=100). 4. Save data for final cluster centers, initial random cluster centroids, difference between centroid and their members and objective function values for each iteration. 5. Using Lazy Snapping algorithm to Segment image and determine the abnormal region. 6. Save the result image after apply the step (5) 7. Load the ground truth which labelling from an experienced radiologist. 8. Comparison between the output in step (6) and ground truth for abnormal region in step (7). 9. And draw boundaries of regions on the original image. 10. evaluate the accuracy of segmentation by similarity coefficient for image segmentation. Also computing of measure properties of abnormal image region.
4.1 Results of first algorithm
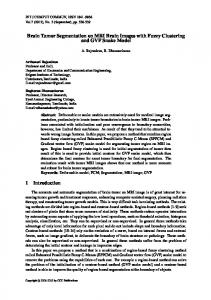
Fig. 1 refers to the results of the good statistics accountably and visually in comparison with the other selected images, after inserting the original image and do pre-processing to it and disposing of noise shown on the image, which affects the results significantly. Fig. 2 represents the image (mdb178) which is a different sample in terms of tumor nature. We can note that the final result of algorithm gets slightly farther from the area diagnosed by the doctor (DSI = 0.66), i.e. the matching between the proposed algorithm and the diagnosed area by the doctor is of medium rate, this is due to the nature of the tumor at the breast, which is speculated masses.
(a)
(b)
(c) (d) Figure.1 Results: (a) original image mdb271, (b) preprocessing, (c) segmentation by first algorithm, and (d) comparison between first algorithm and G.T
International Journal of Intelligent Engineering and Systems, Vol.12, No.1, 2019
DOI: 10.22266/ijies2019.0228.03
Received: September 17, 2018
(a)
25
(b)
(c) (d) Figure.2 Results: (a) original image mdb178, (b) preprocessing, (c) segmentation by first algorithm, and (d) comparison between first algorithm and G.T
(a)
(b)
(c) (d) Figure. 4 Results: (a) original image mdb271, (b) preprocessing, (c) segmentation by second algorithm, and (d) comparison between second algorithm and G.T
difficult to recognize the outline of surrounded. In this case, the algorithm therefore resulted in failure to locate the disease. 4.2 Results of second algorithm
(a)
(b)
(c) (d) Figure.3 Results: (a) original image mdb256 (b) preprocessing (d) segmentation by first algorithm (c) comparison between first algorithm and G.T
Fig. 3 represents the results of low-accuracy stats (DSI = 0.05), the image (mdb256) shows that the proposed algorithm could not position the tumor as well as sizing the tumor was bad, this is because the tumor in breast region is calcification, which is shattered in the analyzed images so that it was
In this section, we are going to show the results that obtained after applying second algorithm on which fuzzy logic based. Fig. 4 stands for the results of image (mdb271) of high statistics as shown in first algorithm. In this algorithm, the regions of the original image are divided into six regions recognized by different colors. The matching values between the expected limits and the original limits are very high (DSI = 0.919). So, the proportion is a better then first algorithm, but the overlap between tumor limits with the limits medically diagnosed on the original tumor limits are very high of second algorithm (sensitivity = 0.993) in comparison with the first algorithm (sensitivity = 0.988). Fig. 5 represents the medium statistics of the proposed second algorithm. Tumor at the image (mdb178) is different in terms of position, shape and size in comparison with the other images, as the results obtained are of medium successful rate (DSI=0.671), (sensitivity = 0.597), i.e. the final result of the proposed algorithm is larger than the original tumor.
International Journal of Intelligent Engineering and Systems, Vol.12, No.1, 2019
DOI: 10.22266/ijies2019.0228.03
Received: September 17, 2018
(a)
26
(b)
(c) (d) Figure. 5 Results: (a) original image mdb178, (b) preprocessing, (c) segmentation by second algorithm, and (d) comparison between second algorithm and G.T
(a)
(b)
(c) (d) Figure. 6 results: (a) original image mdb271, (b) preprocessing, (c) segmentation by second algorithm, and (d) comparison between second algorithm and G.T
Fig. 6 stands for the third sample which has the disease. We can see that image (mdb256) is very bad; this is due to the quality of the disease which takes form as calcifications but not a specific form of tumor; it is difficult to segmented such calcifications, as the match result of final is second algorithm (DSI=0.248), which is better than that of first
Table 1. Measurements (CDR, DSI, Sensitivity, Miss Rate) for both algorithms FCM Image CDR DSI Sensitivity Miss Rate 8% mdb271 0.850297 0.919093 0.993927 32% mdb178 0.505744 0.671753 0.579088 75% mdb256 0.142182 0.248966 0.537757 KM Image CDR DSI Sensitivity Miss Rate 9% mdb271 0.829936 0.907066 0.988866 33% mdb178 0.492546 0.660008 0.576408 94% mdb256 0.027316 0.053179 0.629291 Table 2. Region properties for first algorithm (K-mean) and second algorithm (FCM) FCM Image distance Area diameter Axis 1.932 0.020 1.010 0.122 mdb271 29.596 0.168 0.911 0.894 mdb178 49.829 5.507 2.550 0.450 mdb256 KM Image distance Area diameter Axis 3.040 0.072 1.035 0.135 mdb271 31.769 0.139 0.927 0.979 mdb178 72.332 6.023 2.650 0.073 mdb256
algorithm. Table 1 shows the statistics that help assess the boundaries of the disease. A set of statistics has been applied to evaluate the work of the proposed algorithms arithmetically and estimate the tumor detection rate and compare them with the images of low, medium and high results. The images we obtained show that some algorithms may yield good results in determining tumor boundaries, but the position of the tumor and the shape does not match the position and the real shape diagnosed by the radiologist. Therefore, other statistics were used to calculate the number of region properties that includes both the ground truth and the final segmentation of each of the algorithms used in this work. These properties give more facts about the segmentation of tumors, in terms of shape and position of infection, as shown in Table 2. It is “distance” between the diagnosed region by doctor and the final result of the proposed algorithm, it is noted that the values - obtained from the highresult images - greatly match at the tumor location (not more than several pixels), i.e. the closer the values come to zero, the more the match will be, unlike the other images at which the diagnosis got farther from the tumor center. In regards to “Area” we can see that there is a match between the diagnosed tumor area and the final result of algorithm,
International Journal of Intelligent Engineering and Systems, Vol.12, No.1, 2019
DOI: 10.22266/ijies2019.0228.03
Received: September 17, 2018
i.e. the closer the value comes to zero, the more the match in area will be between the two diagnosed tumor areas and the proposed algorithm. When the other characteristic “diameter” comes close to one, it means that the diagnosed region and the final result have closer diameter. In other words, when the diameter is < 1, it means that the final result of the proposed algorithm will be larger than the medically diagnosed area, but when it is > 1, the medically diagnosed area will be larger than the final result the proposed algorithm. It is the last characteristic “Axis” which stands for the large axis and the length of the small axis of the two diagnosed areas and the area shown when algorithm applied. When the result comes closer to zero, it is shown that the resulting area is spherical just like that of the area diagnosed by the doctor, i.e. there is a match in the shape between the two areas. Having compared the results, shapes and table with each other, it is shown that the second algorithm is better than first algorithm in locating the tumor and calcifications; this is due to fuzzy logic that helps improve the areas segmentation. The algorithms proposed will be compared with previous studies to fully evaluate the performance of the proposed algorithms, where the comparison was made on the measure of accuracy. We compared the studies using the MIAS database only (work scope). It should be noted that it is difficult to compare directly because of some of authors used visual assessment of the radiologist to evaluate their methods. Also, the discrepancy in used data sets (e.g., number of images), and types of assessment measurements. Table 3 shows the performance comparison of segmentation methods in MIAS dataset images for previous studies. From Fig. 7, we can see that energy of the proposed first algorithm of K-mean stops at the value 12 of image (mdb178) and (mdb256), while the image (mdb271) stops at the value 37. Fig. 8 shows the energy of each image at FCM of second algorithm, so we can see that the frequency reaches (100) but the actual effect is limited between (15-17) which explains that second algorithm action lasts longer than that of first algorithm, but the accuracy in breaking down the second algorithm is better than what first algorithm gives as shown in the results of Tables 1 and 2. The algorithms proposed will be compared with previous studies to fully evaluate the performance of the proposed algorithms, where the comparison was made on the measure of accuracy. We compared the studies using the MIAS database only (work scope). It should be noted that it is difficult to compare directly because of some of authors used visual
27
Figure. 7 The relation between energy and K-mean frequency of first algorithm of the three images
Figure. 8 The relation between energy and frequency at FCM of second algorithm of the three images Table 3. Performance comparison of segmentation methods in MIAS Dataset images Segmentation Dataset Authors accuracy based on used Z.-z. Han et MIAS 98.82% FCM al.[11] (59) images L. Vivona, MIAS 94% FCM et al.[12] (20) images G. K. 63% K-means Kanungo et MIAS 73% FCM al.[14] A. Touil et MIAS 93% FCM al.[16] (200) images
assessment of the radiologist to evaluate their methods. Also, the discrepancy in used data sets (e.g., number of images), and types of assessment measurements. Table 3 shows the performance comparison of segmentation methods in MIAS dataset images for previous studies. In this work, the results of first algorithm (based on K-mean) showed that the accuracy is 91.18%, while the results accuracy of second algorithm (based on FCM) reached 94.12%. The observer to Table 3 seems to notice that there are high resolution results, but these results were for a specified number of images and not for all dataset image. The strength of the proposed algorithms lies in that they have been
International Journal of Intelligent Engineering and Systems, Vol.12, No.1, 2019
DOI: 10.22266/ijies2019.0228.03
Received: September 17, 2018
applied to all dataset images. The main goal of our work is to find the affected area in the breast. Some research has focused on finding tumors only and avoids Calcification in the breast. As for our work, all tumors were examined and Calcification in the breast. Fig. 9 shows how to select random cluster center by the two algorithms. After having selected No. of cluster that (6) clusters by the user, we can see that there is a difference between the values of FCM and K-mean, this is due to the fuzzy logic at FCM which differs from crisp logic at which the shortest distance is being calculated in K-mean.
28
depend on the limits of shape, distance, location, area, diameter of the shape and axes, it is shown that the second algorithm is better than first algorithm, as the results of first algorithm showed that the accuracy is 91.18%, while the results accuracy of second algorithm reached 94.12%, this is due to the flexibility depending on locating the tumor limits given by second algorithm (depending the fuzzy logic). The algorithm based on FCM gave more accurate results - in determining tumor boundariesthan the algorithm based on k mean. But the second algorithm is faster to implement than the first algorithm. In this case the radiologist will be free to choose between the accuracy of the diagnosis and the rapid of implementation. Add to this, the assembly method is better than the traditional method in breaking the images down.
References
(a)
(b)
(c) Figure. 9 Relation between No. of cluster and cluster center at FCM and K-mean for three images: (a) mdb178, (b) mdb256, and (c) mdb271
5
Conclusions
Two methods are used at this research to divide the mammography images. The first method depends upon the (K-MEAN), the second method depends upon (FCM). After calculating the statistics that
[1] S. Weigel, W. Heindel, J. Heidrich, H.-W. Hense, and O. Heidinger, "Digital mammography screening: sensitivity of the programme dependent on breast density", European Radiology, Vol. 27, pp. 2744-2751, 2017. [2] Q. Huang, Y. Luo, and Q. Zhang, "Breast ultrasound image segmentation: a survey", International Journal of Computer Assisted Radiology and Surgery, Vol. 12, pp. 493-507, 2017. [3] I. Barco, C. Chabrera, A. Garcia-Fernandez, M. Fraile, S. Gonzalez, L. Canales, J. M. Lain, C. Gonzalez, M. C. Vidal, E. Vallejo, J. Deu, A. Pessarrodona, N. Gime´nez, and M. Garcı´a Font, "Role of axillary ultrasound, magnetic resonance imaging, and ultrasound-guided fineneedle aspiration biopsy in the preoperative triage of breast cancer patients", Clinical and Translational Oncology, Vol. 19, pp. 704-710, 2017. [4] F. R. Cordeiro, W. P. Santos, and A. G. SilvaFilho, "A semi-supervised fuzzy GrowCut algorithm to segment and classify regions of interest of mammographic images", Expert Systems with Applications, Vol. 65, pp. 116-126, 2016. [5] M. A. Duarte, A. V. Alvarenga, C. M. Azevedo, M. J. G. Calas, A. F. Infantosi, and W. C. Pereira, "Evaluating geodesic active contours in microcalcifications segmentation on mammograms", Computer Methods and Programs in Biomedicine, Vol. 122, pp. 304315, 2015.
International Journal of Intelligent Engineering and Systems, Vol.12, No.1, 2019
DOI: 10.22266/ijies2019.0228.03
Received: September 17, 2018
[6] R. Ben-Ari, A. Zlotnick, and S. Hashoul, "A weakly labeled approach for breast tissue segmentation and breast density estimation in digital mammography", In: Proc. of the 2016 IEEE 13th International Symposium on Biomedical Imaging, pp. 722-725, 2016. [7] V. Raman, P. Sumari, H. Then, and S. A. K. AlOmari, "Review on Mammogram Mass Detection by MachineLearning Techniques", International Journal of Computer and Electrical Engineering, Vol. 3, p. 873, 2011. [8] P. Anjaiah, K. R. Prasad, and C. Raghavendra, "Effective Texture Features for Segmented Mammogram Images", International Journal of Engineering & Technology, Vol. 7, pp. 666-669, 2018. [9] R. J. H. Bincy Babu, A. Josephin Arockia Dhivya, T. R. Thamizhvani, and R. Chandrasekaran, "A comparative study on segmentation methods of micro calcification in mammogram", International Journal of Engineering & Technology, Vol. 7, pp. 113-120, 2018. [10]R. S. C. Boss, K. Thangavel, and D. A. P. Daniel, "Mammogram image segmentation using fuzzy clustering", In: Proc. of the 2012 International Conference on Pattern Recognition, Informatics and Medical Engineering, pp. 290-295, 2012. [11] Z.-Z. Han, H.-J. Chen, J.-P. Li, and C. Yao, "A novel method of mass segmentation in mammogram", In: Proc. of the 2012 International Conference on Systems and Informatics, pp. 1412-1416, 2012. [12] L. Vivona, D. Cascio, F. Fauci, and G. Raso, "Fuzzy technique for microcalcifications clustering in digital mammograms", BMC Medical Imaging, Vol. 14, p. 23, 2014. [13] A. Elmoufidi, K. El Fahssi, S. Jai-Andaloussi, and A. Sekkaki, "Automatically density based breast segmentation for mammograms by using dynamic K-means algorithm and seed based region growing", In: Proc. of the 2015 IEEE International Conference on Instrumentation and Measurement Technology Conference, pp. 533-538, 2015. [14] G. K. Kanungo, N. Singh, J. Dash, and A. Mishra, "Mammogram image segmentation using hybridization of fuzzy clustering and optimization algorithms", Intelligent Computing, Communication and Devices, ed: Springer, pp. 403-413, 2015. [15] S. Gu, Y. Ji, Y. Chen, J. Wang, and J.-U. Kim, "Study on Breast Mass Segmentation in Mammograms", In: Proc. of the 2015 3rd
29
International Conference on Computer, Information and Application, pp. 22-25, 2015. [16] A. Touil and K. Kalti, "Iterative fuzzy segmentation for an accurate delimitation of the breast region", Computer Methods and Programs in Biomedicine, Vol. 132, pp. 137147, 2016. [17] R. M. Prakash, K. Bhuvaneshwari, M. Divya, K. J. Sri, and A. S. Begum, "Segmentation of thermal infrared breast images using K-means, FCM and EM algorithms for breast cancer detection", In: Proc. of the 2017 International Conference on Innovations in Information, Embedded and Communication Systems, pp. 14, 2017. [18] C. L. Chowdhary and D. Acharjya, "Segmentation of Mammograms Using a Novel Intuitionistic Possibilistic Fuzzy C-Mean Clustering Algorithm", Nature Inspired Computing, ed: Springer, pp. 75-82, 2018. [19] J. C. Bezdek, "Objective Function Clustering", Pattern Recognition with Fuzzy Objective Function Algorithms, ed: Springer, pp. 43-93, 1981. [20] Z. Wang, Q. Song, Y. C. Soh, and K. Sim, "An adaptive spatial information-theoretic fuzzy clustering algorithm for image segmentation", Computer Vision and Image Understanding, Vol. 117, pp. 1412-1420, 2013. [21] S. Kannan, R. Devi, S. Ramathilagam, and K. Takezawa, "Effective FCM noise clustering algorithms in medical images", Computers in Biology and Medicine, Vol. 43, pp. 73-83, 2013. [22] H. Hooda, O. P. Verma, and T. Singhal, "Brain tumor segmentation: A performance analysis using K-Means, Fuzzy C-Means and Region growing algorithm", In: Proc. of the 2014 International Conference on Advanced Communication Control and Computing Technologies, pp. 1621-1626, 2014. [23] J. Vijay and J. Subhashini, "An efficient brain tumor detection methodology using K-means clustering algoriftnn", In: Proc. of the 2013 International Conference on Communications and Signal Processing, pp. 653-657, 2013. [24] A. M. Salih and M.Y. Kamil, "Mammography Image Segmentation Based on Fuzzy Morphological Operations", In: Proc. of the 1st Annual International Conference on Information and Sciences, 2018.
International Journal of Intelligent Engineering and Systems, Vol.12, No.1, 2019
DOI: 10.22266/ijies2019.0228.03