The comprehensive final exam used by the Management Information Systems
Department for the advanced applications course was used as the post-test.
Research in Higher Education Journal
Management information systems: using a simulated testing package to assess student performance Sharon Paranto Northern State University Lu Zhang Northern State University Hillar Neumann Northern State University ABSTRACT This paper describes the results of using a simulated testing package to assess student performance in an advanced computer applications course. A pre-test/post-test format was utilized in assessing whether the level of knowledge and skills attained by students who completed the advanced course increased significantly when compared to the knowledge and skills the students possessed when entering the course. SAM, a student assessment tool that uses a simulated environment for testing, was used to measure each student’s level of knowledge and expertise both at the beginning of the course and at the conclusion of the course. The comprehensive final exam used by the Management Information Systems Department for the advanced applications course was used as the post-test. This same exam was given at the beginning of the semester as the pre-test. When a statistical analysis was performed on the scores, the Department found that the pre-/post-test process was not only useful in providing a measure of the learning that took place, but also in providing evidence that the intended outcomes of the technology component of the business core were achieved. The pre-/post-test process thus serves as an effective assessment tool, which is critical for both HLC (Higher Learning Commission) accreditation and AACSB accreditation. Keywords: Assessment, Pre/Post-testing, Accreditation, IS Assessment, SAM
Management Information Systems, Page 1
Research in Higher Education Journal INTRODUCTION According to AACSB, “measures of learning can assure external constituents such as potential students, trustees, public officials, supporters, and accreditors, that the organization meets its goals” (AACSB 2007, p. 60). In recent years, there has been a strong emphasis at the university involved in this study on providing course level assessments for accreditation purposes. Although the AACSB standards focus on program level assessment, the AACSB organization recognizes the need for course-level assessments. According to an interpretation of the AACSB standards, “course-level assessments are each faculty member’s responsibility” (AACSB Assurance of Learning, 2007, p. 4). Schuh noted that the emphasis on technology in schools in recent years has changed from providing students with “access to technology to giving them the skills they need to live, work, and learn in an increasingly digital world” (Schuh, 2004, p. 1). MIS 205, Advanced Computer Applications, is a core course required of all business majors at the university described in this study. The course is designed to provide business students with the skills needed to survive in this increasingly digital world. A central theme in HLC accreditation is the focus on commitment to student learning and the meaningful use of assessment to confirm and improve student learning (HLC, 2007). Prior to the Spring 2007 semester, a general content multiple choice exam had been used to assess whether learning did in fact take place in the advanced applications course. The MIS Department found that the post-test scores were useful in providing a measure of the level of learning that took place and evidence that the intended outcomes of the technology component of the business core were achieved (Paranto & Neumann, 2006). However, the exam included general computer knowledge that all college graduates should possess rather than content that was specific to this particular class. The multiple choice exam provided statistical data to indicate that students scored significantly higher at the conclusion of the class than they did at the beginning of the course, but the MIS faculty felt it would be advantageous to have an exam that covered the specific topic areas and skills taught in the advanced applications course. The MIS department started the process by meeting to discuss which skills were of utmost importance for business students, in order to update the final exam such that the key concepts and skills were included in the comprehensive final. Once this determination was made, SAM, a student assessment tool that uses a simulated environment for testing, was used to develop the exam. SAM is a Web-based “Skills Assessment Manager” software application that measures users’ proficiency in the Microsoft Office applications suite (Access, Excel, PowerPoint and Word), the Windows operating system, and general Internet skills (SAM, 2008). All faculty in the department had an opportunity to recommend changes to the draft exam that was developed and when the final version was ready to go, the pre/post-test process was revised to utilize the SAM package, beginning in the Spring 2007 semester. METHODOLOGY The pool of students used to assess learning in the advanced computer applications course (MIS 205) was taken from the Spring and Fall 2007 semesters. There were three sections of seventy (70) students in the Spring semester, all taught by the same instructor. In the Fall, there were three sections of sixty one (61) students taught by two different instructors.
Management Information Systems, Page 2
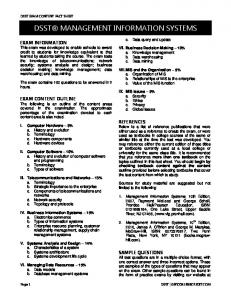
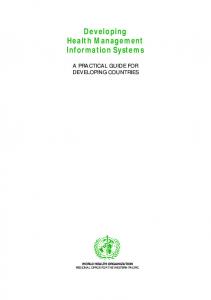
Research in Higher Education Journal At the beginning of the semester each student took an in-class pre-test over the specific material to be covered in each section of the course. Subsequently each student took a post-test over the same material. This post-test was the comprehensive final used in the advanced applications course. The pre- and post-tests were identical. A statistical analysis was conducted on the results. Faculty members were especially interested in comparing the statistical difference in the pre- and post-test results. We expected that students would achieve a statistically significant higher score on the post-test relative to the pre-test. An added benefit of the process is that the results provide assessment agencies with evidence of student learning. STATISTICAL RESULTS Sample Descriptive Statistics Tables 1 through 3 report the descriptive statistics for our sample. Tables 1 and 2 present the summary statistics for the spring and fall semesters and Table 3 for the combined spring and fall sample. In the spring semester, the individual pre-test scores ranged from 5% to 55%, whereas the individual post-test scores ranged from 32.5% to 97.5%. In the fall, the individual pre-test scores ranged from 7.5% to 72.5%, whereas the individual post-test scores ranged from 40% to 97.5%. Each table also provides the sample mean, median, mode, and standard deviation for the particular semester. The post-test mean, median, and modes for each semester exceed the pre-test values. The standard deviations tend to be greater in the fall as compared to the spring. Thus the variation of scores appears to be greater in the fall semester. Figures 1 and 2 consist of box plots for the spring and fall semester of 2007 which provide a unique picture of the data. Figure 3 is the box plot for the spring and fall semesters combined. The box plot clearly shows the post-test results exceed the pre-test scores for each semester and the spring and fall semesters combined.
Figure 1 Spring 2007 Pre and Post Test Box Plots
Table 1 Spring 2007 Pre and Post-Test Sample Descriptive Statistics Pre-Test Sample size (n) Mean standard deviation minimum maximum 1st quartile median 3rd quartile mode
70 29.714 9.987 5.000 55.000 25.000 30.000 35.000 25.000
Post-Test 70 70.036 14.126 32.500 97.500 62.500 70.000 79.375 62.500
0
10
20
30
40
50
60
70
80
90
100
70
80
90
100
Spring 2007 Pre-Test
0
10
20
30
40
50
60
Spring 2007 Post-Test
Management Information Systems, Page 3
Research in Higher Education Journal Table 2 Fall 2007 Pre and Post-Test Sample Descriptive Statistics Pre-Test Sample size (n) Mean standard deviation minimum maximum 1st quartile median 3rd quartile mode
61 30.861 12.415 7.500 72.500 25.000 32.500 37.500 35.000
Figure 2 Fall 2007 Pre and Post Test Box Plots
Post-Test 61 69.713 14.362 40.000 97.500 57.500 67.500 80.000 67.500
0
Sample size (n) Mean standard deviation minimum maximum 1st quartile median 3rd quartile mode
131 30.248 11.154 5.000 72.500 25.000 30.000 35.000 25.000
20
30
40
50
60
70
80
90
100
70
80
90
100
Fall 2007 Pre-Test
0
10
20
30
40
50
60
Fall 2007 Post-Test
Figure 3 Spring & Fall 2007 Pre and Post Test Box Plots
Table 3 Spring & Fall 2007 Pre and Post-Test Sample Descriptive Statistics Pre-Test
10
Post-Test 131 69.886 14.182 32.5 97.500 60.000 70.000 80.000 67.500
0
10
20
30
40
50
60
70
80
90
100
70
80
90
100
Spring & Fall 2007 Pre-Test
0
10
20
30
40
50
60
Spring & Fall 2007 Post-Test
Statistical tests of differences in the pre- and post-test means: Tables 4 and 5 present the statistical results for the tests of differences in means. Table 4 provides the t-statistics for the spring and fall. Table 5 provides the t-test for the combined spring and fall semesters. Table 4 Tests of Differences between Pre & Post Test Means Spring 2007 n = 70 level of significance = .025 or 2.5% critical one-tail: t = +1.9955 Mean
Pr-test 29.714
Post-test 70.036
Standard Deviation
9.987
14.126
t Stat Prob-Value
23.17 1.42E-34
Fall 2007 n = 61 level of significance = .025 or 2.5% critical one-tail: t = +2.0010 Pre-test Post-test 30.861 69.713 12.415
14.362
18.32 1.50E-26
Management Information Systems, Page 4
Research in Higher Education Journal Table 5 Tests of Differences between Pre & Post Test Means
Mean Standard Deviation t Stat Prob-Value
Spring & Fall 2007 n = 131 level of significance = .025 or 2.5% critical one-tail: t = +1.9785 Pr-test Post-test 30.248 69.886 11.154
14.182
29.30 2.02E-59
We arbitrarily set the level of significance at 2.5% (.025). The critical t statistics for the spring semester is t = +1.9955, for the fall is t = 2.0010, and the spring and fall combined is t = 1.9785. In each case the null hypothesis that the pre- and post-test means are equal must be rejected (not accepted). The probability values in each case are extremely small providing further support that the post-test means exceed the pre-test means. The statistical results support the hypothesis that the level of knowledge and skills acquired over each semester by students has increased significantly. OUTCOMES According to an Interpretation of AACSB Assurance of Learning Standards, “Regardless of the assessment tool that is selected for each learning goal, an acceptable, internal performance benchmark should be established to determine if student performance is acceptable or not. Such a benchmark could be based on the judgment of faculty or a pre-determined standard could be established.” (AACSB Assurance of Learning, 2007, p. 11). Due to the difficulty of the exam and the standard of using 60% as a passing score for the class, the following benchmark was established by the department: at least 75% of the students completing MIS 205 will score at or above 60% on the MIS technology-related post-test. Table 6 Outcomes Assessment Score 90-100% 80-