MAP - Mining Architectures for Product Line Evaluations Christoph Stoermer Robert Bosch Corporation Carnegie Mellon University 4500 Fifth Avenue Pittsburgh, PA 15213 USA +1 412 268 3949
[email protected]
Liam O’Brien Software Engineering Institute Carnegie Mellon University 4500 Fifth Avenue Pittsburgh, PA 15213 USA +1 412 268 7727
[email protected] architectural representations from existing systems.
ABSTRACT Product lines evolve out of existing products. In order to evaluate the potential of creating a product line from existing products it is necessary to ‘mine’ their architectures and analyze the commonalities and variabilities across those architectures. To manage the evaluation process in a disciplined way this paper introduces the MAP (Mining Architectures for Product lines) method. MAP outlines a bottom-up approach for mining the architecture of the existing products, a top-down approach to mapping architectural styles and attributes onto the mined architectures and an approach to analyzing their commonalities and variabilities. It combines well-known architecture reconstruction and product line analysis techniques. A case study is presented showing the application of the method and its benefits are outlined.
As the architecture plays an important role in the product line approach [2], architecture reconstruction of the existing systems should be part of the overall product line evaluation. However, the decision to move towards product lines has to be made on technical as well as non-technical issues. Besides business and social there are also organizational issues. The software is often developed by different software departments, although the products share the same market with similar requirements and functionalities. This could be caused by several reasons, like different hardware platforms with various memory and timing constraints, or specific customer bindings. Frequently such organizations are dealing with sensitive business issues and therefore every major change, like a product line migration, has to be considered carefully.
Keywords Architecture, Architecture Styles, Attributes, Architecture Reconstruction , Components, Product Lines. 1
Despite this, organizations are confronted with a competitive market - sometimes between the company’s internal business units - and an accelerating market speed. These result in cost and time to market pressure, which has to be weighed with separate parallel development of similar products.
INTRODUCTION
Product lines are found as a remarkable benefit for organizations [2]. They evolve out of existing products in a specific market segment. Typically, several products are delivered until a systematic migration takes place. To manage the evolution in a disciplined way organizations have to ‘mine’ existing assets for •
Architecture and
•
Commonalities and Variabilities
To support organizations in making a decision from a technical point of view the MAP (Mining Architectures for Product lines) method was developed. The method focuses on the architecture of the product line candidates, that is, the components, their relations and their external visible properties [3]. The method uses a bottom-up approach to recover architectural representations of existing systems and a top-down approach to map known architectural styles and attributes onto the recovered architecture. The reconstructed architectures of the product line candidates are compared and evaluated. The method assumes that the products to be investigated:
Architectures are increasingly perceived as an arena where commonalities and variabilities among different products are supported and where tradeoffs are mediated. The architecture is a potential place where different stakeholders communicate about conflicting requirements and goals. But how should architecture become a central player in the development process when there is no or poor documentation of existing products? Previous examples of architectural reconstruction exist [8,10,11] to extract
•
Are in a similar market segment.
•
Have a similar functionalities.
set
of
requirements
and
Besides the architectural issues there are further technical 1
(Extraction), abstracting that to an architecture model (Composition), and map known architectural styles and attributes onto the architectural model (Qualification). Abstracting to an architecture model is done in a product line context with special focus on the component view. The components have to be fine-grained enough to identify commonalities and variabilities. On the other hand they have to be coarse-grained enough to hide detailed implementation aspects. Typical reconstruction environments try to minimize the number of components and show a limited set of dependencies between them. This is normally sufficient for conformance evaluations or showing a system topology. But this is not sufficient for product line evaluations. A commonality and variability evaluation needs the right component level tuning. Setting the right component granularity is therefore one of the major steps in the reconstruction. This aspect is explicitly captured in the composition step.
issues, such as various hardware constraints that have to be considered in making a product line decision. These issues are not covered in detail by this method. To verify the method we performed a real case study on several systems in the automotive industry to evaluate the potential of moving those systems into a product line. The rest of the paper is organized as follows. Section 2 gives a description of the MAP method. Section 3 outlines the case study. Section 4 details related work. Section 5 outlines conclusions and future work. 2
METHOD DESCRIPTION
Product line architectures have two significant characteristics: explicit identification of commonalities and explicit identification of variabilities. Commonalities remain stable or are improved over the lifetime of the product line. Variabilities are exchangeable depending for example on customer requirements, different hardware platforms, or different communication protocols. A common way to realize commonalities and variabilities in a product line architecture is with the use of components. Components with well-defined interfaces and properties capture commonalities and variabilities of various products. The term component is wide spread in the software community and has various interpretations. We use the term component in the sense of an aggregation item, which captures normally cohesive functionality or mechanisms with vague qualities. Therefore components could be collections of classes, files, processes, operating system threads or a middleware component, like a COM or EJB component. Potentially such components or group of components could be managed by a configuration management system in a future product line environment.
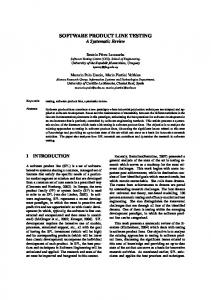
Figure 1: MAP steps Overview of MAP The method is illustrated in Figure 1. MAP consists of six steps: Preparation, Extraction, Composition, Qualification, Evaluation, and Follow-on activities. Each of these steps has certain inputs, actions, and outputs, which are described in more detail later. The following section gives a brief overview.
For each selected candidate product an extraction, composition, and qualification step is applied. An implementation model is elicited in the extraction step. The implementation model consists of several source views, which describe the relations between source elements. Source elements are typically the constructs of the implementation language, such as classes, functions and variables. Relations describe how the source elements relate to each other, such as call relations between functions or read accesses by functions on variables. The relations might contain static as well as dynamic information. The resulting implementation model is the basis for the composition and qualification step.
The first step is a preparation phase. All necessary information is provided to ensure a successful MAP method application. This includes basic aspects like a common understanding of a product line, technical aspects like the selection of the evaluation candidates, as well as organizational aspects like availability of resources (people, tools, etc.) for the duration of MAP application.
Composition establishes a component view. The view consists of the components, their functionalities, interfaces, and relations among them. Typically a technique for
The reconstruction consists of three phases: extracting an implementation model from existing source assets
2
developers), selecting candidate products.
component composition is aggregation of coherent functionalities. Component composition is a key issue as previously described. There might be information uncovered by reconstructing further products during the composition, which would lead to revisiting previous component groupings.
MAP assumes some knowledge about product lines at the organization. This includes the management as well as the participating developers. Sometimes a product line evaluation is forced by a new cross section group in the organization, which is investigating common development efforts. At best the participating development divisions are highly motivated in the process. Under normal circumstances the evaluator(s) has to be aware of potential conflicts. The merging of two organizations with similar products is a comparable situation. Therefore the preparation phase emphasizes a common method understanding and tries to buy-in as many stakeholders as possible. In addition the developer resources have to be made available for the evaluation. Although the effort is small the experience shows that the right developers (system architects) are difficult to get. These aspects are often neglected but are essential for the success of the method.
Qualification involves analyzing the software with respect to architecture styles and attributes. Architectural styles [4] are the structural glue of the components. They show the overall approach within the system and outline well-known characteristics, advantages, and disadvantages. Quality attributes show the various tradeoffs in the architecture [5]. They show the decisions where the architects had to compromise between diverging behaviors. The qualification step changes the view of the reconstruction. Extraction and composition are focused on a bottom -up approach whereas the qualification uses a topdown approach to map known architectural knowledge onto the system with its components.
Besides the organizational aspects there has to be a decision about the product candidates for the evaluation. The candidate products should be representative of the existing products, for example, in terms of different customers, various hardware platforms, protocols, or feature sets. A common number is 3-4 products. Frequently one of these products is from a domain, which is also being considered for inclusion within the same product line.
After completing the extraction, composition, and qualification steps the evaluation is carried out. The architectures of the products are compared, that is their components, views, styles, and attributes. A comparison on a source level view is not convenient because the products differ in naming and capturing of source level artifacts. A comparison on an architecture level focuses on the system structures. The structures are evaluated with a view to potential product line use.
The selected products are the candidates. The Extraction, Composition, and Qualification steps are applied on each of these candidates.
The evaluation results are the input for follow-on activities. Typical follow on activities are an Architecture Based Design (ABD [5]) and optionally an Architecture Tradeoff Analysis (ATAM [6]).
Extraction Extraction establishes an implementation model from existing assets of the candidate system. It is the initial step in the reconstruction environment.
The participants involved in applying MAP would ideally consist of the system architect, developers and maintainers familiar with the systems being evaluated and one or more evaluators. An evaluator should be familiar with tools and techniques for architecture reconstruction, architecture styles and attributes and has knowledge of product lines.
Input: Candidate products. Output: Implementation model. Activities: Presentation of software for each candidate by the architect, delivering of source assets to the evaluators, determination of the elements and relations to be modeled, collection of static and dynamic information, loading of the reconstruction workbench.
The following subsections describe the necessary input, output, and activities of each method step. Preparation This step is a pre-work step that precedes the reconstruction phase and evaluation step. Organizational as well as technical aspects are considered.
At the beginning of the extraction step the architect should present the candidate system, software, and development environment such as the tools and compilers used. The architect supplies the source code and available documentation such as specifications, interface descriptions, performance data, naming conventions or any other relevant architectural descriptions. The availability of these assets is highly dependent on the organization and on
Input: Knowledge about product lines at the organization. Output: Candidate products. Activities: Presentation of the MAP method, setting expectation levels, availability of resources (e.g.
3
too detailed implementation aspects. A helpful technique is to interview the architect and developers.
the system. From the presentation and the assets the evaluator(s) should be able to elicit an implementation model. Later on the evaluator(s) can see the level and terminology on which the developers described their products.
In any case the component segmentation level has to be revised for every new candidate composition step. Our experience has shown that the refinement is not too expensive as long as the products share a similar domain.
The implementation model is a collection of relations among source elements. Source elements are typically the constructs of the implementation language like functions, classes, files, and directories. Relations describe how the source elements relate to each other, such as call relations between functions or read accesses by methods on attributes. Besides static aspects there are also dynamic aspects like function execution time, or process relations.
The resulting component view consists of the components, their functionality and relations among each other (like calling relation, or information flow). Qualification Qualifying is the step of mapping architecture styles and attributes to the system and its components and relations.
The relations are typically generated by existing tools like source code parsers or lexical analyzers. Dynamic information is generated by profiling or code instrumentation techniques. The static as well as dynamic aspects are propagated to the Dali workbench [8] or a similar tooling environment [9].
Input: Implementation model, component view. Output: Architectural styles, attributes, design patterns, views. Activities: Interview architect and developers, capturing patterns, architectural styles and attributes, establishing further views.
The implementation model is the major input for the Composition and Qualification steps.
Until now we have followed a bottom-up approach. Starting with the source code we elicited a component view. The qualification step changes the view to a topdown approach and attaches well-known architectural styles, attributes, and design patterns to the system. Qualification involves
Composition Composition establishes the component view of the system. It is the key step for capturing structures for the commonality and variability evaluation. Input: Implementation model, component view from previous product architecture reconstruction (if it exists).
1.
Mapping of existing knowledge in the software community to the reconstructed system with its components.
Activities: Aggregation, component interfaces, component refinement, architect and developer interviews.
2.
Characterizing the system with its components in terms of architectural styles, attributes and design patterns.
The essential activity in Composition is the aggregation of source elements into components. There exist several aggregation techniques [10], which highly depend on the existing system. A common technique is aggregation of coherent functionality. Other techniques capture independent branches in the calling graph or aggregate functions attached to an execution process. There could be low-level aggregation techniques like collection of all files in a directory or extracting files and functions following certain naming conventions. Sometimes component interfaces are described or even an explicit component model like COM or EJB is deployed.
Architectural styles define families of organizational patterns, like repository or process control styles. The complement of architectural styles is attributes, like performance or safety. These styles and attributes put constraints on the architecture and tradeoffs have to be made.
Output: Component view.
Both styles and attributes should differ as little as possible among the candidates because they include various design decisions. The qualification step could generate further architectural views, such as, concurrency view, execution view, and deployment view. The composition and qualification steps determine the software architecture.
However the aggregation is performed, the components should capture the commonalities and variabilities of the candidates. If the components hide too much functionality then the variabilities could no longer be detected. If the component segmentation is too fine then the commonalities are not detectable and the evaluator(s) is confronted with
Evaluation The last step of MAP is the evaluation of the candidates concerning product line potentials. 4
Input: Views, styles, attributes. Output: Commonality and variability evaluation. Activities: Comparison, presentation.
structure
evaluation,
Follow-on Finishing the evaluation with a report and a presentation normally leads to some follow on activities.
report,
Input: Commonality and variability evaluation.
The first activity is the comparison of the candidates. There are several levels where comparison is conceivable, like analyzing code or functional levels. A product line evaluation emphasizes the structure of the system.
Activities: Product line decision, ABD, ATAM. The evaluation as well as further major aspects like requirements elicitation and a product line probe [2] leads to a proposal for a product line decision of the organization.
The component level should capture the commonalities and variabilities. If this is not possible then a product line approach might not be appropriate. Of course the commonalities and variabilities of the existing candidates are not satisfactorily reached at the component level otherwise an evaluation wouldn’t be necessary. On the other hand some structural patterns have to be recognizable even though the candidate systems were not designed for product lines. This is especially valid for the architectural styles and attributes level. Differences on that level have major impact on the structure and should be considered very carefully.
If the evaluation of the existing candidates is not satisfactory from an architectural point of view then an ATAM could be triggered. ATAM is a scenario-based evaluation technique, which elicits various architecture tradeoffs. In the case where the organization decides to move to a product line the evaluation results could be used for the Architecture Based Design (ABD) method. The ABD method is especially designed for product line contexts and long-lived systems [6].
All levels beneath the component level are not suitable for a comparison. An obvious reason is that the product candidates are often developed by different teams and therefore lack common naming conventions or common component segmentations.
3
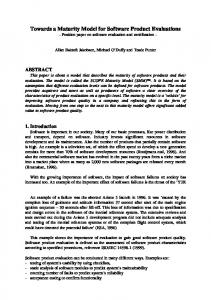
The MAP method was applied to several systems in the automotive industry. The common domain across these systems is a feedback process control environment, where the rotation of a motor should move an object depending on a desired object position (see Figure 2). A sensor provides pulses as a feedback to the process control. This general description fits to a lot of different devices in this domain. The products are running in a small embedded system.
Evaluations on the architectural level could consider the following •
Investigation of customer and system specific features.
•
Variation points in customer features, protocols, operating system and hardware.
•
Domain vocabulary. For example vocabularies for requirements, design and implementation. An analysis can show different abstraction levels. Specialized vocabularies (e.g. remaining on physical level, customer specific terminology) are interesting evaluation points.
•
•
CASE STUDY
Figure 2: Feedback Process Control In our description of the case study the names of the components as well as the domain names are changed to protect the business knowledge of the organization for whom the case study was carried out.
Product evolution. For example this could show the evolution of systems, e.g. from an autonomous system to a network device. In the case study the network change was considered from the customer point of view as a further feature. From the architecture point of view it was a major change between two versions of a product.
Preparation There were two similar domains (D1, D2) selected for the evaluation. The organization decided to take two products (P1, P2) from D1 and one product P3 from D2. P3 is a test to probe whether or not the structure of P3 would also fit inside a potential product line.
Various quality attributes. For example safety, performance and timing constraints.
The list of items to be evaluated will greatly depend on the candidate systems. 5
Extraction This step involved obtaining the source code and any architectural documentation for the candidate systems from the organization that we were working with. It involved arranging for architect and developer’s involvement during the composition step when we needed expert knowledge about the systems in order to identify the components. In the extraction stage we determined the source elements to be extracted and what relationships we would extract. Table 1 gives the list of those that we chose. All three products were implemented in the C programming language. The Imagix tool [12] was used to parse the source code and textual representations of the elements were output to an ASCII file. Perl was used to extract the information from the file in a format that allowed us to load it into the Dali [8] workbench. Once it was in the right format a database was populated and it was then possible to apply the necessary queries to identify the components and build the aggregations to obtain the architectural representation. Source
Relation
Target
Through analysis of the data within the system we identified that state and information flow variables were heavily used. Data is not exchanged directly between functions though passing of parameters in a call. Information flow mostly occurs indirectly when one component may set a state and assign some value to a variable. At a later point in the system execution another component checks the value of the state and uses the value stored in the variable. Execution can occur either directly where one component directly calls another or can be done at a higher level.
Description
File
Includes
File
File
Contains
Function A definition of a function in a file
File
Defines_var
Variable A definition of a variable in a file
Function Calls
Figure 3: shows the call relationships in P1
A C preprocessor #include of one file by another
Function A static function call
We grouped the source files containing the definition of these variables into the BLACKBOARD component and then generated a visualization showing the components that interact with it. Figure 4 shows the connections that we identified and it shows that all components access the state variables.
Function Access_read Variable A read access on a variable Function Access_write Variable A write access on a variable
Table 1: shows elements and relationships extracted Composition Through analyzing the code, documentation and interviewing the architects and developers of the system, we were able to identify several components within the system. Through investigating the source elements and the relations between them we were able to aggregate the files into components. We examined the functions contained and the variables defined within the files and aggregated these to a file level. We further aggregated these to a component level. We identified the components MAIN, CONTROL, POSITION as well as several others. Certain utility and system files were identified and were discarded as they contained common functionality and did not add to the architecture of the system. Figure 13 shows the components that were identified and the call relation (functions within one component call functions in the other) between these components.
Figure 4: shows the data relationships
6
Qualification The dominant architectural style used in the products is a feedback process style, as illustrated in Figure 2. Feedback process control styles are used in reactive systems. Such systems are mostly confronted with disparate, discrete events that require them to switch between different behavior modes (e.g. between controlling motions and adjusting the base position).
•
Interrupt level
•
Critical events level
•
Less critical level
The styles and attributes used in all three products are illustrated in Figure 5.
Figure 6: Execution levels of P1, P2, P3 The execution levels are illustrated in Figure 6. The first level contains the interrupt routines. In a pure sense there is no interrupt routine necessary in a cyclic executive environment since no function/task will process the information until its activation. Therefore the functions could synchronously poll after the condition. In the P1 and P2 case the interrupt routine counts the motor pulses for the position calculation. In practice it is difficult to record this information synchronously. The second level handles critical events. Functionality on that level deals with system safety, like the detection of a blocked motor. The term safety is used when a lack of proper functionality may produce system damage (like a damaged motor).
Figure 5: Styles and Attributes of P1, P2, P3 The architecture style and attribute map of the three products were reconstructed by analyzing the execution, control and data exchange behavior. The control behavior as well as additional views with further styles and attributes is not outlined in this paper.
The third level contains the less critical functions, like system supervision, interaction, temperature or power controlling. Referring back to the questions for the execution view we summarize as follows. The execution sequence is determined by the cyclic executive. The cyclic executive considers the attributes safety and performance in such a way that critical functionality is preferably executed.
Execution View
To establish the execution view the following example questions had to be answered: In which sequence are tasks executed? Are critical and less critical operations distinguished? Referring to the calling relations of the component view we saw that the component MAIN calls all other components. By analyzing the call graph it is obvious that a cyclic executive style is realized in the MAIN component.
Data Flow
The variables access relation in the implementation model showed the central position of BLACKBOARD in the component view (see Figure 4).
“The cyclic executive executes an application, which is divided into a sequence of non-preemptible tasks, invoking each task in a fixed order throughout the history of the program” [13].
“A blackboard architecture is a knowledge-based form of repository appropriate in applications requiring cooperative problem solving” [16].
The cyclic executive investigation identified three execution levels, which are common for P1, P2, and P3:
Knowledge-based and cooperative means that there are different computation pieces that together solve a problem.
7
In a blackboard environment there are typically no direct algorithmic solutions to a problem. The problem has to be divided into several computational steps. Each of these computational steps is a knowledge source, which together form, by a set of rules, the solution. A further characteristic is the variety of options. After each computation several reactions are possible. For further information about the Blackboard style see [4, 15].
is identical for each product and therefore is not mentioned further. A comparison of the component topology shows that the products are very similar from a structural point of view. For further evaluation we have to be precise what an arrow in the call relation means. An arrow represents a call of a function f1 inside component c1 to function f2 of component c2. The syntax as well as the semantics of the participating functions at the same arrow don’t have to be identical over the diagrams.
The blackboards of P1, P2, and P3 are a shared data space, spawned by files, which define the global variables. The data in the blackboards, as illustrated in Figure 7, have two different characteristics: 1.
Synchronization behavior
2.
Categorization of variables
At this step we have to investigate the component interfaces. The component interfaces as well as the call relations between the public functions of the components could be graphically presented with the dot tool [14]. An analysis showed that the interface syntax and semantics between components of P1 and P2 are similar. The syntax and semantics between P1 and P2 compared with P3 show significant differences.
Figure 7: Blackboard of P1,P2,P3 The first characteristic describes the synchronization behavior. Data shared with interrupt routines have to be protected. They build a critical region with a simple enable/disable synchronization mechanism. Non-critical data (not shared with an interrupt handler) don’t have to be protected (cyclic executive!).
Figure 8: shows the call relationships in P2
The second characteristic distinguishes between state related and information flow related variables. Especially state related information like states, events, transitions, and activities are key issues to describe the various options after each computational step. This is done in the control behavior analysis, which is not outlined in this paper. Evaluation The evaluation compares the different reconstructed architectures and evaluates them with a view to a product line migration. Component View
The component views of P2 and P3 are shown in Figures 8 and 9. The data flow with the BLACKBOARD component
Figure 9: shows the call relationships in P3
8
This results in the following observations:
Follow-on Based upon the results of the evaluation, some of which were not presented in this paper, a possible proposal could be:
P1/components approximates to P2/components P1/components differs from P3/components P2/components differs from P3/components
1.
A migration towards a product line for products in D1 makes sense from an architecture point of view. There should be a serious ABD effort at the organization to transfer further products into a product line.
2.
A prototype effort based on the ABD method should investigate a common product line for products in domains D1 and D2.
P1/topology approximates to P2/topology P1/topology approximates to P3/topology P2/topology approximates to P3/topology Architectural Styles and Attributes
The styles and attributes of P1 and P2 are identical. P3 uses a different timing approach in the cyclic executive. This results in the following observations:
4
P1/StylesAttribs equal to P2/StylesAttribs P1/StylesAttribs approximates to P3/StylesAttribs
Several efforts already exist in architecture analysis, architecture recovery and product line analysis. However none of these techniques looks at analyzing existing systems/products with a view to evaluating the potential of creating a product line. Bowman, et al., and Harris, et al., outline techniques for architecture reconstruction. The SEI’s Product Line Framework [2] offers several practice areas, like domain analysis or feature models for product line conversion.
P2/StylesAttribs approximates to P3/StylesAttribs Examining the variable names yielded: 1.
The terminology remains at a physical level (e.g. port_123 for speed).
2.
Concrete user activities are hard wired to a specific feature (e.g. button_500ms_pressed for calibrate position).
RELATED WORK
Bowman, et al., [1] outline a method for extracting architectural documentation from the code of an implemented system. They analyzed source code using cfx to obtain symbol information from the code and generated a set of relations between those symbols. They manually created a tree-structured decomposition of the system into subsystems and assigned the source files to these subsystems. Then they used the grok tool to determine relations between those subsystems. and the ledit visualization tool to visualize the extracted system structure. Refinement of the resultant structure was carried out by moving source files between subsystems.
Both aspects are disadvantageous for product lines. The first aspect expresses the homogeneous usage of a physical terminology throughout the system. In contrast to a domain vocabulary, which distinguishes between a physical and a domain view. The physical terminology expresses the specific physical environment of the software. The domain terminology expresses the essential domain items, which for example is independent of a specific physical incarnation but inherently needs a logical representation. The second aspect is a consequence of the first. Concrete user activities are wired to concrete features. This is especially disadvantageous in multi-customer environments where it is difficult to decouple certain customer requirements from system features.
Harris, et al., [11] outline a framework for architectural recovery using both a bottom-up and a top-down approach. The framework consists of three components: the architecture representation, the source code recognition engine and supporting library of recognition queries and a “Bird’s Eye” program overview capability. In a bottom-up approach analysts use the bird’s eye view to display file structure and file components of a system. Information is then reorganized into more meaningful clusters. In a topdown approach analysts use a particular architectural style, which defines components that should be found in the software. Recognition queries are used to determine if these components do exist.
Working on both aspects (decoupling logical and physical level) as well as introducing indirections for customer features is essential for product lines. The ABD method explicitly handles such situations. Furthermore it increases the probability that the domains D1 and D2 could be handled in a common product line.
9
Previous use of the Dali workbench [8] has been to reconstruct the architecture of a system and to check conformance against some reference architectural description. The work outlined in this paper extends the Dali method by mapping architectural styles and attributes onto the reconstructed architectures and carrying out an analysis of their commonalities and variabilities. 5
of an Emerging Discipline, Prentice Hall, 1996.
CONCLUSIONS
Architecture mining techniques are useful for product line migrations. MAP organizes the mining and analysis over several products in a disciplined way. The method results are one aspect in the organization’s decision to move towards a product line. The major benefits of MAP are: •
Mining existing assets on an architectural level. The insights gained provide useful information for applying the architecture based design method.
•
Documentation of the “as implemented” architecture is produced as a result of applying the method.
•
Increased architecture awareness within the organization.
•
Rational arguments for product line migration from an architecture point of view are generated.
3.
L. Bass, P. Clements, R. Kazman, Software Architecture in Practice, Addison-Wesley, 1998.
4.
M. Shaw,D.Garlan, Software Architecture: Perspective
6.
L.Bass F.Bachmann et al., The Architecture Based Design Method, CMU/SEI-2000-TR-001.
7.
R.Kazman, M.Klein et al., Experience with Performing Architecture Tradeoff Analysis, Proceedings of the 21st International Conference on Software Engineering (ICSE 21), 1999.
8.
R. Kazman, S. Jeromy Carrière, Playing Detective: Reconstructing Software Architecture from Available Evidence, Journal of Automated Software Engineering, pp.107-138, April 1999.
9.
P.J.Finnigan et al., The Software Bookshelf. IBM Systems Journal, 1997, Software Release v2.0, 01/98.
11. R. Harris and H. B. Reubenstein and A. S. Yeh, Reverse Engineering to the Architectural Level. International Conference on Software Engineering (ICSE), pp 186-195, April 1995. 12. Imagix corporation, http://www.imagix.com 13. C. Douglass Locke, Cyclic Executive vs. Fixed Priority Executives. The International Journal of TimeCritical Computing Systems, Volume 4, No.1, 1992. 14. E. Koutsofios and S. North, Drawing graphs with dot. Technical Report, AT&T Bell Laboratories, Murray Hill NJ, 1992. 15. J. Peters, W. Pedrycz, Software Engineering. An Engineering Approach. Wiley, 2000. 16. B. Hayes-Roth, A Blackboard Architecture for Control, Artificial Intelligence 26(3) pp 251-321, 1985.
REFERENCES 1. T. Bowman, R. C. Holt and N. V. Brewster, Linux as a Case Study: Its Extracted Software Architecture. International Conference on Software Engineering, Los Angeles, May 1999. P. Clements, L. Northrop, A Framework for Product Line Practice. Version 2.0, August 1999, http://www.sei.cmu.edu/plp/frameworkv2.7.pdf.
M. Klein, R. Kazman et al., Attribute Based Architecture Styles. Software Architecture, Proceedings of the First Working IFIP Conference on Software Architecture (WICSA1), 1999.
10. D. R. Harris, H. B. Reubenstein, A. S. Yeh, Recognizers for Extracting Architectural Features from Source Code. Proceedings of the 2nd Working Conference on Reverse Engineering, 1995.
Our experience in carrying out the case study was that the reconstruction, composition and qualification required a lot of manual effort. What is needed is a more formal description of the types of architectures within a domain of interest. From this formal definition of architectural styles it should be easier to carry out the Qualification. A more formal description may also lead to more automated support for architecture recovery and may lead to improvements in the Extraction, where we may be able to identify other elements or relations that would help improve MAP.
2.
5.
10