frozen in aliquots of 200 |aL as 50 ng/|LiL. 2.3. PCR Reactions ..... 2, 1271-1288. 20. Drwinga, H. L , Toji, L H., Kim, C. H., Greene, A E., and Mulivor, R. A. (1993).
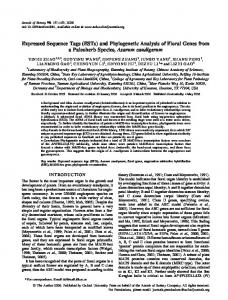
11 Mapping Expressed Sequence Tags (ESTs) by Multiplexing PCR Reactions from Hybrid Cell Panels and Detecting Fluorescently Labeled Products A. Scott Durkin, Donna R. Maglott, and William 0. Nierman 1. Introduction Determining the chromosomal origin of expressed sequence tags (ESTs) (1,2) lags far behmd their identification m single-pass sequencing projects (1—10). Positional cloning of disease genes requires that previously uncharacterized transcripts be mapped to the smallest possible defined region. We have developed an efficient polymerase chain reaction (PCR)-based procedure for the rapid assignment of ESTs to human chromosome regions (11—12; Fig. 1). The critical features of the method are: 1 2. 3. 4.
Standard, restricted criteria for primer design; Sensitive, automated analysis offluorescentlylabeled PCR products, Standard PCR conditions; and Multiplexed PCR reactions.
Primers for PCR reactions are designed from ESTs using narrow windows for primer Tj„, primer base composition, and amplified product size (Fig. 1, "Primer Design"). These primers are then tested using standard reaction conditions {see Section 3.3.) for generating a product from human genomic DNA that matches the size predicted by the EST sequence (Fig. 1, "Primer Proving"). Successful primers are combined so that multiplexed PCR products can be resolved on the basis of product size and fluorescent label, and are used with DNA templates from somatic cell hybrid mapping panels. Products from several PCR reactions are also pooled before electrophoretic analysis. Chromosomal and subregional assignments are made by discordancy analysis. From Methods in Molecular Biology, Vol 68 Gene Isolation and Mapping Protocols Edited by J Boultwood Humana Press Ino , Totowa, NJ
159
Durkin, Maglott, and
160
Nierman
cDNA SEQUENCE DATA PRIMER DESIGN PRIMER PROVING ADDITIONAL PGR REACTIONS
MAPPING REACTIONS DISCORDANCY ANALYSIS
-AMBIGUOUS-
CHROMOSOMAL ASSIGNMENT SUBREGIONAL MAPPING REACTIONS DISCORDANCY ANALYSIS SUBREGIONAL ASSIGNMENT
Fig. 1. Strategy for mapping ESTs using PGR Our approach is effective if the first multiplex PCR attempt results in a chromosome assignment. Multiplexmg and pooling reduce the number of PCR reactions and electrophoretic analyses only if assignments can be made with regularity based solely on initial trials. Having to pass through the "ambiguous" loop (Fig. 1) decreases efficiency. Previous approaches to multiplexing PCR reactions (13—18) involved empirical optimization of reaction conditions and primer combinations for simultaneous amplification of a defined set of multiple products for repeated assays. We, however, typically use a primer pair designed from a cDNA sequence in only two or three sets of PCR reactions (Fig 1). The first set of PCR reactions determines primer pair success in amplifying a size-specific product in human DNA distinct from potential rodent background. The second set of reactions determines the amplification pattern of template DNA samples from either human/mouse or human/hamster hybrid cell lines of known human karyotype. The third set of reactions determines subregional localization, using template DNA samples from somatic cell hybrids containing known sub-
PCR Mapping of cDNA Clones
161
regions of a single human chromosome. Optimizmg reaction conditions and primer combinations for each primer pair for such a hmited number of reactions would thus require more effort than mapping the cDNA sequences using only one pair per reaction. Instead, we design primer pairs using narrowly defined parameters and determine success using standard reaction conditions (]], 12,19) in primer proving reactions. We then combine primer pairs for multiplex mapping reactions based on the fluorescent dye label and the amplified product size.
2. Materials 2.1. Primer Design 1 Software that permits the design of primers based on target boundaries of the sequence to be mapped, length of primers, T^ of primer, and product size: We used Primer (v. 0.5), available from the Whitehead Institute for Biological Research (Cambridge, MA) (URL http://www-genome.wi mit.edu/ftp/distribution). A newer version (2 2) can also be executed from that site (see Note 1). 2. Electronic records of sequences to be mapped
2.2. Templates 1. DNA from somatic cell hybrids, frozen in aliquots for 200 reactions (200 ^L, 50 ng/pL). To assign sequences to a human chromosome, we used NIGMS human/rodent somatic cell hybrid mapping panels 1 and 2 (Conell Institute, Camden, NJ; 20,21) and PCRable DNA (BIOS Corporation, New Haven, CT, 22) The NIGMS panel 1 was supplemented with a human 21 -only cell line (GM103 23 from NIGMS panel 2). 2. DNA from each genome used in the construction of the hybrid cell panels, also frozen in aliquots of 200 |aL as 50 ng/|LiL.
2.3. PCR Reactions 1. Oligonucleotide primers (50 ng/^iL) with one member of the pair labeled with an ABI (Applied Biosystems Inc., Foster City, CA)fluorescentdye at the 5'-end (HEX, 6-FAM, TAMRA [not used], ROX [reserved for the standard]). 2. Thermal cycler. 3. lOX PCR buffer (Perkin-Elmer, N808-0006, Roche Molecular Systems, Branchburg, NJ): 500 mMKCl, 100 mMTris-HCl, pH 8.3, 15 mMMgCl2,0.01% (w/v) gelatm. 4. AmpUra^ AS (Perkin-Elmer, N808-0070, 5 U/mL) 5. dNTPs: 2.5 mMeach dATP, dCTP, dGTP, dTTP.
2.4. Product Analysis 1. Instramentation and software permitting resolution of products by size and dye label We used an ABI 373A sequencer (separation by vertical, denaturing polyacrylamide gel electrophoresis) and GENESCAN software. 2 Mol-wt standards (ABI GENESCAN-2500 [ROX], 401100).
162
Durkin, Maglott, and Merman
3 Formamide, deionized (Life Technologies, Gaithersburg, MD, 15515-018). 4. Acrylamide stock solutions (Bio-Rad Laboratories, Richmond, CA, 161-0144, 40% acrylamide/bis-acrylamide 19 1 [5% C] stock). 5. Urea (Life Technologies, 5505UX)
3. Methods
3.1. Primer Design 1. Select a target sequence range that excludes the end of the single-pass sequence where the accuracy of base calls may not have been as high (typically the first 300 bp of the single-pass sequence data) 2 Consider selecting a target range that excludes all repetitive elements and avoids coding regions {see Note 2) Grail (grail@oml gov) may be used to predict coding regions 3 Select narrow ranges of acceptable values for primer selection to increase success rates under standard conditions. We used 50% GC, primer T„ of 55—59°C, amplified product size of 80-150 bp, and primers of 18-22 bp.
3.2. Multiplex Strategies and Primer Syntliesis/Labeling 1. Identify primer pairs that will be combined for multiplexed PCR reactions based on predicted product size 2. Products labeled with the same fluor should differ by at least 10 bp, and products labeled with different fluors differ by at least 5 bp. 3. Label the 5'-end of one member of the primer pair with the selected fluor during oligonucleotide synthesis. This was done using the ABI fluorescent amidites 6-FAM (401527) or HEX (401526) on an ABI 392 synthesizer (see Note 3) 4. Best results are obtained with the 6-FAM and HEX dyes (ROX being reserved from the mol-wt standard).
3.3. Primer Testing PCR Reactions and Multiplex PCR Reactions (see Notes 4 and 5) 1. Reaction mix (per 15-nL vol): Prepare as a master mix for 25-35 reactions, with template added individually 1.0 \iL template stock solution (50 ng), 0 8 |aL pnmer 1 (40 ng), 0.8 i^L primer 2 (40 ng), 0.12 ^L Amplira^ AS (0.6 U), 0.08 ^L dNTP (200 nM of each dNTP), 1.5 ]xL lOX buffer. Thermal profile- 95°C for 5 min, 25 cycles: 94°C for 1.4 mm, 55°C for 2 mm, and 72°C for 2 mm. Final extension at72°Cfor lOmin.
3.4. Sample Analysis (see Note 6) 1. Mix 1 |aL amphfication reaction, 0.5 jiL size standard, 3.5 |j,L formamide (Note 7) 2 Heat 2 min at 95°C. 3. Load onto gel. We use the 24-welI comb with a denaturing (8Murea) 6% polyacrylamide gel (5% crosslinked). The gel is run for 6 h (limits 2500 V, 40 mA, 30 W at ambient temperature) and is scanned at 25 cm from the well. 4. Determine products and their sizes using GENESCAN software.
PCR Mapping of cDNA Clones
163
3.5. Determining Chromosome Assignment 1. Identify chromosomes for which the discordancy between the presence of a PCR product and the presence of a chromosome is