PHYSICAL REVIEW B 86, 155148 (2012)
Mapping the near-field dynamics in plasmon-induced transparency Ziliang Ye,1 Shuang Zhang,1 Yuan Wang,1 Yong-Shik Park,1 Thomas Zentgraf,1 Guy Bartal,1 Xiaobo Yin,1,2 and Xiang Zhang1,2,* 1
NSF Nanoscale Science and Engineering Center (NSEC), University of California, 3112 Etcheverry Hall, Berkeley, California 94720, USA 2 Material Sciences Division, Lawrence Berkeley National Laboratory, Berkeley, California 94720, USA (Received 6 January 2012; revised manuscript received 29 August 2012; published 25 October 2012) The photonic analog of atomic electromagnetically induced transparency (EIT) introduces a sharp resonance in transmission within a broad absorption profile. The rapid dispersion of these structures leads to critical photonic applications such as integrated optical delay lines. To date, experimental demonstrations of such analogs have relied on the measurement of the far-field spectrum. Here we present a near-field optical study of plasmon-induced transparency (PIT), a photonic analog with subwavelength-sized plasmonic resonators mimicking the bright and dark elements in EIT. Supported by numerical analyses, the optical near-field distributions at various wavelengths reveal the interference dynamics between the coupled bright and dark plasmonic resonators. DOI: 10.1103/PhysRevB.86.155148
PACS number(s): 78.20.Ci, 42.25.Bs, 78.67.Pt
I. INTRODUCTION
Atomic electromagnetically induced transparency (EIT) eliminates the absorption of a medium through a destructive interference between two resonant transition pathways, a dipole-allowed direct excitation and an indirect transition from a metastable dark state, rendering a narrow transparency window at resonance1–3 and leading to many interesting optical phenomena such as slow light and enhanced nonlinear processes.4,5 While such quantum interference is observed in atomic or solid state systems, recently, optical analogs of atomic EIT have attracted much attention, largely motivated by storing and processing optical information in an integrated form.6–14 So far, optical experimental demonstrations have relied on far-field spectroscopic techniques to study the classical analog of atomic transition.9–11,15 In these classical optical “atoms,” the investigation on the near-field distribution, which is the fundamental reason leading to the EIT-like far-field response, still remains missing. Here, we utilize apertureless near-field scanning optical microscopy (NSOM) to explore experimentally the underlying coherent interference processes between the “bright” and “dark” elements in plasmon-induced transparency (PIT). Compared with previous work on the superconducting resonator in the microwave regime,16 by visualizing the oscillation amplitude of the surface plasmon polariton (SPP) at three different frequencies, we observe the interference between the directly excited bright element and the indirectly excited dark element at the single meta-atom level.
II. THEORETICAL MODEL
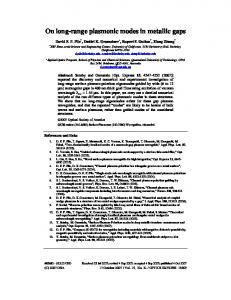
A PIT structure consists of a single plasmonic rod in close proximity to a double rod structure as schematically illustrated in Fig. 1(a). The double rod structure acts as a quadrupole antenna which possesses an antisymmetric plasmon mode and does not interact directly with the incident planer electromagnetic waves, consequently appearing as a “dark element.” A single plasmonic rod can strongly couple to the external field and therefore appears as a “bright element,” that is, as a resonating dipole antenna.17 When they are placed in close proximity, the quadrupole antenna can be indirectly 1098-0121/2012/86(15)/155148(4)
excited through near-field coupling from the resonating bright element. As the result, destructive interference can occur between the two alternative excitation pathways of the dipole antenna: direct excitation from the incident plane wave and indirect excitation through the near-field coupling between the quadrupole and the dipole antennas [illustrated in Fig. 1(a)]. The strength of such a mutual coupling is determined by the separation between the two resonators, and the induced transparency takes place when the coupling strength is in the strong coupling regime, where the strength of the indirect near-field excitations is comparable to that of the direct excitations but with a π phase difference, that is, a π /2 phase shift from each resonator.12 Alternatively, the formation of the PIT can be interpreted as the result of eigenmode hybridization of the two coupled plasmonic elements;18 the bonding and antibonding modes, which are the linear superpositions of the radiative and nonradiative modes [see Fig. 1(b)]. Excitation at the frequency centering between the two resonant frequencies receives opposing contributions from each resonance that cancel each other, thereby rendering the system transparent. The above design is based on the analogy to mimic the transition pathways between ground states, excited states (bright states), as well as metastable states (dark states) in EIT atoms. The electron population at each state has its classical counterpart in classical analogs, measured by the local electric field amplitude. Therefore, the near-field visualization of bright and dark elements in PIT offers an opportunity to understand the underlying coherent processes that lead to PIT. The understanding of the population distribution within each of the states is as important as the transitions across them since a transition cannot be established without an adequate population occupying the given states. In atomic processes, the population of excitations is distributed in the energy space, which requires complicated pumping schemes and ensemble averages in identically prepared atoms. In stark contrast, one major advantage of the plasmonic analog is that the different energy levels correspond to the electromagnetic resonance of the spatially separated antenna elements (bright and dark). The equivalent energy states are therefore correlated with the spatial location of the electromagnetic hotspot. As a result, by mapping
155148-1
©2012 American Physical Society
ZILIANG YE et al.
PHYSICAL REVIEW B 86, 155148 (2012) III. EXPERIMENT AND RESULTS
FIG. 1. (Color online) Schematic of a plasmon-induced transparency (PIT) system mimicking the transition pathways in electromagnetic-induced transparency (EIT). (a) The bare states representation. The incident plane wave can excite the radiative dipole antenna, which is coupled to a dark element consisting of an electric quadrupole. (b) The dressed states representation. The coupling between the radiative dipole and the quadruple forms new hybridized states, i.e., the bonding state at lower energy and the antibonding state at higher energy. The transparent state lies directly in between the two states. As a result of the plasmonic design, the SPP population in the electric dipole and quadrupole should be a direct analog to the electronic excitation population in EIT.
the local electric field intensity of SPPs with a near-field optical microscopy (NSOM), we can visualize the equivalent population distribution in a single “meta-atom” level.
In our experiment, an array of PIT structures was fabricated on an indium titanium oxide coated cover glass with electron beam lithography, followed by metallization with gold and a subsequent lift-off process. Figure 2(a) shows the scanning electron microscope (SEM) image of the resulting PIT structures in an array. The geometric parameters are L1 = 275 nm, W1 = 54 nm, S1 = 85 nm, L2 = 340 nm, W2 = 86 nm, and S2 = 43 nm. The periodicity is 690 nm and the metal thickness is 40 nm. The spectral far-field response was characterized by using a Fourier transform infrared spectrometer (NA = 0.4). The far-field transmission spectrum exhibits the typical induced transparency feature [Fig. 2(b)], namely, a narrow transparency band at 1.33 μm wavelength between the two transmission dips at wavelengths of 1.2 and 1.5 μm. The transmission peak does not reach 100% as the metal loss causes a finite lifetime in the antenna. On the other hand, the spectrum is not completely symmetric regarding the transparent frequency due to the slight misalignment between the dipole and the quadrupole resonance frequency. This spectrum is confirmed by the finite-difference-time-domain (FDTD) simulation with the same condition as the experiment, shown as the red dashed curve. We can also quantitatively understand this spectrum through a dipole-quadrupole coupling model.12 If we define the oscillation amplitude of the dipole and quadrupole, which are the solutions to the coupled resonator model in Eq. (1) of Ref. 12, as D and Q, the total extinction ratio observed in the far field should be proportional to the sum of the extinction cross sections, γd |D|2 + γq |Q|2 . Through fitting the experimental transmission spectrum, we retrieved all the parameters in the dipole-quadrupole coupling model, including the resonator frequency, the damping rate, and the mutual coupling strength between the resonators. From the experimental result in Fig. 2(b), the retrieved damping rate of the dipole is γd = 89 THz and for the quadrupole it is γq = 47 THz; the effective coupling rate is κ = 84 THz, which is stronger than the geometric mean of the damping rates of the two resonators. This experimentally confirmed that strong coupling occurs between the two plasmonic elements.12
FIG. 2. (Color online) Far-field transmission and SPP oscillation amplitude retrieval of PIT metamaterial. (a) The SEM images of the PIT sample fabricated by e-beam lithography with the dimensions indicated in the main text. The scale bar is 300 nm. (b) The transmission spectrum with the polarization of incident light, indicated in (a), measured by a Fourier transform infrared spectrometer (solid) and the numerical simulation results (dashed) calculated by CST Microwave Studio. (c) The near-field spectrum of the SPP oscillation amplitude of the electric dipole (red dashed) and quadruple (green solid), respectively. They are based on the parameters retrieved from the transmission spectrum according to the coupled resonator model in Ref. 12. Green and red dashed lines stand for the wavelengths at which the experiments shown in Figs. 3(a) and 3(b) are operated. The blue curve indicates the condition of the experiment shown in Fig. 4(a). 155148-2
MAPPING THE NEAR-FIELD DYNAMICS IN PLASMON- . . .
PHYSICAL REVIEW B 86, 155148 (2012)
Using the retrieved parameters, we plot the absolute value of the oscillation amplitudes |D| and |Q| versus the wavelength, as shown in Fig. 2(c). The resonant peak of the dipole SPP (the red curve), due to the coupling, splits into an M shape and shows a valley at a transparency frequency of 1310 nm, while that of the quadrupole SPP (the green curve) exhibits a strong enhancement plateau comprising two largely overlapped resonant peaks. This shares a similar trend as the electronic population distributions in the nonradiative state and the radiative state in atomic systems.19 In what follows, we investigate the localized SPP intensity at three different frequencies relative to the transparency point, marked by dashed lines of different colors in Fig. 2(c), by using scattering (apertureless) NSOM with a spatial resolution down to 15 nm.20 Figure 3(a) displays the local electric field intensity (in green) at a transparency wavelength of 1310 nm, where the retrieved oscillation amplitude at the “dark” state exceeds the oscillation amplitude at the “bright” state. The intensity distribution is superimposed with the topographic image (in gray), simultaneously taken with atomic force microscopy and NSOM in the same scan. The near-field image shows that, in each single PIT structure, the nonradiative quadrupole antenna is excited, forming four localized SPP hot spots
FIG. 3. (Color online) Local electric field intensity mapped by apertureless NSOM. (a) The near-field result measured at 1310 nm. The NSOM signals are rendered in green and superimposed onto AFM topography results in gray. Only four corners of the gold rod pair light up, which results in transparency in the far field. The scale bar is 300 nm. (b) The near-field result measured at 1530 nm. The excitation locations of localized SPPs are transferred to the ends of the dipole antenna, rendered in red. The contrast between the electric dipole and quadruple agrees with the near-field spectrum in Fig. 2(c).
FIG. 4. (Color online) Near-field result at the hybridized state frequency. (a) The near-field mapping result at 1310 nm, the hybridized state wavelength of another sample. The optical signal is represented by the blue hotspots at the ends of both the single rod and rod pair. (b) Numerical simulation of the structure at the same frequency. The blue color means a positive π /2 phase and red means a − π /2 phase. (c) The schematic of the phase of the electric field based on the experimental and the numerical results.
at all ends of the metallic double bar, and the radiative dipole is significantly suppressed due to the deconstructive interference between the direct and indirect excitation paths described in Fig. 1(a). As a result, the absorption and the scattering of the dipole antenna are greatly suppressed, and the overall system appears transparent in the far field. This observation that the PIT system is purely excited in the nonradiative state at the transparency frequency confirms the importance of exciting the dark element in achieving induced transparency. At a wavelength of 1530 nm, far from the transparency window, as shown in Fig. 3(b), the near-field measurement reveals an excitation of the dipole with localized SPPs forming at the ends of the dipole antenna. This agrees well with the near-field spectrum obtained in Fig. 2(c). At this wavelength, only the bright element in the PIT structure is excited because the dark element has a relatively higher Q factor and is far off the excitation frequency. Therefore, the extinction at this frequency can be mainly attributed to the electromagnetic loss of the bright element. Interestingly, we also observed the field distribution of a state hybridized of both dipole and quadrupole states. At the frequency marked by the blue dashed line in Fig. 2(c), the transmission is at one of the dips corresponding to a hybridized mode, wherein the nonradiative resonator shows oscillation strength comparable to that of the radiative resonator. At this condition, the near-field image in Fig. 4(a) indeed displays the excitations of both bright and dark elements. For this sample, the geometry has been modified to match the dressed state frequency with the available laser frequency. The geometry of the sample is L1 = 306 nm, W1 = 61 nm, S1 = 105 nm, L2 = 347 nm, W2 = 72 nm, and S2 = 50 nm. The periodicity is 690 nm and the thickness of the metal film is 30 nm. The retrieved parameters are, respectively, γA = 34 THz and γB = 124 THz; the effective coupling rate is κA = 113 THz. The new dressed state wavelength is at 1530 nm. As can be seen in Fig. 4(a), the electric field occurring at the quadrupole ends closer to the dipole is oscillating stronger than the ends away from the dipole. In Fig. 4(b),
155148-3
ZILIANG YE et al.
PHYSICAL REVIEW B 86, 155148 (2012)
another FDTD simulation confirms this effect. The physics behind it is shown schematically in Fig. 4(c), where the charge accumulation associated with the oscillating electric field is labeled by the positive and negative signs at the ends of the bright and dark resonators. As shown in Fig. 4(c), the closer-to-the-dipole end of the quadrupole is oscillating in phase with the neighboring dipole end. Therefore, the Coulomb repulsion between the charges of the same sign in the dipole and quadrupole SPPs renders the closer ends weaker than the distant ends in intensity, which can explain the observations in the experiment and simulation. Such a spatial visualization of the near-field interactions dynamically reveals the interference pathways between dark and bright elements in the PIT atom, reassembling the coherent processes among energy states in atomic EIT at steady state.
In conclusion, we have experimentally visualized the nearfield interactions between bright and dark elements of a PIT system. In the strong coupling regime, the different near-field distributions at different frequencies have been obtained within the induced transparency process. The near-field observations reveal the key characteristics of plasmon-induced transparency as well as the hybridized state, which agree well with the far-field measurement. Our understanding of the resemblance between PIT and the atomic EIT offers a possibility to explore the complex coupled system, from the quantum to classical regime. This research was supported by US Air Force Office of Scientific Research (AFOSR) MURI program under grant no. FA9550-12-1-0024.
*
11
[email protected] S. E. Harris, Phys. Today 50, 36 (1997). 2 K. J. Boller, A. Imamoglu, and S. E. Harris, Phys. Rev. Lett. 66, 2593 (1991). 3 D. F. Phillips, A. Fleischhauer, A. Mair, R. L. Walsworth, and M. D. Lukin, Phys. Rev. Lett. 86, 783 (2001). 4 L. V. Hau, S. E. Harris, Z. Dutton, and C. H. Behroozi, Nature (London) 397, 594 (1999). 5 R. W. Boyd, Nonlinear Optics (Academic, New York, 2008). 6 L. Maleki, A. B. Matsko, A. A. Savchenkov, and V. S. Ilchenko, Opt. Lett. 29, 626 (2004). 7 D. D. Smith, H. Chang, K. A. Fuller, A. T. Rosenberger, and R. W. Boyd, Phys. Rev. A 69, 063804 (2004). 8 M. F. Yanik, W. Suh, Z. Wang, and S. H. Fan, Phys. Rev. Lett. 92, 233903 (2004). 9 Q. F. Xu, S. Sandhu, M. L. Povinelli, J. Shakya, S. H. Fan, and M. Lipson, Phys. Rev. Lett. 96, 123901 (2006). 10 K. Totsuka, N. Kobayashi, and M. Tomita, Phys. Rev. Lett. 98, 213904 (2007). 1
IV. SUMMARY
X. D. Yang, M. B. Yu, D. L. Kwong, and C. W. Wong, Phys. Rev. Lett. 102, 173902 (2009). 12 S. Zhang, D. A. Genov, Y. Wang, M. Liu, and X. Zhang, Phys. Rev. Lett. 101, 047401 (2008). 13 N. Papasimakis, V. A. Fedotov, N. I. Zheludev, and S. L. Prosvirnin, Phys. Rev. Lett. 101, 253903 (2008). 14 P. Tassin, L. Zhang, T. Koschny, E. N. Economou, and C. M. Soukoulis, Phys. Rev. Lett. 102, 053901 (2009). 15 N. Liu, L. Langguth, T. Weiss, J. Kastel, M. Fleischhauer, T. Pfau, and H. Giessen, Nat. Mater. 8, 758 (2009). 16 C. Kurter, P. Tassin, A. P. Zhuravel, L. Zhang, T. Koschny, A. V. Ustinov, C. M. Soukoulis, and S. M. Anlage, Appl. Phys. Lett. 100, 121906 (2012). 17 L. Novotny, Phys. Rev. Lett. 98, 266802 (2007). 18 E. Prodan, C. Radloff, N. J. Halas, and P. Nordlander, Science 302, 419 (2003). 19 K. Bergmann, H. Theuer, and B. W. Shore, Rev. Mod. Phys. 70, 1003 (1998). 20 V. J. Sorger, Z. Ye, R. F. Oulton, Y. Wang, G. Bartal, X. Yin, and X. Zhang, Nat. Commun. 2, 331 (2011).
155148-4