Mapping the Product Development Process for dysfunction identification Sarah El Gamoussi, Roberta Costa Affonso, Vincent Cheutet, Adrien Lelievre
To cite this version: Sarah El Gamoussi, Roberta Costa Affonso, Vincent Cheutet, Adrien Lelievre. Mapping the Product Development Process for dysfunction identification. International Design Conference - DESIGN 2014, May 2014, Dubrovnik, Croatia. International Design Conference - DESIGN 2014.
HAL Id: hal-01192852 https://hal.archives-ouvertes.fr/hal-01192852 Submitted on 4 Sep 2015
HAL is a multi-disciplinary open access archive for the deposit and dissemination of scientific research documents, whether they are published or not. The documents may come from teaching and research institutions in France or abroad, or from public or private research centers.
L’archive ouverte pluridisciplinaire HAL, est destin´ee au d´epˆot et `a la diffusion de documents scientifiques de niveau recherche, publi´es ou non, ´emanant des ´etablissements d’enseignement et de recherche fran¸cais ou ´etrangers, des laboratoires publics ou priv´es.
INTERNATIONAL DESIGN CONFERENCE - DESIGN 20 2014 4 Dubrovnik - Croatia, May 19 - 22,, 2014. 20
MAPPING THE PRODUCT DEVELOPMENT PROCESS FOR DYSFUNCTION IDEN IDENTIFICATION TIFICATION S. El Gamoussi, R. Costa Affonso, V. Cheutet and A. Lelievre Keywords: process rocess mapping, dysfunctions dysfunctions, product development development process, rocess, lean
1. Introduction Since the 70's, industrial growth continues to increase. The competition between companies to answer customer requirements becomes more and more important: best quality products with a low delay dela and cost. In this context, manufacturers are focused on finding ways to improve production systems, increasing productivity while reducing the lead time and costs. The "Toyota Production System" (TPS) method is recognized for such objectives [Womack and Jones 1996]. 996]. With this method, Lean Management approach was born: it aims at controlling the value chain, eliminating the largest number of non-value non value added operations which represent waste [Ohno [Oh 1988]. 988]. Despite progress achieved in production through appli application cation of such approach, it should be noticed that the production phase strongly depends on the upstream phase: design. Any delay or inadequate decision occurring during the design phase will impact the production phase in terms of delivery lead time, prod product uct quality, maintenance organization, etc. [Schomberger 1982] 982] shows that 85% of defects that occur during manufacturing phase are linked to decisions taken in the early development phase. This means that the opportunities of improvement in design phase are are important. However, to improve the PDP PDP,, it is necessary to better understand this process in terms of different flows, executed activities, required knowledges, interactions between different departments, decision making, and other specificities of PDP, in order to identify dysfunctions and define actions to eliminate them. Indeed, this process is very complex to model due to its human activities largely driven by knowledge [Tomiyama et al. 2009] 009] and the important amount of information exchanged during it. it Thus, too analyse and improve the PDP performance performance,, we need a mapping tool which represents the specificities of this process. The existing tools dedicated to the PDP focus in the flow represention and so, they are not completely adapted to the specificit specificities ies described above above. This article propose a process mapping tool which takes into account the different characteristics of PDP, with the purpose to highlight the dysfunctions considered as wastes in such process. This tool has been applied in an industrial environment for validation. This article is structured as follow. In the second section we define the requirements for the process mapping tool in the PDP context. The third section gives details on the proposed process pro cess mapping tool for PDP, and its application in an industrial case is proposed in the fourth section. Finally, we present the conclusions and future works associated to this proposition.
2. Requirements for process mapping for PDP 2.1 Criteria proposed ffor or the development of the process mapping tool This articl article focuses on improving the PDP through a mapping of the PDP activities. In Lean manufacturing manufacturing, Value Stream Mapping tool is used to draw all the information and material flows, that
DESIGN ORGANIZATION AND MANAGEMENT
1521
helps to analyse the process, detect the value added activities and minimizing wastes to improve the manufacturing process. The concept of this tool can be applied to the mapping tool for the PDP, but differences between the PDP and the manufacturing process should be considered to adapt this approch to PDP. [Morgan and Liker 2006] give an idea of some of the differences between these two process. Table 1. Comparaison betweeen Product Development Process and Manufacturing Process [Morgan and Liker 2006] Product Development Process Virtual Data Flow Weeks and months Primarily Knowledge Work Nonlineair and multidirectional flows Large, very diverse group of technical specialists
Traditional Manufacturing Process Physical product flow Seconds and minutes Physical manufacturing Linear evolution Primarily manufacturing organisation
Addressing these differences between PDP and manufacturing process, it is necessary to adapt the mapping tool to the design environment where the virtual data flows are strongly present. According to [Ulrich and Eppinger 1995], "Product development is the set of activities beginning with the perception of a market opportunity and ending in the production, sale, and delivery of a product". This is why mapping tool should Focus on process by representing the flows generated in the PDP in terms of process where the steps are presented sequentially and chronologically. This representation allows us to follow step by step the progress of the process from the beginning to the end. Flows generated in PDP are essentially virtual [Morgan and Liker 2006], [Yang et al 2008], [Hall et al. 2009]. They represent data and information about the product and decision making. The lack of useful information at the right time can often introduce a lot of loops delaying the process. This is why communication and information flows in PDP have to be detailed and analyzed in order to be improved. The mapping tool should represent the Immaterial flow. In this immaterial flow we distinguish between execution and decision-making activities that often arise in for instance choosing the appropriate technology for the product, its industrialization, the choice of the team and the project manager, the selection of product family and variables to develop, etc. [Krishnan and Ulrich 2001] adopted the idea that product development is a deliberate business process involving multiple decisions and they called them decision perspective. To take a good decision, the elements (objectives, decision variables, constraints, information) necessary for this activity must be clearly defined. If it is not the case, we can take a bad decision which will generate a rework later in the PDP, or the decision can be delayed increasing the time to market. Hence, Decisions activities must be represented in the mapping tool. According to [Morgan and Liker 2006] in their comparison between PDP and the manufacturing process, they argue that during the PDP, group of people coming from different departments, with different levels of knowledge and competence work on distinct stages of this process. The deliverables of each work group is a trigger for another one. A good communication mechanism is necessary to achieve a fluid flow. However, in product development environment, departments are still compartmentalized [Cusumano and Kentaro 1998], [Keyte and Locher 2004], and it slows down the PDP. Moreover, people participating to the PDP use some tools (like software, documents, machines) as support of their work. If this tool is not very effective, or ergonomic or well configured, it can make access to information difficult and slow. Thus, it is important that the mapping tool is able to present these different Interactions to analyse them and detect the main dysfunctions blocking the communication. Reworking deliverables due to changing targets, waiting for long lead time activities to finish, moving to look for information, all of these make the time of PDP longer [Oehmen & Rebentish 2010]. [Morgan and Liker 2006] compares the temporal measures in PDP which are often calculated in weeks, months, and even years as opposed to minutes and seconds in manufacturing process. The authors argue that "the continually achieving time to market is a system level goal of high-performance PD systems". It is not a common practice in the PDP, where the activities are not repetitive and loops
1522
DESIGN ORGANIZATION AND MANAGEMENT
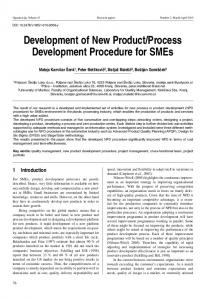
of activities exist, and it is so difficult to define a standard lead time. Nevertheless, it is crucial to be able to estimate such lead time in order to control the PDP. So the mapping tool should to focus on temporal measures measures. Visual management is based on transparency of data to improve responsiveness of the identified problems. So, a Standard Graphical Presentation is required to achieve a common and easier language to facilitate communication and understanding of the process [Wu 1996], 996], [Singh et al 2006]. But, to draw graphically the PDP and taking into account the nonlinear and multidirectional virtual data flow [Morgan and Liker 2006], 006], various decisional and informative loops, different interactions, make the mapping of all inputs and outputs of this process difficult to be represented in one map. Hence, applying a Multilevel Mapping M is recommended and it allows the representation of the most general level of the process, till the most detailed level. In building the DAPD DAPDP P (Dysfunctions Analysis of Pro Product duct Development Process), Process) we considered the seven criterias: Focus on process, Immaterial flow, Decisions activities activities, Interactions, Temporal Measures, Standard Graphical Presentation and Multilevel Mapping. [Gero 1990] 990] proposes three levels of design: Routine Design, Design based on existing design prototypes, Innovative Design Design, which can be defined as "a a non routine design that proceeds within a well-defined well state of potential designs designs",, and the Creative Design Design, which is a non routine design that can be extending ing or moving the space of potential designs designs.. Assuming that each design project is unique, there is necessarily a part of innovation (second or third type) supported by one or more trades. [Skarka 2007], 007], [Bluntzer et al. 2009] estimate that 80% of the tasks tasks of a design process are routine tasks. In this context, tthe he DAPD DAPDP aims to map the PDP in order to improve the routine activities. Before presenting the DAPDP,, we will analyse in the next section the most pertinent existing tools for process mapping mapping,, in order to identify their the strengths and their the weakness weaknesses. 2.2 Existing mapping tools 2.2.1 Product Development V Value alue Stream Mapping ((PDVSM) VSM) The manufacturing Value Stream Mapping (VSM) [Rother Rother and Shook 1998]] is used to understand the flow of material and in information formation in the manufacturing processes. But But, in n its original form, form, VSM is difficult to apply to PDP.. However, However [Morgan Morgan 2002] has adapted VSM to this process and he called Product Development Value Stream Mapping (PDVSM). This tool is focus on process and it allows to model the decisional and informative flow through the PDP. It considers standard symbols for each type of activity and it identifies information for each activity as well as the time measure. PDVSM maps both executive and decisional activities, activities but it represents only information about inputs and outputs. However, decisional activities and interactions are not detailed. Also, PDVSM represents the product development process in one map, but in a complex process it becomes difficult to visually an analyze alyze a condensed map.
Figure 1. 1 Example of PDVSM [McManus McManus 2005]
DESIGN ORGANIZATION AND MANAGEMENT
1523
2.2.2 BPMN Business Process Model and Notation language is a graphical representation used for specifying business processes in a business process model, very similar to activity diagram from UML. The main objectives of such language are to create a standard of communication between all actors inside an organization, and to ensure a bridge between the business process design and process [OMG 2010], [Chinoso and Trombetta 2012]. By nature, BPMN is designed for process, either physical or information one and include capacities for modelling human interactions, time measure and for multilevel representations. Nevertheless, such capacities, even if the version 2.0 increases them, are not sufficient to analyze added-value in the process. Moreover, the decisions are not completely modelled in BPMN: for instance, the gateway elements do not allow a precise modelling of information needed to perform the choice. 2.2.3 IDEF0 NIST [1993] presents IDEF0 as a tool used to describe the project tasks and their interactions. Moreover, this method is used to describe the system in order to explore, create, or modify it, including the parts that constitute the system, the purpose and the operation of each part, and the interfaces between the various parts, in the idea that a system is not just a collection of independent elements, but a structured organization of these in a specific purpose. The method is based on two principles: Proceed by top-down analysis: it is used to analyze the process from the highest level, which is often general and abstract, to the lowest and most detailed level in a gradual manner, describing all the usefulness of the existence of the system, the functions that must complete the necessary means of implementation and finally the process of realization. Define the scope of the analysis: it is necessary to specify the context and limitations of the system and determine the purpose of the analysis before starting the system description. The IDEF0 model consists on stacking levels. The first level represents a general and abstract view of the process, then it is divided into sub-functions to better analyze the structure of the system. This decomposition must appear three to six maximum elements or boxes that represent activities. At each decomposition, the previous box becomes a mother. These activities are linked by arrows representing constraints between them without giving information on the interactions and the chronological order of activities. So, IDEF0 does not represent the system studied in a process representation. This model does not represent the decisional activities in the process and it does not allow the estimation of lead time. 2.2.4 GRAI method The GRAI method [Doumeingts 1984] is a structured approach to business modelling to design or redesign an industrial or service production system. This method focuses on the decisional part of the system to improve its performance. This approach uses graphical formalisms for better representation and interpretation of the activities of the studied system. The model GRAI is composed of the GRAI grid and GRAI network. According to our study, we focus on the GRAI network that detail each decision centre by giving information about triggers, supports, objectives, decision variables, constraints, criteria and results. This network defines two types of activity: executive and decisional. The GRAI network presents the process as a chronological sequence of executive and decisional activities. It focuses particularly on the analysis and design of decision support systems. It provides a structured approach. However, GRAI network does not represent the multiple interactions between activities and the time measure. 2.2.5 Synthesis The complexity of the PDP, which is due to the various actors in this phase, the different interactions between stages and the existing of a virtual flow, makes the process modelling difficult to detail the whole system in one level like VSM and PDVSM. Hence, the need of a tool that analyzes the system studied by using different levels of detail, that clearly represent each stage of the process. This
1524
DESIGN ORGANIZATION AND MANAGEMENT
principle is presented in IDEF0 method. However, IDEF0 is a limited tool to meet our needs in modelling activities of product development because it does not represent sequential activities, and the time measure. BPMN is designed for process. It maps the process in a multilevel view and represents the time measure. But, BPMN does not focus on decision activities. This last point is considered in the GRAI network method. It provides a structured approach, which represents the essential decision elements. For our study, the GRAI network is the most appropriated tool to represent the executive and decisional activities in PDP. The currently version of the GRAI Network, the time measure is not represented, but it is not difficult to adapted this method to this need. To perform an activity, the actor collects necessary information in order to propose an efficient technical solution. To do it, he/she interacts with several actors and support tools of different departments. So, the waiting time to receive data from other actors or tools will impact the time to market. Then, it is very important that the mapping tool for the PDP could represent these interactions in order to indentify dysfunctions and then indentify the source of the delay (waste). In the following table, we summarize the evaluation of modelling tools studied here. We have used the following evaluation scale: -1: the tool does not represent the criteria and it is impossible to integrate it; 0: the tool does not meet the criteria but it is probably possible to adapted it; 1: the tool meets the criteria quite well, but it needs to be improved; and 2: the tool meets the criteria very well. Table 2. Comparison of process mapping tools (scale from -1 to 2) Tools GRAI Network BPMN IDEF0 PDVSM
Focus on Process
Design decision
Immaterial flow
Interactions
Time measure
Multilevel representation
Graphical presentation
2
2
2
0
0
0
2
2 -1 2
1 -1 1
2 1 2
0 -1 0
1 0 2
0 2 0
2 1 2
According to this analysis of mapping tools, we notice that there is no mapping tool that is very well adapted to the PDP needs. In the next section, we will present the proposed Dysfunction Analysis of Product Development Process tool which meets the above criteria to first facilitate the understanding of complex PD flow, and second to help the users to identify activities with potential improvements.
3. Proposition of Dysfunction Analysis of Product Development Process tool According to the criteria and the synthesis bellow, we propose a Dysfunction Analysis of Product Development Process (DAPDP) tool that is composed of three levels (Figure 2): Level I: This level aims at giving an overview of a complete product development process by providing the sequence of major executive and decisional steps. The main purpose is so to analyze the entire process in order to first provide improvement and secondly to concentrate on major steps for further analyse. Level II: This level aims at representing the sequence of execution activities and decisionmaking ones, by focusing on the trigger, supports implementation, objectives, constraints, decision variables, results and completion time. At the consequence, this level allows to analyze in detail the step selected in the previous level in term of execution or decision activities. Such analyze may first enlighten activity improvements and second focus on major activities for further analyse. Level III: this level aims at representing the diagram of existing interactions between the various actors and tools in the activity defined at the previous level. Such analysis allows detecting sources of delay and dysfunctions in activities at the more precise level. 3.1 Level I In order to provide a global overview of the process, we choose for the first level a representation close to the PDVSM model and BPMN one. We so propose a model for the information and decision flows between the principal steps of the PDP, by distinguishing (Figure 3):
DESIGN ORGANIZATION AND MANAGEMENT
1525
Actions (green arrows) in which we specify the deliverable (inside the arrow), the main support to realise the action (on the arrow) and the average duration (below the arrow), Decision centres (red diamonds) in which we specify the actor in charge of the decision (inside the diamond) and the skills required to take the decision (below the diamond), Sending and reception centres (blue square) in which we specify the actor require as sender or receiver.
Figure 22. Dysfunction Analysis of Product Development Process tool: a global overview This overall view allows first to share a common understanding of the process between all the t team actors participating in this improuvement project project,, second to detect global dysfunctions in the process (unrequired loop, decision omission, etc.) and last to enlighten major routine steps in which dysfunctions regularly happen (execution time is to too o important relatively to the PDP PD lead time and its intrinsic value for instance), then applying the next level for more detailed analysis. In the following example (Figure 3) we applied the Level I of the DAPDP to a part of Eurofa Eurofarad PDP. The exercise xercise was realised with the product development team, actors from other departments that interact with the PDP, and supervised by a DAPDP expert. The choice of activities to be detailed in the Level II of DAPD DAPDP is guided by the time indicator and expertise of actor actors: s: as long activity does not mean that it includes dysfunctions and this is true for most of creative activities. Actually in DAPDP we focus only on the routine activities. This level enables to map the PDP and be a means of communication to actors of continuous continuous improvement in order to have more visibility into the process and areas for improvement improvement.
1526
DESIGN ORGANIZATION AND MANAGEMENT
Figure 33. Level I of Dysfunction Analysis of Product Development Process tool:: the flow overview In the example described in Figure 3, a customer asks for a new design (Innovative Design) and the design team has normally one week to propose a feasibility study with consistent direct costs and delivery lead time. In this example, the creation process of the mapping allows to first identify a lack of reception centre clearly defined at the end of the technological solution proposal action, and second to identify two actions with a too long lead time according to the global expected one: the technological solution proposal and the calculation of direct cost and ti time. me. For the following, we select the action action: "Proposal Proposal of technological solution solution" to analyze in further details. 3.2 Level II In this level, we detail the selected step from level I by using an extension of the GRAI Network (Figure 4). We so create modelss for the execution and decision-making decision making operations with a more precise point of view. This model gives information on all the data flow, trigger, and support to execute the activity, conditions, constraints, decision variables and result represented. The analysis analysis of the model concludes on the completeness and consistency of information required and generated during each operation.
Figure 4. Level II of Dysfunction Analysis of Product Development Process tool:: the decision analysis network Moreover, we add tto the GRAI Network two time indicators: Ti indicates the completion time of operation i, and C represents the cumulative duration of the process until the operation i. Such indicators may emphasiz emphasizee dysfunctions on the treatment of information in the concerned activity. In the example described in Figure 4, the technological solution proposal action is detailed, with two execution operations and one decision operation. During the model creation process, we identify in the decision operation a gap betwe between en the ideal objective (("Optimal Optimal product product")) and the current one ("Find ( a product that meet needs needs"). ). Moreover the time spent on such a routine operation has been identified as too important according to the expected complexity of the task. As a consequence, the different interactions with the workstation to take decision of choosing the raw material will be more analysised analysis at level III.
DESIGN ORGANIZATION AND MANAGEMENT
1527
3.3 Level III At level III, the interaction diagram models all existing interactions between the selected workstation and thee various supports used to achieve the activity (Figure 5). These supports may be other workstations of the same department or in other services and it can also be a tool for the realization of the task on the workstation
.
Figure 5. Level III of Dysfunction Dysfunction Analysis of Product Development Process tool:: the interaction diagram Each interaction is evaluated by the triple indicator: Criticality, Availability and Time. Table 3 illustrates the value scale chosen for the criticality and availability indicators. This triple indicator can highlight existing dysfunctions in supports that can delay the activity. Table 3. 3 Value scale for level III indicators Indicator value Criticality
Availability
1 Information is only indicative for the activity realisation Information is available at the requested workstation and ready to be transferred
2 The activity can be realized with a good estimation of the information Information should be developed by the the requested workstation
3 The activity cannot be performed without the precise information Information does not exist in the requested workstation
Figure 5 details the decision operation selected at level II ("Choice ( Choice of a raw material") material ) and modelled at the level II. In this example, in order to choose the optimal raw material, material, the designer has to select the best raw material among the ones that are already referenced in the ERP. In this case, the information is a very critical (C=3) and available (A=1) since implemented in the ERP, but it requires a long time to get an aanswer. nswer. Such indicator reveals so a dysfunction in the communication with the ERP and an improvement workshop on such subject can been proposed.
4. Validation and discussion The DAPDP tool proposed in this article meets the criteria previously defined as following: fo Focus on process process:: Level I and Level II represent the flow of product development in a sequential and chronological chaining to have a clear vision on the process, Design decisions decisions:: The decision centres are presented at level I with a global point of view, which only shows the decision responsible and the skills required to take it, and with a more detailed point of view at Level II, Immaterial flow flow:: All levels of the proposed tool represent the information flows implicated in the execution and decision activities, Interactions Interactions:: Level III analyzes the different interactions between the caller station and other supports (internal or external positions, computer tools, ...), and the triple indicator (Criticality, Availability and Time) helps to det determine ermine the root sources of dysfunctions at that level,
1528
DESIGN ORGANIZATION AND MANAGEMENT
Time measure: The tasks execution time is represented in the three levels of the proposed tool, it estimates the time spent in each routine activity to evaluate its relative contribution to the global PDP lead time, Multilevel representation: The proposed tool is composed of three levels to navigate from the general overview, which represents general information about the process (Level I), to more detailed models (Level II and II) that give more precise information, Graphical representation: This tool is based on graphical conventions used in a large number of visualisation tools and each recognized to be ergonomic. As part of this industrial PhD thesis, we have the opportunity to evaluate the tool within Eurofarad company. This company is specialized in the design and manufacture of high-tech products with a controlled reliability: capacitors, filters, precision mechanics, sensors, potentiometers, slip rings and wound magnetic components (transformers, inductors, motors or sensors). One of the characteristics of the company is to develop products on demand and Eurofarad searches for better controlling and improving such product development process to improve its customer satisfaction indicator (Quality, Price and Time to market). The weakness of Eurofarad is that the contractual date is often not met. Currently, we have deployed the DAPDP tool to one unit of product development and we are currently implementing it in the other three units. This deployment phase allowed the design department to: Gather product development staff in building DAPDP and discussing together on the process flow, creating so a shared and improved understanding of the department organization, Make the actors discuss of the level I model and determine the steps representing a potential for improvement, Thorough analysis of design steps ( repetitive operations) selected from level I using the level II and III allowed to identify some sources of process dysfunctions, Conduct improvement workshop on identified sources, Strengthen communication between the design department and other support departments (procurement, manufacturing, etc.) with the objective to ensure the right information at the right time, Globally reduce the design lead time.
5. Conclusion Following the potential of improvement existing in PDP, a thorough analysis tool is required to identify sources of dysfunctions in this process in order to improve it and so reduce the time-tomarket. In this article we propose the DAPDP, a tool that models the PDP to detect dysfunctions. Based on a multilevel representation of the PDP allowing a multicriteria analysis, the tool aims at modelling information and decision flows. Level I creates models for the major stages of execution and decision centres to propose a general view of the process. Then, level II analyzes in more details the selected routine steps from level I, by highlighting the execution and decision operations and especially the completeness and the consistency of information required and generated by such operations. Finally, level III studies interactions between the workstation selected at level II and other supports necessary for the achievement of the task (internal stations, external stations, software ...). The proposed tool is currently deployed in an industrial environment and it leads to satisfying results both in terms of dysfonctions identifitication and of appropriation by the members of the organization. The application of DAPDP, allowed a better undestanding of the PDP. The next step of our research work is exploit the results of the application of DAPDP to analyse the different aspects value in PDP in order to define it and then adapt the DAPDP in a Value Strem Mapping tool for PDP. The objective is to insert this work in the Lean Product Development approach. References Bluntzer, J. B., Sagot, J. C., Mahdjoud, M., "Knowledge Based Enginerring Approach Through CAD Systems: Result of two years of experimentation in an industrial design office", Acts de la conference CIRPDesign, Cranfield, 2009.
DESIGN ORGANIZATION AND MANAGEMENT
1529
Browning, T. R., Deyst, J. J., Whitney, D. E., "Adding Value in Product Development by Creating information and reducing risk", IEEE Transactions on Engineering Management, 2002. Chinosi, M., Trombetta, A., "BPMN: An introduction to the standard", Computer Standards & Interfaces, Volume 34, No. 1, 2012, pp. 124-134. Cusumano, M. A., Kentaro, N., "Thinking Beyond Lean", The Free Press, New York, 1998. Doumeingts, G., "Méthode GRAI : méthode de conception des systèmes en productique", PhD thesis Université de Bordeaux I, France, 1984. Gero Johns S., "A Knowledge Representation Schema for Design", AI Magazine, Volume 11, Issue 4, 1990, pp. 26-36. Hall, A., Lamouri, S., Costa Affonso, R., "Lean Product Development Theory", Proceedings of International Conference on Software, Knowledge and Information Management and Application (SKIMA 2009), Fes (Morocco), 2009. Keyte, B., Locher, D. A., "The Complete Lean Entreprise: Value Stream Mapping For Administrative and Office Processes", Productivity Press, 2004. Krishnan, V., Ulrich, K. T., "Product Development Decisions : A Review of the Literature", Management Science, Vol. 41, No.1, 2001. McManus, H. L., "Product Development Value Stream Mapping (PDVSM) Manual", Lean Aerospace Initiative, 2005. Morgan, J. M., "High Performance Product Development: A Systems Approach to a Lean Product Development Process", PhD. Thesis in Industrial and Operations Engineering, The University of Michigan, 2002. Morgan, J., Liker, J. K., "The Toyota Product Development System: Integrating People, Process, and technology", Productivity Press, 2006. National Institute of Standards and Technology (NIST), "Integration DEfinition for Function modeling (IDEF0)", 1993. Object Management Group (OMG), "Business Process Model and Notation (BPMN)", http://www.omg.org/spec/BPMN/2.0/Beta2/, 2010. Ohno, T., "Toyota Production System: Beyond Large-Scale Production", Productivity Press, 1988. Rother, M., Shook, J., "Learning to See - The Lean Entreprise Institute", Lean Enterprise Institute, 1998. Schomberger, R. J., "Japanese manufacturing techniques : nine hidden lessons in simplicity", Macmillan, 1982. Singh, R. K., Kumar, S., Choudhury, A. K., Tiwari, M. K., "Lean tool selection in a die casting unit: a fuzzybased decision support heuristic", International Journal of Production Research, Vol. 44, No. 7, 2006, pp. 13991429. Skarka Wojciech., " Application of MOKA Methodology in Generative Model Creation Using CATIA", Engineering Applications of Artificial Intelligence, Volume 20, Issue 5, 2007, pp. 677-690. Tomiyama, T., Gu, P., Jin, Y., Lutters, D., Kind, Ch., Kimura, F., "Design methodologies: Industrial and educational applications", CIRP Annals – Manufacturing Technology, Vol. 58, No. 2, 2009, pp. 543-565. Ulrich, K., Eppinger, S.D., "Product Design and Development", McGraw-Hill, Inc., New York, 1995. Vernadat, F.B., "Enterprise Modelling and Integration: Principles and Applications", Chapman & Hall, London, 1996. Womack, J. P., Jones, D. T., "Lean Thinking", Simon & Schuster, New York, NY, 1996. Wu, B., "Manufacturing Systems Design and Analysis", Springer, 1996. Yang, W. Z., Xie, S. Q., Ai, Q. S., Zhou, Z. D., "Recent development on product modeling: a review", International Journal of Production Research, Vol. 46, No. 21, 2008. Sarah El Gamoussi, Ph.D. student LISMMA-SUPMECA 3 Rue Fernand Hainaut, 93400, Saint-Ouen, France Email:
[email protected]
1530
DESIGN ORGANIZATION AND MANAGEMENT