1
Journal of Alzheimer’s Disease xx (20xx) x–xx DOI 10.3233/JAD-180225 IOS Press
Pr oo f
Mapping the Proxies of Memory and Learning Function in Senior Adults with High-performing, Normal Aging and Neurocognitive Disorders Hanna Lua,b,∗ , Xi Nic , Ada W.T. Fungd and Linda C.W. Lama a Department
of Psychiatry, The Chinese University of Hong Kong, Hong Kong SAR, China
b Guangzhou Brain Hospital, The Affiliated Brain Hospital of Guangzhou Medical University, Guangzhou, China c Department d Department
of Sociology, The Chinese University of Hong Kong, Hong Kong SAR, China of Applied Social Sciences, The Hong Kong Polytechnic University, Hong Kong SAR, China
d
Accepted 9 May 2018
C
or
re c
te
Abstract. Background: Memory and learning, as the core brain function, shows controversial results across studies focusing on aging and dementia. One of the reasons is because of the multi-faceted nature of memory and learning. However, there is still a dearth of comparable proxies with psychometric and morphometric portrait in clinical and non-clinical populations. Objective: We aim to investigate the proxies of memory and learning function with direct and derived measures and examine their associations with morphometric features in senior adults with different cognitive status. Methods: Based on two modality-driven tests, we assessed the component-specific memory and learning in the individuals with high performing (HP), normal aging, and neurocognitive disorders (NCD) (n = 488). Structural magnetic resonance imaging was used to measure the regional cortical thickness with surface-based morphometry analysis in a subsample (n = 52). Results: Compared with HP elderly, the ones with normal aging and minor NCD showed declined recognition memory and working memory, whereas had better learning performance (derived scores). Meanwhile, major NCD patients showed more breakdowns of memory and learning function. The correlation between proxies of memory and learning and cortical thickness exhibited the overlapped and unique neural underpinnings. Conclusions: The proxies of memory and learning could be characterized by component-specific constructs with psychometric and morphometric bases. Overall, the constructs of memory are more likely related to the pathological changes, and the constructs of learning tend to reflect the cognitive abilities of compensation. Keywords: Capacity, cortical thickness, learning, retention, working memory
INTRODUCTION Advances in modern medicine have led to increase in life expectancy, and thus an increase in the ∗ Correspondence
to: Dr. Hanna Lu, Department of Psychiatry, G/F 27, Multicenter, Tai Po Hospital, The Chinese University of Hong Kong, Tai Po, Hong Kong SAR, China. Tel.: +86 852 2831 4305; Fax: +86 852 2667 5464; E-mail:
[email protected].
incidence and prevalence of age-related pathologies, such as Alzheimer’s disease (AD) [1]. As study on AD has progressed, it has become increasingly necessary to decode its complex functions and develop domain-specific indicators for detecting early stage AD. Among the core cognitive domains, a functional deterioration in memory and learning has been asserted as an early sign of cognitive changes
ISSN 1387-2877/18/$35.00 © 2018 – IOS Press and the authors. All rights reserved
H. Lu et al. / Proxies of Memory and Learning
METHODS Experiment 1: Psychometric decoding of WM and learning constructs Participants We recruited 488 community-dwelling adults aged from 65–85 years from another cohort study [12]. A structured neuropsychological battery was administered to evaluate global cognition and the core domains of cognitive function [13]. We used Alzheimer’s Disease Assessment Scale-Cognitive subscale (ADAS-Cog), Montreal Cognitive Assessment Hong Kong version, Cantonese version of Mini-Mental State Examination (CMMSE), and Clinical dementia rating scale (CDR) to evaluate global cognition. Core domains of cognitive function included [14]: 1) Complex attention: trail making test part A and digit span forward (DSF); 2) Conceptualization: recognition of the abstraction with similarity and difference; 3) Language: Category verbal fluency test; 4) Perceptual-motor function: the participants performed the commands as “tap each shoulder twice with two fingers keeping your eyes shut”; 5) executive function: trail making test part B; 6) Learning and memory: immediate recall, delayed recall and word recognition. We used the Cumulative illness rating scale for geriatrics to evaluate the cerebrovascular risks, including the presence and severity of heart diseases, hyperlipidemia, diabetes mellitus, atrial fibrillation, hypertension, and anemia [15]. We evaluated the severity of depressive symptoms and sleep disorders with Cornell scale for depression in dementia [16] and Pittsburgh sleep quality index [17] separately. We used activities of daily living scale to assess the everyday functioning [18]. All the measurements were conducted with Chinese instructions. Criteria for selection of high-performing (HP) elderly, the cases with normal aging and NCD are as follows: 1) HP elderly were determined by the scores of global cognition. This ensured that the subjects were divided by a measure relevant to the current study without directly biasing the results toward the domain of interest; 2) Normal aging: the cases with the scores of cognitive performance within 1.5 standard deviation (SD) of age and education matched normative values derived from our cohort study [12], of which present with CMMSE score greater than 28 and CDR score equal to 0; 3) Minor NCD patients were defined as [4]: evidence of modest decline in
C
or
re c
te
d
associated with aging and employed as an indicator to predict AD conversion [2, 3]. According to the Diagnostic and Statistical Manual of Mental Disorders, Fifth Edition (DSM-5), learning and memory serves as the central diagnostic factors in neurocognitive disorder (NCD) [4]. Within the domain of memory, working memory (WM) is responsible for providing access to the information required for the ongoing cognitive processes, even higher-level brain functioning [5]. Based on Baddeley’s model, the hierarchical structure of WM consists of two systems: 1) the executive-control system and 2) two “slave” systems as that severs as phonological loop and visual sketchpad to selectively process information from different sensory inputs [6]. Given its complexity, the components of WM, including sensory memory and executive memory, have been characterized with modality-driven properties and reported to differ between the cortical regions and WM tasks [7]. For instance, the prefrontal cortex (PFC) and parietal cortex are reported to engage in visuospatial WM tasks [8]; the dorsolateral PFC shows higher activity the during delayed recall test [9]. Similarly, this phenomenon has also been found in the performance of learning function, including spatial learning, motor learning, and perceptual learning; the results vary considerably across individuals and tasks [10]. Regarding the controversial and contemporary topic of component-specific WM and learning, a number of concerns have emerged: 1) WM is implemented in the learning process, which makes the function of WM and learning difficult to quantitatively measure. 2) The indices of WM and learning show great heterogeneity across a variety of clinical populations, particularly in cases with cognitive deficits [11]. 3) Based on the sources of incoming information, WM can be evaluated by modality-driven measures that have similar patterns in the individuals with different cognitive status. Collectively, there remains a dearth of data on component-specific constructs of WM and learning derived from modality-driven tests and to what extent the constructs are related to cortical morphometric features. Hence, the current study had two interlinked aims: 1) the primary aim was to investigate the visual and verbal WM and learning function in high-performing seniors, normal aging and NCD; and 2) the secondary aim was to detect the neural underpinnings of the WM and learning constructs.
Pr oo f
2
H. Lu et al. / Proxies of Memory and Learning
Indices of memory and learning The number of words reproduced over each trial is used as the direct score of immediate recall (IR) [21]. We addressed two commonly used indices of delayed recall (DR): 1) the raw number of words recalled on DR trial; 2) the relative number or proportion of words recalled on DR trial compared with the number of words recalled on trial 3 or on the post interference recall trial. Derived scores of word-list learning test includes five indices: 1) Short-term percent retention (STPR) is expressed as the number of words recalled on trial 2 divided by the number recalled on trial 3 with the formula as STPR = 100 × (Sum trial 2 recall / Sum trial 3 recall) [22]. 2) Long term percent retention (LTPR) is expressed as the number of words recalled on DR trial divided by the number of words recalled on trial 3 with the formula as LTPR = 100 × (Sum DR / Sum trial 3) [23]. 3) Working memory capacity (WMC) is a construct of memory reflecting the limited capacity of an individual’s WM, which is calculated as the average span of immediate recall and DSF with the formula as WMC = (Sum of trial 3 + DSF) / 2. 4) Forgetting rate (FR), as the adjusted difference between trial 3 and DR trial, is calculated with the formula as FR = (Sum trial 3 recall - Sum DR) / Sum trial 1 recall [24]. 5) Recognition memory for words (RMW): three trials with a two-choice format, consisting of twelve unrelated words as stimuli, and each stimulus word is paired with one equally distinctive distractor word for each trial. Number of error is used as the score of RMW. Greater score of RMW trial refers to the worse performance of recognition memory. As to the proxies of learning, we also developed direct and derived measures based on word-list learning, including: 1) Initial leaning: the number of word recalled on trial 1 [25]. 2) Best learning: the number of word recalled on trial 3 [25]. 3) Total learning is calculated as the sum of the number correctly recalled from trial1 to trial 3 [26]. 4) Verbal learning is operationalized by evaluating the difference between the number of correctly recalled words on a list learning task on the last trial compared with the first trial [27]. 5) Learning over trials (LOT) is computed by taking the sum of correctly recalled across the trial 1 to trial 3 corrected for mean word span, as the formula: LOT = (Sum of trial 1 to 3) - 3 × (Sum of trial 1). LOT is proposed to represent the ability to improve
te
d
Ethics approval and consent to participate Ethics approval was obtained from the Joint Chinese University of Hong Kong - New territories East Cluster Clinical Research Ethics Committee (Joint CUHK-NTECCREC). Written informed consent from all participants was obtained before the assessment.
is repeating the sequence of location in reverse order.
Pr oo f
one or more cognitive domains, which was set as ≥1.5 SD below the age- and education-adjusted normative scores; no interference with independence in everyday activities; and no comorbid major psychiatric disorders; 4) Major NCD patients were defined as [18]: CMMSE score below the local cutoff for dementia of 18 and below for illiterate elderly, 20 and below for those with one to two years of education, and 22 and below for subjects with more than two years of education. Exclusion criteria contain: 1) Past history of bipolar affective disorder or psychosis; 2) History of major neurological deficit including stroke, transient ischemic attack or traumatic brain injury; 3) Comorbidities with sleep disorders and depressive symptoms.
C
or
re c
Measurements of memory and learning We used two modality-driven neuropsychological tests to evaluate the performance of memory: Verbal modality: Digit span test, including two subtests: 1) DSF is employed to measure the number storage of WM, consisting of ten trials of verbal reproduction of a sequence of numbers in exact order as presented [19]; 2) The procedure of digit span backward (DSB) is repeating the digits in perfect order, but backward from the presentation order. A span score is computed as the best representative performance. DSF measures the verbal WM (i.e., storage capacity), whereas DSB is categorized under the executive facet of WM [20]. Word-list learning test, consisting of ten semantically non-associated words that is presented consecutively over three free trials of immediate recall (i.e., learning ability), a 20-min delayed recall (to prevent recency effects) and followed by yesno recognition (i.e., recognition memory). The raw scores of the number recalled are used to compare across groups. Visual modality: Visual span tests: 1) visual span forward (VSF) is used to measure spatial WM, consisting of ten trials of reproducing a sequence of location in exact order as presented on the paper; 2) the procedure of visual span backward (VSB)
3
H. Lu et al. / Proxies of Memory and Learning
upon trial 1 performance during each of the subsequent two learning trials [28]. 6) Learning ratio: the rate of acquisition of words over trials, calculated by the formula: (Sum of words recalled in trial i + 1- Sum of words recalled in trial i) / Sum of words recalled in trial i, in which i represents the trial number, such as 1, 2, 3. 7) Learning capacity: The comparison of the maximum number of words recalled on any trial versus the number of words recalled on trial 1 has also been developed to represent the learning capacity with initial learning and maximum learning. Experiment 2: Morphometric decoding of learning and WM constructs
re c
te
d
Participants and methods We invited 52 seniors from Experiment 1 to participate the structural magnetic resonance imaging (sMRI) study. High-resolution T1 sMRI images were acquired in the Prince of Wales Hospital using a 3.0 Tesla Philips Achieva MRI scanner (Philips Healthcare, Best, Netherlands). The acquisition of sMRI data was configured with the following parameters: axial acquisition with a 256 × 256 × 192 matrix, thickness = 1 mm, no gap, field of view (FOV) = 230 mm, TR = 2070 ms, ◦ TE = 3.93 ms, flip angle = 15 . The sequence yielded high quality isotropic images with the voxel size of 1 mm × 1 mm × 1 mm.
aging and NCD groups. Group-wise differences of demographics and neuropsychological performance were tested either with χ2 test for category variable or one-way analysis of variance (ANOVA) for continuous variables. Post-hoc multiple comparisons among means were conducted using a Tukey HSD test when ANOVA results detected significant differences among groups. We used Pearson correlation coefficient to test the relationship between memory and learning indices and cognitive function. We carried out receiving operating characteristic (ROC) analysis to evaluate the power of WM and learning indices in differentiating the seniors with different cognitive status. In the CT mapping analyses of associations with learning and WM constructs, separate linear regressions were conducted at 155,000 points on the surface of the brain through BrainSuite pipeline. Both statistical significance and correlation maps were created. To account for multiple comparisons, we performed 10,000 Monte-Carlo-style simulations in BrainSuite, which yielded information about the distribution of maximum cluster size in randomly generated maps. Given the significant clusters, we addressed them statistically significant with a familywise-error-corrected p value less than 0.05 [30]. The χ2 test, ANOVA, Pearson correlation analysis and ROC analysis were performed by IBM SPSS 20.
Pr oo f
4
C
or
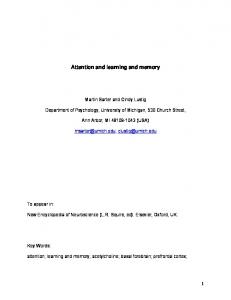
Surface-based morphometry analysis Brain morphometry including cortical thickness (CT) was analyzed individually by BrainSuite 14.0 (http://brainsuite.org/) [29]. As shown in Fig. 1, we mapped the CT based on the Automated Anatomical Labeling (AAL) template by applying the following procedures: First, we corrected the motion and removed the non-brain voxels. Second, we segmented the brain into gray matter, white matter and cerebrospinal fluid. Third, we coregistered individual’s T1 sMRI image to AAL template using a similarity transformation. Finally, we calculated the regionspecific CT as the smallest distance (in millimeters) of each point on the external cortical surface from the outermost surface of the white matter. At each step, we visually checked the outputs and manually corrected when there are segmentation errors (i.e., non-brain tissue). Statistical analyses Homogeneity of variance test was used to evaluate the equality of variances between HP elderly, normal
RESULTS Results of Experiment 1 Neuropsychological and clinical data of the whole sample were analyzed and presented as raw scores. There was no difference in age and sex across four cognitive groups (Table 1). Prominent discrepancies were found in the core domains of cognitive function. Post hoc results showed that HP elderly presented better cognitive performance than normal aging elderly did. Yet, the performance of memory and executive functioning was shown to differ markedly between HP elderly, normal aging and NCD patients. The performance of memory, IR and DR in particular, was coordinately getting worse with the severity of cognitive decline (Table 2) (Please see post hoc results in Supplementary Tables 1–6). Similarly, we found marked group-wise differences in most of learning indices, except for LOT (Table 3) (Please see post hoc results in Supplementary Tables 7–12). LOT, as the ratio of words recall at trial 1 and trial 3
5
re c
te
d
Pr oo f
H. Lu et al. / Proxies of Memory and Learning
Fig. 1. Pipeline of individualized cortical thickness (CT) mapping.
or
Table 1 Demographics and neurocognitive characteristics across four groups Normal aging (n = 205)
Minor NCD (n = 204)
Major NCD (n = 23)
F
p
69.27 ± 3.41 20/36 12.27 ± 3.98 0.31 ± 0.97 5.55 ± 3.22 0.99 ± 0.01 0.05 ± 0.14 29.55 ± 0.57 29.25 ± 0.79 55.23 ± 8.02 11.09 ± 6.21 45.17 ± 19.51
70.13 ± 4.11 80/125 9.82 ± 4.27 0.54 ± 1.89 5.71 ± 3.62 0.99 ± 0.02 0.19 ± 0.32 28.65 ± 1.05 27.59 ± 1.45 48.07 ± 8.67 12.86 ± 6.27 65.52 ± 42.91
71.04 ± 4.61 93/111 7.61 ± 4.26 0.48 ± 1.42 6.09 ± 3.49 0.98 ± 0.03 0.93 ± 0.63 27.04 ± 1.81 23.96 ± 2.69 39.88 ± 8.74 17.42 ± 10.04 93.37 ± 56.32
74.24 ± 3.75 10/13 4.65 ± 5.14 2.26 ± 3.95 7.22 ± 4.84 0.86 ± 0.12 3.33 ± 1.51 20.65 ± 2.85 16.48 ± 4.21 29.31 ± 8.19 37.89 ± 23.25 160.15 ± 52.58
3.09 2.19 28.56 7.51 1.82 91.41 153.57 238.67 278.09 84.16 54.85 32.81
0.065 0.088