Wedding of Prince William and. Catherine Middleton princ=william kate=middleton william=kate watch=royal. 8 cinco de mayo de=mayo celebr=cinco happi= ...
JAISCR, 2017, Vol. 7, No. 3, pp. 201 – 213 10.1515/jaiscr-2017-0014
MAPREDUCE AND SEMANTICS ENABLED EVENT DETECTION USING SOCIAL MEDIA Peng Yan 3M Corporate Research Laboratory 3M Corporate Headquarters3M Center, St. Paul, MN 55144 Submitted: 1st January 2016; accepted: 4th July 2016 Abstract Social media is playing an increasingly important role in reporting major events happening in the world. However, detecting events from social media is challenging due to the huge magnitude of the data and the complex semantics of the language being processed. This paper proposes MASEED (MapReduce and Semantics Enabled Event Detection), a novel event detection framework that effectively addresses the following problems: 1) traditional data mining paradigms cannot work for big data; 2) data preprocessing requires significant human efforts; 3) domain knowledge must be gained before the detection; 4) semantic interpretation of events is overlooked; 5) detection scenarios are limited to specific domains. In this work, we overcome these challenges by embedding semantic analysis into temporal analysis for capturing the salient aspects of social media data, and parallelizing the detection of potential events using the MapReduce methodology. We evaluate the performance of our method using real Twitter data. The results will demonstrate the proposed system outperforms most of the state-of-the-art methods in terms of accuracy and efficiency. Keywords: event detection, social media, semantic relatedness, MapReduce
1
Introduction
Twitter, a social networking and microblogging service, has become an important channel of communication for worldwide users in the current age of Web. It allows users to post short messages, socalled tweets, with up to 140 characters to describe “what is happening” in the real world. In addition, a user can follow other users to read their tweets, and can also be followed by others so that his/her tweets can be read. As of the first quarter of 2014, Twitter averaged at 255 million monthly active users, making it one of the most fast-growing and influential sites in the world. By publishing tweets on Twitter, users express and exchange information on various topics, ranging from their life bagatelle to national and global events. This fact makes Twitter an ever-
updating information source which could be used for event detection. In comparison to traditional media, Twitter is much swifter in discovering and broadcasting news, since each user is a real-time event sensor and broadcaster. For example, Osama bin Laden’s death was first leaked from Twitter before President Barack Obama officially announced it on TV [Sheldon Levine 2011]. Therefore, the broad coverage and quick responsiveness of social media make it promising in detecting major events. Events can be generally regarded as something that does not happen often. Event detection aims at discovering such unusual things when they are taking place. The underlying assumption of event detection research is that the event-related words normally show an increase in the usage when the event is happening [Weng et al. 2011]. The words
Unauthenticated Download Date | 6/29/17 3:31 PM
202 exhibiting a high frequency for a period of time are referred to as burst words. Therefore, a major part of the work for detecting events is monitoring the appearances of words over time, finding those related burst words and statistical patterns if any, and grouping the burst words together to see if they stand for or reveal any actual events in reality. However, detecting events from Twitter is much more challenging than doing it from other information resources such as academic papers, news articles and social streams [Zhao et al. 2007; Parikh et al. 2013; Fung et al. 2005; Kleinberg 2003], because 1) unlike traditional well-written and wellformatted document collections, tweets are particularly terse and difficult for Natural Language Processing (NLP) tools to understand [Ritter et al. 2011], since most of them contain a lot of abbreviations and misspellings of words (or phrases), and are usually grammatically and syntactically incorrect; 2) tweets are too noisy and according to a report by Pear Analytics [Pear Analytics 2009], no more than 10% tweets have any real ”pass-along value” and nearly 40% tweets are just “pointless babble,” 3) tweets are associated with time and modeling the temporal aspect of tweets is nontrivial; 4) tweets accumulates rapidly over time, making scalable and efficient algorithms in demand. In this work, we present MASEED (MapReduce and Semantics Enabled Event Detection), a system that can handle all of the aforementioned issues. In general, our method employs effective algorithms for noise removal, considers both the temporal and semantic natures of Twitter for keyword similarity estimation, and leverages state-ofthe-art techniques for big data computing. The system is built upon the software as a service (SAAS) architecture and MapReduce framework. Specifically, the detection process is as follows. We first remove noise data from the given tweets. In our system, we consider three types of data as noise: 1) non-English characters (since we are only considering English words in this work); 2) the tweets with invalid or missing creation time (since the temporal patterns of these tweets cannot be captured); 3) those less than 3 words (since it is hard to accurately model the semantics of very short sentences).Then, we build an inverted index against the cleaned data so that any statistical computation in later steps can be speeded up. After that, the detection engine starts to perform temporal and semantic analysis,
Peng Yan
and persists the discovered events into the backend database. Finally, the visualization module pulls the results from the database and shows them to users. Our contribution of this effort can be summarized as follows – Total automation of event detection. To the best of our knowledge, our approach represents a first attempt to build a fully automated event detection system. For example, the approach proposed in [Sakaki et al. 2010] needs to prepare a set of training data specifically for earthquake in advance, and [Chen et al. 2014] needs to manually build a vocabulary for the type of events to be detected. Such requirements would significantly increase the difficulty of deploying into real-world applications. Another obvious disadvantage is that such methods are limited to detecting only a certain type of events. While our system does not require any human efforts for data preparation and data preprocessing, and is able to detect any kind of events without requiring any domain knowledge. – A proposal of a new machine learning framework. The proposed approach naturally combines the linguistic and temporal features of Twitter for event detection. An effective temporal-semantic estimation model is presented for measuring the intrinsic relatedness between words. With this model, the detection accuracy is steadily above 70%. Note that this accuracy is achieved without pre-selecting relevant tweets for a target type of events as compared to [Chen et al. 2014]. – A proposal of a practically effective distributed computing platform. To the best of our knowledge, it is the first distributed event detection platform which can perform high performance computing against mass texts. We parallelize the indexing of raw tweets as well as the detection process using the MapReduce methodology. The system is able to detect major events from 3 million tweets within 30 minutes as demonstrated in the experiments. – A proposal of two-level event detection visualization. We visualize the detected events in two dimensions: one is in event level and the other is in keyword level. The event-level visualization shows what events are detected and the Unauthenticated Download Date | 6/29/17 3:31 PM
203
MAPREDUCE AND SEMANTICS ENABLED . . .
keyword-level serves as a further interpretation of each event. – Comprehensive evaluation to demonstrate the effectiveness of the proposed system. The effectiveness of the proposed system is evaluated on real Twitter datasets. The experimental results demonstrate our system outperforms existing representative solutions for event detection. The remainder of this paper is organized as follows: Section 2 describes related works. In Section 3, we discuss the proposed system in details. Experimental results are presented and analyzed in Section 4. Section 5 concludes this work and describes future directions.
2
Related Works
Event detection has been an interesting research topic for years. Before social media becomes popular, research in event detection mainly focused on well-formatted text documents, and was often associated with text classification and named entity recognition [Kumaran et al. 2004; Ritter et al. 2011]. Event detection from social media is an important topic in text mining and natural language processing. Existing methods for event detection can be classified into three categories: word frequency based approaches, topic modeling based approaches and clustering based approaches. The word frequency based approaches define weighting schemes mainly based on the number of word occurrences to measure word importance to an event. Wang et al in [Wang et al. 2013] developed a time dependent Hierarchical Dirichlet Process (HDP) model [Teh et al. 2006] for real time event detection. Basically, they use a mixture Gaussian model to extract the burst words from Twitter and then apply their time dependent HDP model to identify new events. Shamma et al. in [Shamma et al. 2011] proposed a normalized frequency model to detect words within a given time window. Due to the difficulty of capturing the complex semantics of texts and performing effective disambiguation using single word, Benhardus et al in [Benhardus et al. 2013] developed a method called “Trending Score” to extract n-grams for identifying trending topics from streaming Twitter data. Different from
the topic definition in [Gruhl et al. 2004], they define a trending topic as a word or phrase showing an increase in usage both in its long-term usage and the relative usage to others. The trending score of an n-gram is computed using the normalized frequency derived from the TF*IDF weighting scheme. Our proposed temporal model is motivated by [Benhardus et al. 2013; Shamma et al. 2011], but we define a variation of the TF*IDF weighting scheme that is able to capture the usage change of words/n-grams over time. The distribution based approaches focus on using topic model techniques to discover the core theme of a text document. [Lau et al. 2012] proposed a variation of Latent Dirichlet allocation (LDA) which periodically updates the topic model based on the previously learned model. However, when applied to noisy and short texts like Twitter data, the performance of topic modeling based methods is reduced [Guille et al. 2014; Hu et al. 2012]. Representative methods using clustering techniques for event detection include [Weng et al. 2011; Parikh et al. 2013;Li et al. 2012]. Weng and Lee [Weng et al. 2011] proposed EDCoW (Event Detection with Clustering of Waveletbased Signals), which employs wavelet analysis to provide precise measurements regarding when and how the frequency of the target signal changes over time [Kaplan et al. 2011]. By treating each word in text corpus as a signal, EDCoW is able to characterize the appearances of words over time and identify those event related words. Specifically, it builds the signal for each individual word in two stages. The first stage constructs a word vector composed of a number of signals using TF*IDF weighting scheme. The vector is sliced into several segments based on a time window specified by the user. The second stage defines a sliding window, and calculates the change of signals by moving the sliding window along the vector built in the first stage. This mechanism is able to identify the change of a word’s appearance pattern. Then EDCoW measures the similarity between two words by computing their cross correlation and generates a correlation matrix to represent the similarity between any two words. Then it groups similar words into one cluster using modularity-based graph partitioning. However, EDCoW only models the temporal patterns of words and our observation has shown that it tends to introduce a fair amount of noise words into the event representation. Parikh and Karlapalem in
Unauthenticated Download Date | 6/29/17 3:31 PM
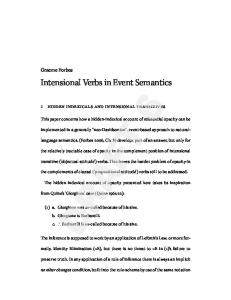
and [Chen et al. 2014] models the Twitter components (such as user, tweet, location, etc) as a heterogeneous graph and identifies events by finding anomalous clusters in the graph. In this work, we also use bigram as a single unit, 204 since our experiments indicated that bigram achieved better performance than unigram. This is consistent with the finding from Li et [Parikh to demonstrated use bigram and al. in [Lietetal.al. 2013] 2012], proposed where they incorporate content analysis into event detection. that over half of the tweet segments are Their ideaand is tothere extract frequent bigrams arethe rarely any co-occurring segments of bigrams with regard to aInkeyword, compute more than 3 grams. the restand of then the paper, when webetween use two “word(s)/keyword(s)”, wecosimilarity keywords based on the actually refer to “bigram(s)”. occurring bigrams they share. Several researches do not strictly fall into the aforementioned three categories. For example, [Guille et al. 2014] takes ad3 Proposed System vantage of the creation frequency of dynamic links We propose in this paper a fully automated to detect events, and [Chen et al. 2014] models event detection system which employs thethe Twitter (such(SAAS) as user, tweet, location, softwarecomponents as a service architecture etc) as a heterogeneous graph and identifies events where users can easily run a detection through by anomalous clusters in the graph. raw In this a finding web interface.The system accepts Twitter uploaded bya single users,unit, performs work, we data also use bigram as since our temporal andindicated semanticthat analysis against it using experiments bigram achieved better MapReduce technology, and finally visualizes performance than unigram. This is consistent with the finding detection results. Theinwhole process the from Li et al. [Li et al. 2012],does where not demonstrated need any human intervention they that over half of the and tweetnosegdomain needs berarely gained to ments areknowledge bigrams and theretoare anyprior segments detection. Figure 1 gives the architectural of more than 3 grams. In the rest of the paper, when overview of our event detection system and we use “word(s)/keyword(s)”, we actually refer to each system component is detailed “bigram(s)”. subsequently. Raw Twitter Data
Event Detection Task Manager
Detection Engine
Event Visualization
Framework Initializer
Web Application Server
MapReduce Enabled Indexing Engine
Data Persistence and Data Access Layer
Event Detection Processor Database
Figure 1: System Figure architecture. 1. System architecture
3
Proposed System
We propose in this paper a fully automated event detection system which employs the software as a service (SAAS) architecture where users can easily run a detection through a web interface.The system accepts raw Twitter data uploaded by users, per-
There are mainly three responsibilities for task manager. 1) It provides a graphical user interface for users to define a detection task. Users are required to upload the Twitter dataset, specify the task parameters such asPeng theYan name of the task, the length of the time interval used to split the dataset, whether lemmatization performed dataset, forms temporal is and semanticagainst analysisthe against it usetc. The task manager has a data distributor. ing MapReduce technology, and finally visualizes Once a dataset is uploaded, the distributor willnot the detection results. The whole process does distribute the dataset across all the nodes in the need any human intervention and no domain knowlcluster. 2) It interacts with the detection edge needs to be gained prior to detection. Figure 1 engine, querying for status of the detection gives the architectural overview of our event detecprocess. 3) It tells the visualization module the tion component module is detailed tasksystem status,and so each that system the visualization subsequently. knows whether the detected results are ready for displaying.
3.1
Task Manager
3.2 Detection There are mainly Engine three responsibilities for task The detection is the core component of manager. 1) It engine provides a graphical user interface the system. It is composed of three major for users to define a detection task. Users are recomponents: initializer, thetask quired to uploadthe the framework Twitter dataset, specify the indexing engine and the detection processor. parameters such as the name of the task, the length We introduce each component in detail in the of the time interval used to split the dataset, whether following sections. lemmatization is performed against the dataset, etc. This section introduces the first two The task manager has adetection data distributor. components in the engine: Once the a dataset is uploaded, the distributor will distribute framework initializer and the indexing engine. the across all in theinitializer cluster. 2) Thedataset main function of the the nodes framework Itis interacts with the the uploaded detection dataset engine, associated querying for to preprocess status of thespecified detectionparameters. process. 3) ItThis tellsinvolves the visualwith user ization module the taskcontent status, of so each that the visualizaextracting the textual tweet and the time at which tweet was Based onare tion module knowsawhether theposted. detected results the parameters specified by the user, the ready for displaying. textual content of each tweet is can be either kept intact or lemmatized 3.2 Detection Engine and cut into n-grams. Once the extraction is finished, we can get the upper and lower bounds the component post times of forthe The detection engine is theofcore all tweets. we useofthe twomajor bounds and the system. It isThen composed three components: timeframework window defined by the the indexing user to split theand the initializer, engine tweets into different buckets. Suppose the the detection processor. We introduce each compoupper T1, the lower is T2, and the nent intime detailbound in theisfollowing Sections. time window is W, then the tweets can be This Section two compoT1 T2 ) / W the 1 first divided into (introduces number of nents in the detection engine: the framework inibuckets, where bucket Bi (0 i W ) contains tializer and the indexing engine. The main function allthetweets posted between andup2 W i the of framework initializer is to T preprocess T2 Wdataset (i 1)associated . loaded with user specified parameters. This involves extracting content The detailed workflow of the the textual initializer is of illustrated in Figure 2. atThe whole workflow of each tweet and the time which a tweet was posted. the initializer has been parallelized withthe Based on the parameters specified by the user, MapReduce. Basically, the mapper takes textual content of each tweet is can be eitherthe kept uploaded raw Twitter datainto filen-grams. as input, intact or lemmatized and cut Once the extraction is finished, we can get the upper and lower bounds of the post times for all tweets. Then we use the two bounds and the time window defined by the user to split the tweets into different buckets. Suppose the upper time bound is T1 , the lower is T2 , and the time window is W, then the tweets can Unauthenticated Download Date | 6/29/17 3:31 PM
205
MAPREDUCE AND SEMANTICS ENABLED . . .
be divided into (T1 − T2 )/W + 1 number of buckets, where bucket Bi (0 ≤ i ≤ W ) contains all tweets posted between T2 +W ∗ i andT2 +W ∗ (i + 1).
The detailed workflow of the initializer is illustrated in Figure 2. The whole workflow of the initializer has been parallelized with MapReduce. Basically, the mapper takes the uploaded raw Twitter data file as input, extracts temporal and textual information. The reducer collects the tweets belonging to the same bucket and outputs basic statistics (i.e. the upper and lower bounds of the post times, the number of buckets) and preprocessed texts (i.e. n-grams of the tweets) which will be used for indexing. As was discussed earlier, the initializer takes raw tweets as input and divides them into different buckets. These buckets of tweets are then passed to the indexing engine. Figure 3 gives the detailed indexing algorithm. The algorithm uses the statistics calculated by the initializer to group tweets into different buckets. Each bucket is viewed as a single document and an inverted index is built against the textual content of all tweets in that bucket. Algorithm 1 Build Inverted Index against Tweets Input: contentRDD, numBuckets, minPostTime /* contentRDD: n-grams of textual content of all tweets timeWindow: time interval used to split tweets numBuckets: number of buckets minPostTime: lower bound of the post times for all tweets*/ Output: Inverted index on tweets. function buildIndex(contentRDD, timeWindow, numBuckets, minPostTime) for each i in numBuckets do /*collect tweets from tweetRDD that fall into bucketi, say tweetsi */ tweetsi = selectTweetsMapper(minPostTime, i, timeWindow) build an index for tweetsi with i as the document number end for end function function selectTweetsMapper(minPostTime, i, timeWindow) extract post time of the current tweet, say curTime thisBucket=(curTime–minPostTime)/timeWindow
if (i == thisBucket) then return the textual content of this tweet end if end function The purpose of indexing is to speed up the statistical computation in the detection processor. We propose two models here: a temporal model for capturing the temporal patterns from tweets and a semantic modelfor computing semantic relatedness between words. We observe that the words representing an event usually show a similar appearance pattern when the event is taking place. For example, the number of occurrences of the words “Japan” and “earthquake” were showing a similar pattern after the 2011 Thoku earthquake and tsunami occurred. Based on this observation, we propose to represent each word as a vector of real numbers to capture its temporal nature. Basically, given a start time Tstart and an end timeTend , suppose the time duration Tend − Tstart are split into n number of buckets, we represent each word as a temporal vectoras follows tv(wi ) =< t weighti,1 ,t weighti,2 , ...,t weighti,n >, (1) where t weighti,k (1 ≤ k ≤ n) represents the temporal weight of wi from time Tstart + (k − 1) · (Tend − Tstart )/n to timeTstart + k · (Tend − Tstart )/n. To computet weighti,k , we employ a variation of the TF*IDF weighting scheme as follows t weighti,k = si,k /highest(si,mk ),
(2)
where mk = 1, 2, ...qk and there are totally qk number of words among the tweets posted between Tstart + (k − 1) · (Tend − Tstart )/n and Tstart + k · (Tend − Tstart )/n, si,k = t fi,k ∗ Log(Pk /d fk ) where Pk is the number of tweets posted between Tstart + (k − 1) · (Tend − Tstart )/n and Tstart + k · (Tend − Tstart )/n, d fk is the number of tweets that wi occurs, and t fi,k is the number of occurrences of wi in tweets posted between Tstart + (k − 1) · (Tend − Tstart )/n and Tstart + k · (Tend − Tstart )/n. Note that there is a special case here, i.e. when k = n, t weighti,k simply equals to si,k /highest(si,mk ). Using the index built from the indexing engine, the statistics (such as si,k , d fk ) can be calculated very efficiently. Here, equation (2) is able to effectively capture the increase or decrease in the usage of wordwi by translating the usage change into an increase or decrease of the Unauthenticated Download Date | 6/29/17 3:31 PM
extracts temporal and textual information. The reducer collects the tweets belonging to the 206 same bucket and outputs basic statistics (i.e. the upper and lower bounds of the post times,
the number of buckets) and preprocessed texts (i.e. n-grams of the tweets) which will be used Peng Yan for indexing.
“Thank you for staying @MadKatyDisease”
Raw Raw tweet tweet stream stream
Format tweet stream into a three-column file
Stream Formatter TWEET_NUM 1 2 ... n
Formatted Formatted threethreecolumn column file file
POST_TIME
Feature Extraction from Tweet Stream
Preprosess the generated file using map-reduce
Post Post times times of of tweets tweets
TEXTUAL_CONTENT
2014-06-29 00:44:04 Thank you for staying @MadKatyDisease 2014-06-27 19:43:56 Unplug to connect. ... ... 2015-03-09 09:37:29 Let's take this act on the road!!!
Textual Textual content content of off tweets tweets
Tokenization
Lemmatization
N-grams N-grams of of tweets tweets
N-gram extraction
Extract max and min post times, and calculate the number of buckets
Indexing
Build inverted index for each bucket
Figure 2. Framework initializer workflow Figure 2: Framework initializer workflow. TF*IDF value between time buckAs discussed earlier,two theconsecutive initializer takes raw as input and divides them into different ets.tweets Finally, the temporal similarity between two buckets. These buckets of tweets are then words wi and w j can be calculated using the cosine passed to the indexing engine. Figure 3 vectors gives value of their corresponding representation detailed indexing algorithm. The algorithm as the follows uses the statistics calculated by the initializer to group sim(w tweetsi , w into different buckets. Each temporal j ) = cos(tv(wi ),tv(w j )). (3) bucket is viewed as a single document and an index is built against the textual Toinverted analyze the semantic aspect of a word, we procontent allcontext tweets in that bucket. pose to useofits words as linguistic features to model the intrinsic meaning. We represent each word as a semantic vector as follows ALGORITHM. Build Inverted Index against Tweets Input:contentRDD, numBuckets, minPostTime
sv(w , ..., sofweight i ) =< s weight i,1 , sofweight i,n >, /* contentRDD: n-grams textual i,2 content all tweets timeWindow: time interval used to split tweets (4) numBuckets: number of buckets where s weight i,k (1 ≤ k ≤ n) represents the semanminPostTime: lower bound of the post times for all tictweets*/ weight of wi from time Tstart + (k − 1) · (Tend − Output:Inverted Tstart )/n to time index Tstarton+tweets. k · (Tend − Tstart )/n. Here wefunction use thebuildIndex(contentRDD, words co-occurringtimeWindow, with wi to compute numBuckets, minPostTime) s weight we set s weighti,k = 0 at the befor eachi,ki .inFirst, numBuckets ginning, collect all tweetsthat betweenT (k − /*collectand tweets from tweetRDD fall into bucketi, start + say 1)tweetsi · (Tend*/− Tstart )/n and Tstart + k · (Tend − Tstart )/n. tweetsi = selectTweetsMapper(minPostTime, i, Then we go through each word w j from time Tstart timeWindow) to build Tend ,anand if wwith with wnumber indexcheck for tweetsi i as the document j co-occurs i in the same tweet in the current time bucket. If so, s weighti,k is increased by 1. In the same way, the semantic similarity between two words is calculated
end the for cosine similarity as follows using end function
semantic sim(wi , w j ) = cos(sv(wi ), sv(w )). (5) function selectTweetsMapper(minPostTime, i, j timeWindow)
The finalpostweighting scheme forsaymeasuring the extract time of the current tweet, curTime thisBucket = (curTime – minPostTime) / timeWindow closeness between words wi and w j is defined as if(i == thisBucket) follows return the textual content of this tweet end if sim(w i , w j ) = λ · temporal sim(wi , w j )+ end function
+(1 − λ) · semantic sim(wi , w j ), (6) Figure 3: The algorithm of building inverted where λ is a tuning parameter that can be adindex using MapReduce. justed based on the preference on the two similarity schemes in the experiments. The purpose of indexing is to speed up the statistical computation in 2013], the detection Motivated by [Parikh et al. we detect processor. We propose two models here: a events using Hierarchical Agglomerative Clustering temporal model for capturing the temporal (HAC). Each cluster represents an event. The reapatterns from tweets and a semantic modelfor son of choosing this clustering technique is that it computing semantic relatedness between does not require the number of clusters to be given words. We observe that the words representing in an advance. is reasonable there is no way event This usually show a since similar appearance forpattern us to know how many events are there the when the event is taking place.inFor dataset. HAC is a bottom-up clustering technique example, the number of occurrences of the andwords is more frequently used in information retrieval “Japan” and “earthquake” were showing than clustering. it starts with a top-down similar pattern afterBasically, the 2011 Tōhoku a collection of single clusters where each cluster contains only one data point. Then it merges two closest clusters into a new cluster and removes the Unauthenticated Download Date | 6/29/17 3:31 PM
207
MAPREDUCE AND SEMANTICS ENABLED . . .
two clusters from the collection. This process repeats until there is only one cluster in the collection. Here in our scenario, at the beginning, each word is a single cluster, and we use Equation (5) to compute the distance between two words. Then the two words with the shortest distance are grouped into a new cluster. Once a new cluster is generated, the complete linkage algorithm is used to calculate the distance between the newly generated cluster and any other clusters. We will demonstrate the reason of choosing the complete linkage algorithm in the experiments later. Since both the temporal information and the semantic meaning of tweets are considered for measuring the distance between two clusters, our method can effectively avoid two types of poor clustering results: 1) words with similar temporal patterns but representing different events are grouped into one cluster; 2) semantically related words with dissimilar temporal patterns are grouped into one cluster.
3.3
Event Visualization
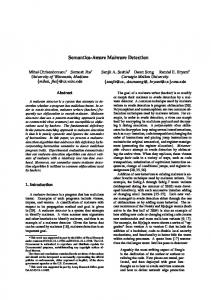
We have developed a two-level graphical user interface to visualize the event detection results. We attempt to interpret the detected events in two dimensions: the event-dimension and the keyword dimension. In the event dimension, we summarize all of the detected events using the keywords representing them. In addition, we present all of the burst intervals and the estimated start time for each event. The events can be re-ordered based on the number of keywords it contains, the start burst period and the estimated start time. While in the keyword dimension, we visualize the temporal pattern of each keyword associated with the statistics on it to present a complete keyword profile. It is intuitive for the user to understand why a keyword has been discovered by the system and selected as an event representative keyword. Figure 4 gives a screenshot of the system interface.
4
Experiments
This Section evaluates the performance of the proposed approach in terms of effectiveness and efficiency in detecting real-world events. We considered two case study scenarios: one is the Thoku earthquake and tsunami on March 11, 2011 [Japan
Earthquake 2011] and the other is the death of Osama bin Laden on May 2, 2011 [Death of Bin Ladin 2011]. However, the method proposed in this work is not limited to dealing with these two detection scenarios. It also works for other applications such as detecting financial crisis, civil unrest, disease outbreaks, etc.
4.1
Experiment Design
Datasets: we used the Twitter dataset contributed by [Li et al. 2012]. This dataset contains 147, 909 files where each file has at most 500 tweets published by a Twitter user. Every tweet in the 147, 909 files contains enough information including Content, Tweet ID, Creation Time, Retweet Count, Favorite, Hashtags, etc. The whole dataset contains 61,214,013 tweets posted between November, 2006 and August, 2011. Since the information needed by our approach is Content and Creation Time, and there are a lot of broken tweets (i.e. tweets that do not have Content or Creation Time, or the Creation Time is not a valid date expression) in the raw data, we preprocessed the data with two steps: 1) we went through all the 147, 909 files and extracted the Content and Creation Time from the raw data and generated a single large CSV file with two columns (one for Content and the other for Creation Time); 2) we removed those broken tweets and finally obtained 61,194,937 tweets. As mentioned earlier, we considered two major events happened in 2011 (the Japan earthquake and the death of Bin Ladin) as our case study scenarios. As the Japan earthquake occurred on March 11, 2011, we constructed three datasets for this event by extracting the tweets posted around March 11: dataset #1 (which is labeled as “Earthquake-A” in Table 1) contains two days of tweets; dataset #2 (labeled as “Earthquake-B”) and dataset #3 (labeled as “Earthquake-C”) contain one week of and one month of tweets respectively. The reason of using datasets with different time spans (ranging from two days to one month) is to completely validate the performance of the proposed model under different circumstances. For example, one full month of tweets would contain much more noise than that of two days, and thus increase the difficulty of identifying true events. Note that we did not perform any prior-knowledge-based preprocessing against
Unauthenticated Download Date | 6/29/17 3:31 PM
results: 1) words with similar temporal patterns but representing different events are grouped into one cluster; 2) semantically related words with dissimilar temporal patterns are grouped into one cluster.
208
Figure 4: System interface.
dimension, we visualize the temporal pattern of each keyword associated with the statistics on it to present a complete keyword profile. It is intuitive for the user to understand why a keyword has been discovered by the system Peng Yan and selected as an event representative keyword. Figure 4 gives a screenshot of the system interface.
Figure 3. System interface
the raw data (e.g. content filtering by extracting tweets that contain specific terms), since our model 4 Experiments does not require any prior knowledge about the data This section evaluates the performance of the before the detection. In the same way, we also preproposed approach in terms of effectiveness pared three datasets for the death of Bin Ladin as and efficiency in detecting real-world events. shown in Table 1.two case study scenarios: one is We considered
the TōhokuMetrics: earthquake on March is Evaluation the and goaltsunami of our evaluation 2011 [Japan Earthquake 2011] and theacin11, three dimensions: 1) event accuracy: how other the is the death of Osama bin on May curate proposed approach is inLaden identifying realworld events; 2) keyword accuracy: how accurate the proposed approach is in representing a single event; 3) how fast our approach is in reporting alerts after a major event has happened. The first dimension of the goal has been extensively addressed in research [Weng et al. 2011; Parikh et al. 2013], as it is the most important criterion in evaluating the performance of an event detection system. However, to our knowledge, we have not seen any of the previous works address the second dimension. It is of importance to measure the accuracy of the event representation (i.e. the accuracy of the keywords constituting an event) because it directly determines whether the detected events can be understood by human beings, as well as to what extent they can be interpreted. In the sense of business value and social impact, the third dimension also needs to be addressed. To the end of the three goal dimensions, we use precision, one of the most widely used performance metrics in information retrieval as our
evaluation measure. cannot be used here be2, 2011 [Death of Recall Bin Ladin 2011]. However, cause it is not possibleintothis enumerate all limited events in the method proposed work is not to dealing these two in detection the datasetswith as described [Weng scenarios. et al. 2011]. It also fordiffer otherinapplications such as Since theworks datasets size substantially, and detecting financial crisis, civil unrest, disease the numbers of keywords for different events vary etc. both micro-averaged and macroa outbreaks, lot, we report averaged precisions. Specifically, 1) for the first goal dimension (i.e. evaluating the event accuracy), micro-averaged precision operates at event level and is mainly affected by the detection accuracy of large datasets. Whereas macro-averaged precision results over datasets, and thus small datasets have more impact on the overall detection accuracy. 2) for the second goal dimension (i.e. evaluating the keyword accuracy), micro-averaged precision measures at keyword level and is primarily affected by the accuracy of events with more keywords, while macro-averaged precision averages results over all of the detected events, and thus events with a small quantity of keywords impact the performance more. Linkage Algorithm Selection and Parameter Tuning: as described earlier, we employ two methods to calculate the similarity between keywords, and use the linear combination of them associated with one tuning parameter λ to generate a merged similarity score. Here we introduce how we adjust the value of λ so that a reasonable similarity estimation between keywords can be obtained. The value of λ was tuned from 0.1. 0.2, up to 1.0 to generate a Unauthenticated Download Date | 6/29/17 3:31 PM
can see that the best event precision was achieved when complete linkage was used as the distance measure for the clustering. After the linkage algorithm was determined, our next AND stepSEMANTICS was to find a proper MAPREDUCE ENABLED . . . λ value which led to the best event precision. Figure 5
The results show that event precision dropped significantly when solely relying on the temporal or semantic analysis, and the best performance can be obtained when λ is between 0.6 and 0.8. Therefore, we set λ to209 0.7 in the following experiments.
Event Precision 1 0,8
0,6 0,4 0,2
0
1
0,9
0,8 D2
0,7
0,6 D3
0,5 D4
0,4 D5
0,3
0,2
0,1
D6
Figure 4. Event for dataset #2 through #6 Figure 4: Event precisions for dataset #2precisions through #6. merged similarity score. The success of the merged score was evaluated based on the event precision of the clustering results. Table 1. Datasets Dataset #1 Earthquake-A
# of tweets 226,065
#2 Earthquake-B
572,448
#3 Earthquake-C
3,099,100
#4 Ladin-A
300,134
#5 Ladin-B
1,090,434
#6 Ladin-C
4,485,374
Time Span From Mar 10, 2011 to Mar 11-2011 From Mar 08, 2011 to Mar 14, 2011 From Mar 01, 2011 to Mar 31, 2011 From May 01, 2011 to May 02, 2011 From Apr 29, 2011 to May 05, 2011 From April 15, 2011 to May 15, 2011
We experimented seven different linkage algorithms in combination with different λ values as shown in Table 2, and calculated the event precision on dataset #1. From Table 2 we can see that the best event precision was achieved when complete linkage was used as the distance measure for the clustering. After the linkage algorithm was determined, our next step was to find a proper λ value which led to
the best event precision. Figure 5 shows the event precisions on dataset #2 through #6 using complete linkage for the clustering. The x axis represents different λ values, and y axis indicates event precisions. The results show that event precision dropped significantly when solely relying on the temporal or semantic analysis, and the best performance can be obtained when λ is between 0.6 and 0.8. Therefore, we set λ to 0.7 in the following experiments. Execution Environment: we built a spark cluster of 3 nodes on Ubuntu v13.10 64-bit: 1 master and 3 slaves (the master is also used as a slave). The master has 12 Intel Xeon cores (each @ 2.5GHz), and each slave has 4 Intel i5-4250U cores (each @ 1.3GHz). The cluster has a total memory of 80G and 20 cores.
4.2
Experiment Results
The proposed approach was compared with five existing representative methods for event detection: EDCoW [Weng et al. 2011], ET [Parikh et al. 2013], Discrepancy [Lappas et al. 2009], Peaky Topics [Shamma el al. 2011], Trending Score [Benhardus et al. 2013]. We tried to run the comparison methods without using MapReduce and found that it was even impossible to finish the data preprocessing within reasonable time. So we decided to use the MapReduce algorithm we proposed in Section 3.2.2 to preprocess the data for all comparison methods. Table 3 and 4 compare our method with the other five methods using the micro and macro event precision. Table 3 uses the earthquake dataset
Unauthenticated Download Date | 6/29/17 3:31 PM
210
Peng Yan
Table 2. Event precisions with different λ values and linkage algorithms for dataset #1 λ Average Linkage Centroid Linkage Complete Linkage Median Linkage Single Linkage Ward Linkage Weighted Average Linkage
1.0 0.0 0.61 0.0
0.9 0.69 0.80 0.86
0.8 0.65 0.75 0.87
0.7 0.67 0.74 0.87
0.6 0.67 0.81 0.86
0.5 0.67 0.62 0.82
0.4 0.60 0.59 0.79
0.3 0.34 0.39 0.44
0.2 0.32 0.33 0.43
0.1 0.10 0.0 0.18
0.69 0.0 0.0 0.0
0.73 0.65 1.0 0.83
0.67 0.65 0.0 0.65
0.74 0.65 0.0 0.67
0.69 0.62 0.0 0.61
0.63 0.61 0.0 0.60
0.60 0.55 0.0 0.61
0.36 0.33 0.0 0.33
0.36 0.30 0.0 0.32
0.11 0.10 0.0 0.0
and Table 4 uses the Ladin dataset as shown in Table 1. We define micro/macro event precision as follows pmicro (e) =
∑M i=1 # of correctly detected events for Di , ∑M i=1 total # of detected events for Di
where M = # of datasets,
pmicro (k) =
∑N i=1 # of correctly detected keywords for ei ∑N i=1 total # of detected keywords for ei
where N = # of detected events,
, (9)
(7)
pmacro (e) = M1 ∑M i=1 pi (e) # of correctly detected events for Di where pi (e) = total # of detected events for Di , and M = # of datasets.
(8)
Table 3. Comparison between MASEED and existing methods using event precision on the earthquake datasets Method EDCoW ET Discrepancy PeakyTopics Trending Score MASEED
events. We define micro/macro keyword precision for each dataset as follows
Micro 0.29 0.58 0.19 0.16 0.47
Macro 0.29 0.56 0.21 0.16 0.48
0.72
0.74
It is obvious that our method outperforms all of the five methods to a large degree. The event precision for our method steadily stays above 0.7 for both of the two datasets. Table 5 gives a comparison of the keyword precision. As introduced in the evaluation metrics Section, keyword precision is used to measure how well the system performs in interpreting the detected
pmacro (k) = N1 ∑Ni=1 pi (k) , correctly detected keywords for ei where pi (k) = # oftotal # of detected keywords for ei , and N = # of detected events. (10) Therefore, a system that has higher keyword precision can do better in explaining the detection results. Table 4. Comparison between MASEED and existing methods using event precision on the Ladin datasets Method EDCoW ET Discrepancy PeakyTopics Trending Score MASEED
Micro 0.21 0.57 0.17 0.16 0.51
Macro 0.24 0.55 0.20 0.17 0.49
0.73
0.74
To demonstrate the ability of our system in detecting events from large and noisy datasets, Table 6 and 7 give the detected results on the earthquake and Ladin datasets. For example, event #4 in Table 6 is talking about donation to the earthquake, and event #1 is about the death of Bin Ladin. Table 8 gives the rum time of MASEED starting from reading the raw twitter data to generating detected events for all of the 6 datasets. We do not give the Unauthenticated Download Date | 6/29/17 3:31 PM
211
MAPREDUCE AND SEMANTICS ENABLED . . .
Table 5. Comparison between MASEED and existing methods using keyword precision Method
Dataset #1 Micro Macro EDCoW 0.33 0.35 ET 0.85 0.90 Discrepancy 0.29 0.33 PeakyTopics 0.28 0.35 Trending 0.77 0.83 Score MASEED 0.91 0.99
Dataset #2 Micro Macro 0.28 0.30 0.85 0.91 0.24 0.27 0.23 0.26 0.76 0.81
Dataset #3 Micro Macro 0.17 0.19 0.71 0.80 0.13 0.17 0.13 0.16 0.71 0.80
Dataset #4 Micro Macro 0.30 0.31 0.81 0.87 0.26 0.29 0.23 0.27 0.74 0.81
Dataset #5 Micro Macro 0.23 0.26 0.77 0.84 0.22 0.24 0.21 0.25 0.72 0.79
Dataset #6 Micro Macro 0.12 0.13 0.72 0.75 0.10 0.14 0.09 0.12 0.66 0.70
0.91
0.75
0.84
0.95
0.80
0.96
0.84
0.91
0.96
0.75
Table 6. Detected Events from Dataset #3 # 1
Events Elizabeth Taylor Died
2 3 4 5 6 7 8
St Patrick’s Day The supermoon of March 19, 2011 Text 90999 to redcross Twitter’s 5th birthday Japan earthquake & tsunami Mardi Gras or Fat Tuesday AT&T acquires T-Mobile
Representative Words elizabeth=taylor rip=elizabeth taylor=di video=talk talk=deliveri ki=youtub todai=health comment=video st=patrick st=patti patti=dai patrick=dai wear=green super=moon full=moon upload=video text=redcross 90999=donat 10=donat west=coast happi=5th birthdai=twitter monopoli=att 5th=birthdai tsunami=japan hit=japan tsunami=warn mardi=gra happi=fat bui=tmobil acquir=tmobil 39=billion
Table 7. Detected Events from Dataset #6 # 1
Events Death of Bin Ladin
2 3
Mother’s Day Earth’s Day
4
Microsoft acquired Skype
5 6 7
Tim killed in Libya UFC 129: St-Pierre vs. Shields Wedding of Prince William and Catherine Middleton cinco de mayo
8
Representative Words laden=dead laden=death laden=kill white=hous usa=usa god=bless kill=osama mission=accomplish presid=Obama live=coverag live=stream watch=live mother=dai mother=mom mother=mother mother=wonder hei=help help=15002000 fridai=shout4shout win=contest try=win skype=85 microsoft=bui microsoft=acquir googl=music grow=closer tim=hetherington kill=libya pai=pai check=video pierr=gsp video=pai princ=william kate=middleton william=kate watch=royal de=mayo celebr=cinco happi=cinco
Table 8. Run time for detecting events from datasets #1 through #6 Run Time (mins)
Dataset #1 2.63
Dataset #2 3.73
Dataset #3 29.01
Dataset #4 3.47
Dataset #5 12.22
Dataset #6 96.11
Unauthenticated Download Date | 6/29/17 3:31 PM
212
Peng Yan
run time for comparison methods since our experiments have demonstrated that they cannot complete within reasonable time without MapReduce. Note that for datasets #3 and #6 which have over 3 million and 4 million number of tweets respectively, MASEED took only 29 and 96 minutes to complete the whole process of event detection, which includes word lemmatization, 2-grams extraction, indexing and detection.
5
Conclusions
In this work, we proposed a new distributed computing framework for detecting major events from social media. The proposed system focuses on providing a scalable and effective solution to be able to perform large-scaled event detection. We present efficient algorithms using MapReduce for data preparation and indexing. A novel hybrid model for temporal and semantic analysis on Twitter data is proposed, and a graphical user interface for flexible event visualization is developed. Our system completely automates the whole event detection process, without requiring any human intervention and domain knowledge to be gained in advance. The effectiveness of the proposed system has been evaluated on real Twitter datasets, and empirical evaluation demonstrates our approach outperforms most of the state-of-the-art methods. The proposed system is not coupled with any specific information resource or social media at all, which means it has a promising application in other types of resources. Social media also provides other valuable information resources which were not used in this study. These valuable resources may be integrated into the current system to further improve the detection accuracy. In addition, since we already have a temporal model for event related word representation, combined with time series analysis, our system can be extended to an event forecasting system.
References [1] J. Wen and B. Lee, Event Detection in Twitter, In Proceedings of the 5th International AAAI Conference on Weblogs and Social Media, 2011, 401-408. [2] T. Sakaki, M. Okazaki, and Y. Matsuo, Earthquake shakes Twitter users: real-time event detection by
social sensors, In Proceedings of the 19th International Conference on World Wide Web, 2010, 851860. [3] Q. Zhao and P. Mitra, Event Detection and Visualization for Social Text Streams, In Proceedings of the International AAAI Conference on Weblogs and Social Media, 2007, 26-28. [4] G. Kumaran and J. Allan, Text classification and named entities for new event detection, In Proceedings of the 27th Annual International ACM SIGIR Conference on Research and Development in Information Retrieval, 2004, 297-304. [5] R. Parikh and K. Karlapalem, Et: events from tweets. In Proceedings of the 22nd International Conference on World Wide Web companion, 2013, 613-620. [6] G. Fung, J. Yu, P. Yu, and H. Lu, Parameter free bursty events detection in text streams, In Proceedings of the 31st International Conference on Very Large Databases, 2005, 181-192. [7] A. Guille and C. Favre, Mention-anomaly-based event detection and tracking in twitter, Advances in Social Networks Analysis and Mining(ASONAM), 2014, 375-382. [8] X. Wang, F. Zhu, J. Jiang and S. Li, Real time event detection in twitter, In: Web-Age Information Management, Springer, Berlin Heidelberg, 2013, 502513. [9] A. Ritter, S. Clark and O. Etzioni, Named entity recognition in tweets: an experimental study, In Proceedings of the Conference on Empirical Methods in Natural Language Processing, 2011, 1524-1534. [10] J. Kleinberg, Bursty and hierarchical structure in streams, Data Mining and Knowledge Discovery 7, no. 4, 2003, 373-397. [11] PearAnalytics. Twitter study - august 2009, http://www.pearanalytics.com/wpcontent/uploads /2009/08/Twitter-Study-August-2009.pdf, 2009 [12] R. Li, S. Wang, H. Deng, R. Wang and K. Chang, Towards social user profiling: unified and discriminative influence model for inferring home locations. In Proceedings of the 18th ACM SIGKDD International Conference on Knowledge Discovery and Data Mining, 2012, 1023-1031. [13] Japan Earthquake, 2011, http://en.wikipedia.org/ wiki/2011 T%C5%8Dhoku earthquake and tsunami [14] Death of Bin Ladin, 2011, http://en.wikipedia.org/ wiki/Death of Osama bin Laden Unauthenticated Download Date | 6/29/17 3:31 PM
213
MAPREDUCE AND SEMANTICS ENABLED . . .
[15] F. Chen and D. Neill, Non-parametric scan statistics for event detection and forecasting in heterogeneous social media graphs. In Proceedings of the 20th ACM SIGKDD International Conference on Knowledge Discovery and Data Mining, 2014, 1166-1175. [16] S. Levine, How fast the news spreads through social media, In http://blog.sysomos.com /2011/05/02/how-fast-the-news-spreads-throughsocial-media/, 2012. [17] J. Benhardus and J. Kalita, Streaming trend detection in twitter, International Journal of Web Based Communities 9, no. 1, 2013, 122-139. [18] D, Shamma, L. Kennedy and E. Churchill, Peaks and persistence: modeling the shape of microblog conversations, In Proceedings of the ACM 2011 conference on Computer supported cooperative work, 2011, 355-358. [19] J. Lau, N. Collier and T. Baldwin, On-line Trend Analysis with Topic Models:\# twitter Trends Detection Topic Model Online, In COLING, 2012, 1519-1534. [20] T. Lappas, B. Arai, M. Platakis, D. Kotsakos and D. Gunopulos, On burstiness-aware search for doc-
ument sequences, In Proceedings of the 15th ACM SIGKDD International Conference on Knowledge Discovery and Data Mining, 2009, 477-486. [21] D. Gruhl, R. Guha, D. Liben-Nowell and A. Tomkins, Information diffusion through blogspace, In Proceedings of the 13th International Conference on World Wide Web, 2004, 491-501. [22] Y. Hu, A. John, D. Seligmann and F. Wang, What Were the Tweets About? Topical Associations between Public Events and Twitter Feeds, In: ICWSM, 2012. [23] C. Li, A. Sun and A. Datta. Twevent: segmentbased event detection from tweets, In Proceedings of the 21st ACM International Conference on Information and Knowledge Management, 2012, 155-164. [24] A. Kaplan and M. Haenlein, The early bird catches the news: Nine things you should know about micro-blogging. Business Horizons 54, no. 2, 2011, 105-113. [25] Y. Teh, M. Jordan, M. Beal and D. Blei, Hierarchical dirichlet processes, Journal of the American Statistical Association 101, no. 476, 2006
Dr. Peng Yan is a Senior Research Scientist at 3M Corporate Research Laboratory. He received his PH.D in Computer Science from North Dakota State University in 2013, with his interests focused on data mining and text mining. His experience ranges from work with IBM creating automation frameworks for software test, research with North Dakota State University developing novel text mining algorithms, to work with WoWiWe Instruction Co. (https:// wowiwe.net) designing intelligent tutors and research with 3M in data analysis, data visualization and data mining.
Unauthenticated Download Date | 6/29/17 3:31 PM