Market-Based Resource Allocation using Price Prediction in a High Performance Computing Grid for Scientific Applications Thomas Sandholm KTH – Royal Institute of Technology Center for Parallel Computers SE-100 44 Stockholm, Sweden
[email protected]
Kevin Lai Hewlett-Packard Laboratories Information Dynamics Laboratory Palo Alto, CA 94304, USA
[email protected]
Jorge Andrade Ort´ız and Jacob Odeberg∗ KTH – Royal Institute of Technology Dept. of Biotechnology SE-100 44 Stockholm, Sweden {jacob,andrade}@biotech.kth.se
Abstract We present the implementation and analysis of a marketbased resource allocation system for computational Grids. Although Grids provide a way to share resources and take advantage of statistical multiplexing, a variety of challenges remain. One is the economically efficient allocation of resources to users from disparate organizations who have their own and sometimes conflicting requirements for both the quantity and quality of services. Another is secure and scalable authorization despite rapidly changing allocations. Our solution to both of these challenges is to use a market-based resource allocation system. This system allows users to express diverse quantity- and quality-ofservice requirements, yet prevents them from denying service to other users. It does this by providing tools to the user to predict and tradeoff risk and expected return in the computational market. In addition, the system enables secure and scalable authorization by using signed moneytransfer tokens instead of identity-based authorization. This removes the overhead of maintaining and updating access control lists, while restricting usage based on the amount of money transferred. We examine the performance of the system by running a bioinformatics application on a fully operational implementation of an integrated Grid market.
∗ also affiliated with Karolinska Hospital, Gustav V Research Institute, Dept. of Medicine, Atherosclerosis Research Unit, Stockholm, Sweden
1. Introduction The combination of decreasing cost for network bandwidth and CPU performance and the availability of opensource distributed computing middleware has led the highperformance computing community away from monolithic supercomputers to low-cost distributed cluster solutions. This model of computing allows users with bursty and computationally demanding tasks to share and use compute resources on demand. This usage model, aka utility computing [24], Grid computing [22], peer-to-peer compute farming [28], or Global Computing [23], has been applied to solve diverse technical computing problems in fields such as, bioinformatics [9], high-energy physics [10], graphics rendering [3], and economic simulation [2]. One common question remains: how to manage the allocation of resources to users? One challenge is that users are from disparate organizations and have their own and sometimes conflicting requirements for both the quantity and quality of services. For example, academic Grid projects [37, 4, 38, 8, 7, 6, 5, 10] typically require resources for throughput sensitive, long-running batch applications, while industrial utility computing offerings [14, 24, 26] typically require response-time sensitive, interactive, and continuous application server provisioning. One common solution is to have separate resource allocation mechanisms for different applications. However, this merely shifts the problem from reconciling the resource requirements of different applications to reconciling the resource requirements of different mechanisms. Another challenge is that users have a web of relation-
ships with regard to how they wish to share resources with each other. For example, one site may wish to share resources with a remote site, but only when demand from local users is low. Another example is that a site may wish to be reciprocative, where it only shares resources with sites that share resources with it. One common solution is to use access control lists (ACLs) to authorize access to resources. The problem is that managing ACLs is difficult because many users could potentially access a site, a site has many different types of resources, each of which may need a separate ACL, and the degree of access that each user has could change with each access. For example, as a user from site A uses host X at site B, site B would want to decrease the ability of other site A users from being able to consume resources at host X and possibly other hosts at the site. The dynamic updating of this amount of data not only increases overhead and development time, but could lead to inconsistencies that allow exploitation of the system. Instead, we examine a market-based approach to resource allocation in Grids. A number of models and mechanisms for electronic markets, and computational economies have been proposed [40, 30, 36, 35, 33, 12, 27]. In previous work we have presented and analyzed Tycoon [31], a market-based resource allocation system for shared clusters. Here we focus on how market-based techniques address issues in a Grid environment. More specifically, our contributions are as follows: • A Tycoon controlled cluster scheduler for Grid execution managers. The NorduGrid/ARC metascheduler [38] used by many academic Grid projects in Europe, such as SweGrid [37], to schedule large-scale scientific jobs across a collection of heterogeneous HPC sites using a uniform job submission and monitoring interface, was integrated with Tycoon. The integration allows the large existing user base of academic Grids to bid for and use resources controlled by economic markets seamlessly. We are also working on integrating our scheduler with Globus Toolkit 4 [21]. • Pilot application experiments. We use a bioinformatics pilot application currently deployed in an academic Grid to verify our model and implementation. A bioinformatics application scanning and analyzing the complete human proteome using a blast-based similarity search was run on a Tycoon cluster and evaluated. • Price prediction models and mechanisms. We discuss, implement and analyze models and mechanisms to predict cost of resources and give guarantees of QoS (Quality of Service) levels based on job funding. In a spot market as implemented by Tycoon it can be hard to predict the future price of a resource and know how much money should be spent on funding a job with a specific set of requirements. To that end we provide a suite of lightweight prediction capabilities that can give users guidance regarding what per-
formance levels to expect for different levels of funding of a job. • A security model combining identity and capabilitybased access control. In academic Grid networks it is important to identify all users securely because a user’s identity, and membership in virtual organizations, can automatically give access to shared resources. In electronic markets, however, the key question is whether you can present proof of payment for a resource. Our model allows Grid users to make use of electronic money transfer tokens, or checks, that can be used to pay for and gain access to resources to be used by a compute job, as well as to specify its priority and thereby ’buy’ a certain level of QoS. As a result, we believe that the combination of Grid and market mechanisms is a promising and viable approach to sharing resources in an economically sustainable way while ensuring fairness and overall system efficiency. The rest of the paper is organized as follows. In Section 2, we provide an overview of the design and discuss how it meets our goal. In Section 3, we delve more deeply into implementation specifics. Our price prediction analysis is presented in Section 4. Section 5 contains experimental results from running the bioinformatics application on our integration testbed. We describe related work in Section 6. We conclude by discussing some limits of our model and future work in Section 7.
2. Architecture Overview 2.1. A Case for Grid Markets High-end compute resources, such as Grid-enabled High Performance Computing (HPC) clusters, are necessary for many scientific computing applications. These applications can use more resources to scan larger input data sets, provide a higher resolution for simulations, or simply complete the same amount of work faster. In other words, they exhibit a continuous utility curve where a larger resource share results in a higher utility. Traditional queueing and batch scheduling algorithms assume that job priorities can simply be set by administrative means. In large-scale, cross-organizational, and potentially untrusted Grids, this can be expensive and slow, and allocations may not reflect the true relative priorities of jobs. Determining the relative priorities of applications requires a truth revelation mechanism like a market [12, 27, 41, 39]. This provides an incentive for uses to accurately prioritize their applications.
2.2. Tycoon In this paper, we apply a previously described marketbased resource allocation system (Tycoon) [29] in the Grid
context. In this section, we briefly review this system before describing the security and prediction extensions that are the focus of this paper. Please see the previous publication for additional details. The main characteristics of Tycoon are its decentralized and continuous markets. Each host that contributes resources to a Tycoon network runs its own market. This reduces the dependency on centralized components, making the system more scalable, fault-tolerant, and agile in the allocation of resources. The continuous market allows users to bid and receive resources at a high frequency (10 seconds by default), which allows applications to start quickly and react to quickly changing load. This is more important for service-oriented applications like web servers and databases than the typical Grid applications that runs for days. Sharing the same infrastructure across these different types of applications allows better statistical multiplexing. Another characteristic of Tycoon is the use of virtualized resources. This allows multiple applications to share the same host, which is useful both for applications that do not require a whole host and applications that have highly variable demand. Tycoon currently uses the Xen paravirtualization system [19], which imposes an overhead of 1%-5% for typical workloads. The architecture of Tycoon is composed of the Bank, which maintains information on users like their credit balance and public keys, the Service Location Service, which maintains information on available resources, and Auctioneers, which run on each host and manage the market used to allocate resources on that host. One of the main issues in this kind of distributed market is the efficiency relative to an ideal centralized market. Feldman, et al. [20] show that this market achieves both fairness and economic efficiency in the equilibrium when users use the Best Response optimization algorithm. Briefly, this algorithm solves the following optimization problem for a user:
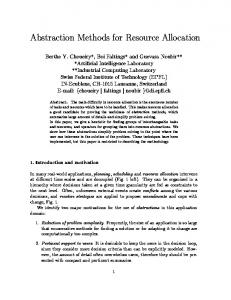
2.3. Grid Market Architecture Our solution is novel in the sense that we maintain the overall Public Key Infrastructure (PKI) security model of the Grid, but introduce supply and demand driven dynamic pricing and resource share negotiation on a spot market within a virtual Grid cluster. Differentiated services are offered in an incentive compatible manner where the Grid user can attach a check-like token to jobs to pay for the resources to be consumed. The user needs to be fully authenticated using a Grid PKI handshake, but the authorization step is based on a capability composed of the funds transferred to the scheduling agent. The scheduling agent uses the Best Response algorithm described in the previous section to distribute and place bids on compute nodes. Virtual machines are created dynamically, with the appropriate QoS levels automatically configured in proportion to the bids placed. Job stage-in, execution, monitoring, performance boosting (by adding funds) and stage-out are all handled by the agent. Figure 1 depicts the overall architecture of the system. The Tycoon infrastructure is integrated with the Grid Job manager as a local scheduling system, fully transparent to the end-users. The next section describes the design and implementation in more detail.
Figure 1. Tycoon Grid Market Architecture.
3. Grid Market Implementation Pn xij subject to maximize Ui = j=1 wi,j xij +y j Pn j=1 xij = Xi , and xij ≥ 0.
(1) (2)
where Ui is the utility of user i across a set of resources, wi,j is the preference of machine j as perceived by user i, for example the CPU capacity of the machine, xi,j is the bid user i puts on host j, yj the total of all bids or the price of host j, and finally Xi is the total budget of user i. One contribution in this work is to expose this Best Response algorithm to Grid HPC users, to allow them to easily use compute resources in a competitive market. Next we describe the architecture of this integration.
This section describes our integration of Tycoon with the Grid. Our approach is to integrate Tycoon with the infrastructure currently deployed in the SweGrid project, a national Grid in Sweden spanning six sites and a total of 600 compute nodes interconnected by the 10GB/s GigaSunet network. SweGrid has been in operation for a year and a half. The sites run the Nordugrid ARC middleware, which is based on the Globus toolkit, and currently connects about 50 HPC sites in 12 countries. Both ARC and Globus focus on providing an abstracted local cluster scheduler and execution manager so that the job submission mechanism and interface is the same regardless of whether PBS, LSF, Sun Grid Engine, etc., is used locally at the site.
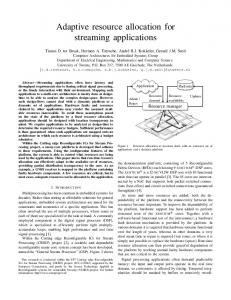
As a result, to enable Tycoon for Grid users seamlessly, our approach was to write a Tycoon scheduler plugin for ARC to simplify the transition of SweGrid users to this new infrastructure. Integration directly as a Globus (GT4) plugin is work in progress. The Tycoon cluster is exposed as any other ARC cluster both for monitoring and job submission purposes, with the only difference being that the cluster is virtualized and thus reports number of virtual CPUs as opposed to physical compute node CPUs. In ARC, the compute job requirements are describe in an XRSL (extended Globus Resource Specification Language) file. The CPU or WallTime XRSL attribute is mapped to the Tycoon resource bid deadline. The transfer token, described in more detail in the next section, is mapped to the total budget to be used within this deadline. Finally, the count attribute describes how many concurrent virtual machines or (virtual CPUs) the job requires. Mechanisms are provided to allow a job running in a virtual machine to access its ordinal number within such a batch of sub-jobs to, for example, process a different input data set. The bid distribution is determined by the Best Response algorithm of Tycoon. It calculates the optimal bids to maximize the overall utility gained from running a job on a set of host. The ARC runtime environment allows users to specify what software needs to be installed in order to run the job. This software is installed automatically in the virtual machine using Yellow dog Updater, Modified (yum)[1]. The Tycoon ARC plugin also handles job stage-in, stage-out and output checkpoint monitoring. Jobs that have been submitted may be boosted with additional funding to complete sooner, and if the money deposited into host accounts has not been used (Tycoon only charges for resources actually used not bid for) the outstanding balance will be refunded to the user. Dynamic pricing, accounting and billing thus all happen automatically by means of the Tycoon infrastructure. Furthermore, the QoS specified in the XRSL description is automatically enforced by configuring custom virtual machines on demand when jobs require them. To limit the overhead of virtual machine creation, a user may reuse the same virtual machine between jobs submitted on the same physical host. However, no application data or scratch space is shared by different jobs. Figure 2 shows a screenshot of the ARC Grid Monitor monitoring the Tycoon cluster. Note that since the number of CPUs are the number of virtual machines currently created, it can increase dynamically up to a maximum of about 15 times the number of physical nodes. Thus, for the current deployment of 40 hosts, a maximum of 600 virtual single CPU compute nodes can be offered concurrently to users by the Tycoon Grid. We could easily implement a virtual machine purging or hibernation model that could increase this number further if not all 600 machines need to be used at the same time, with the penalty of more overhead
to setup a job on a virtual machine.
Figure 2. Screenshot of Nordugrid/ARC Tycoon monitor.
In addition to the virtualization of compute nodes, the cluster is also virtualized, in the sense that the Tycoon architecture is flat without hierarchies. This allows the submission agent to pick up compute nodes from any available physical cluster. Most of the current machines are at HP Labs in Palo Alto, California, but others are owned by Intel Research in Oregon, by Singapore, and by the Swedish Institute of Computer Science in Stockholm. The current limitation of 40 physical machines is only an artifact of the current state of the virtual cluster, and can grow dynamically as more clusters and nodes are added to the Tycoon network. Regardless of whether the compute node is local to the submission agent the host funding, job stage-in, job execution, job monitoring and job-stage out will all be done the same way. Finally, the agent itself can be replicated and partitioned to pick up a different set of compute nodes. The ARC meta-scheduler could then be used to load balance and do job to cluster matchmaking between the replicas. We therefore believe that this model will scale well as the number of compute nodes and virtual machines on these compute nodes increase.
3.1. Security Design Our goal is to make the security integration as seamless as possible to the end-users, which means allowing Grid users to reuse their credentials when accessing a Tycoon cluster. To access a Tycoon cluster one needs a Tycoon bank account. So our task became equivalent to mapping a Grid certificate to a Tycoon bank account. Our approach is to transfer money from the user to the resource broker and map the proof of the transfer to a Grid identity, the Distinguished Name (DN) of the user.
This approach requires no manual access control list setup and it allows the user to keep both the Grid identity private key and Tycoon bank account private key on the local machine only. Furthermore, it does not require any changes to the existing Tycoon services. The user transfers money to the resource broker’s bank account and then signs the receipt together with a Grid DN. The mapping can thus be decided independent of the transfer and can therefore also be used by arbitrary Grid users who do not have any Tycoon infrastructure deployed. On the resource side it is verified that the money transfer was indeed made into the broker account and that the transfer token has not been used before. The signature of the DN mapping is also verified to make sure that no middleman has added a fake mapping. Once the transfer token has been verified a new sub-account to the broker account is created and the money verified is transferred into this account by the broker. The new account is then used to fund and create host accounts used to run the job on behalf of the Grid user.
4. Price and Performance Prediction 4.1. Motivation A challenge in any market-based resource allocation system is providing predictable performance. A variety of solutions exist, including reservations, future markets [11], options, and SLA contracts [42, 18]. However, all of these mechanisms require the ability to predict future demand and supply. Prediction is particularly important in spotmarket systems like Tycoon that lack other mechanisms to ensure predictability. The failure to predict accurately either causes users to overspend on resources or prevents them from achieving their required quality of service. Demand prediction requires a history of resource usage and a set of analysis algorithms. Our goal is to provide both a concise representation of historical prices on the Auctioneer and efficient client-side algorithms to analyze this data. We represent the demand using the spot-market price on each host. In Tycoon, this reflects both the usage of and demand for a resource. This information is updated every 10 seconds, which is also the reallocation interval. In addition to the instantaneous demand, we also track the average, variation, distribution symmetry, and peak behavior of the price. To make this information useful to a wide array of applications, periodization of the data is necessary. We implement this by presenting and scoping the statistics in moving, customizable time windows. By looking at smaller time windows we may be able to make simplifying assumptions such as the assumption of a symmetric normal distribution even though such a distribution may not be a good representation of a larger window, and vice versa. To track the price
distribution dynamically we implement a self-adjusting slot table recording the proportion of prices that fall into certain ranges. We now present three high-level prediction techniques to model our price data, (1) normal distribution prediction, chosen because it is simple to implement and rest only on fundamental statistical theory; (2) autoregression prediction of time series, a very common system identification approach; and (3) portfolio selection, a well-studied technique in economic theory to reduce risk. Finally, we present the theory behind our moving window approximation and smoothing implementation.
4.2. Lightweight Single-Host Stateless Price Prediction In this model we assume a normal probability distribution of the spot market price and calculate the budgets needed to get a certain performance level or higher with a probability guarantee, which could be translated into the probability of a job completing within a certain deadline. Based on this information we would like to recommend a user to spend a certain amount of money given a capacity requirement and a deadline. More formally, we first assume that the price y is an outcome of the normal random variable Y Y ∈ N (µ, σ 2 ), y ∈ Y
(3)
p is the probability given by the standard cumulative distribution function Φ, with µ as the measured mean of y and σ 2 as the measured variance. In other words, p is the probability that a resource offers a price less than or equal to y given its variance and mean. p = P (Y ≤
y−µ y−µ ) = Φ( ) σ σ
(4)
The inverse cumulative distribution function, aka the probit quantile function of the normal distribution gives us the price y to expect with a given probability p. y−µ ≤ Φ−1 (p) ⇔ y ≤ µ + σΦ−1 (p) σ
(5)
Combining (1) and (5) gives us the probability p to get the utility U given the budget X. Xn xi,j Ui (Xi , p) ≥ wi,j (6) j=1 xi,j + µj + σj Φ−1 (p) where xi,j is the bid picked by the best response algorithm in (1) with budget Xi on host j for user i. If a user knows that the deadline d can be met if a utility greater than U is obtained, we can use (6) to recommend what budget to spend to meet that deadline, and conversely
what completion time to expect given a budget. For example, the budget X required to meet the deadline d with a certainty of p can be used as a recommendation for the extra cushion of funding needed to meet the deadline with a greater probability. We call this model stateless, since we only need to keep track of running sums to report the mean and standard deviation of the price, and no data points need to be stored.
4.3. Single-Host Price Prediction Analyzing Time Series History Data An autoregressive, AR(k), [32] model based on a time series of CPU price snapshots was implemented using the following steps: First, the unbiased autocorrelation with N sample snapshots of x and lag k is calculated as: R(k) =
1 N − |k|
N −|k|−1
X
xn+|k| xn
n=0
Then the following Yule-Walker linear equation system is solved using the Levinson reformulation: Lα = r where Li,j = R(i − j) is the Toeplitz matrix with k rows and k columns, α is the column vector of k AR coefficients to be solved, and r is a column vector of size k where ri = R(i + 1) Now, future values of the time series xi can be predicted using the coefficients in α as: xN +1 = µ +
k X
αj (xi−j − µ)
j=0
where µ=
N 1 X xn N n=0
Note that we omit the zero mean normal random white noise parameter here for simplicity.
4.4. Risk Management based Performance Prediction across Multiple Hosts We now look at another prediction model for obtaining guidance in funding resources, portfolio theory. We need to obtain the return and plot that against the risk to calculate the efficient frontier where portfolios yield the most
efficient trade-off between the two parameters. The fundamental rule of the frontier is that at a given risk value the return should be maximized and conversely at a given return value the risk should be minimized. We can then apply Morkowitz’s mean-variance optimization [34]. As return we select the performance of the resource calculated as number of CPU cycles per second that are delivered per amount of money paid per second (inverse of spot market price). Given the vectors of return and risk values for the resources, we used the matrix equations from [25] to calculate the risk free portfolio as well as the efficient frontier. By looking at the efficient frontier we can, based on our degree of risk aversion, select a portfolio with an appropriate return. The advantage of the portfolio model is that we do not have to assume a normal probability distribution of the resource price. However, a symmetric distribution around the mean is assumed and it is also assumed that there is a variance in risk between resources that can be traded off with varying mean returns. A similar approach focusing on Value-at-Risk analysis is presented in [16]. Their approach inherits the same strength and weaknesses as the general portfolio theory presented here, but extends it to give guarantees like, within a given time horizon, the minimal performance will be a value V with a probability P . In contrast, the approach presented here gives guidelines of the form, given a certain level of risk aversion and expected performance, how should you distribute your budget across a set of hosts?
4.5. Moving Window Smoothing Theory We first look at the technique used to calculate moving windows for the price average (mean), variation (standard deviation), asymmetry of distribution (skewness), and peak behavior (kurtosis). A high value of skewness reflects a heavy-tailed (right-skewed) distribution, and a high value of kurtosis indicates that a large portion of the standard deviation is due to a few very high price peaks. In terms of state information we only need to keep track of the previously calculated sample moments about the mean for the first (mean), second (standard deviation), third (skewness) and forth (kurtosis) moment about the mean. The linear smoothing function is determined by the window size, where a large window size results in the previously calculated moment having a very low impact on the next moment compared to the current snapshot, and vice versa. For window size 1, the previously calculated moments are ignored as expected. µi,p is the pth sample moment about the mean at snapshot i, xi is the price at snapshot i, n is the number of price samples in a window, σi is the standard deviation of price at snapshot i (for window n), γ1,i is the price skewness at
snapshot i (for window n), and γ2,i is the price kurtosis at snapshot i (for window n) µ0,p = xp0 µi,p = αµi−1,p + (1 − α)xpi α=1− n X
1 n
xpj = µi,p n ⇒ σi =
5.1. Bioinformatics Application q
µi,2 − µ2i,1
j=1
equivalently, γ1,i =
(µi,3 − 3µi,1 µi,2 + 2µ3i,1 ) σi3
and, γ2,i =
(µi,4 − 4µi,3 µi,1 + 6µi,2 µ2i,1 − 3µ4i,1 ) −3 σi4
We now look at the price distribution smoothing for moving time windows. The approach taken is to keep track of two price distributions for each window at all times. The distributions will contain twice as many snapshots as is required by the windows and have a time lag of the same size as the window. The merged window distribution to be retrieved at an arbitrary monitoring time is then calculated by using a share of both distributions proportional to how closely they are to the desired window size in terms of number of snapshots collected. n is the total number of prices in a window, i is the snapshot time, nk,i is the number of prices in distribution array k at time i, (0..2n), sk,j is the proportion of prices in slot j in distribution array k, ri,j is the proportion of prices to report in slot j at snapshot time i, and wi,k is the proportion of distribution array k to use in r at snapshot time i wi,k = 1 −
|n1,i − n| n
|n1,i − n2,i | = n nk X
is very typical for large-scale Grids. The experiments we present here, do not consider applications with more complicated workflow-like interactions among subtasks. However, none of the experiments depend in any way on the application-specific node processing performed by this application, more than the fact that it is CPU intensive.
sk,j = 1 ⇒ ri,j = w1,k s1,j + (1 − w1,k )s2,j
j=1
5. Grid Application Results In this section we present some experimental results using a Bioinformatics application targeted for Grid environments, which was developed at the Bioinformatics laboratory at the Royal Institute of Technology in Stockholm [9]. It is a trivially parallelizable bag-of-task application, which
The goal of the application is to identify protein regions with high or low similarity to the rest of the human proteome. A database of the complete human proteome is analyzed with a blast sequence alignment search tool performing stepwise similarity searches using a sliding window algorithm running in parallel on a distributed compute cluster. The reason for running this application in a compute farm is twofold, the proteome database is continuously evolving and the search is computationally hard. A search on a single machine takes about 8 weeks on a single node, and a run in the SweGrid compute farm utilizing 300 nodes out of 600 takes about 22 hours.
5.2. Experiment Setup The proteome database is partitioned into chunks that can be analyzed in parallel. One of these chunks takes approximately 212 minutes to analyze on a single node in our cluster with a 100% share of a CPU. With 30 physical machines we can thus achieve a maximum performance of 35 hours/application run to be compared with 22 hours/run in SweGrid with 600 machines. In our experiment we are letting five competing users run the same application with different funding. The application makes use of a maximum of 15 nodes out of a total of 30 physical nodes. To have the users compete against each other but not between their own sub-jobs we restrict the setup to one virtual machine per user per physical machine. Hence, a maximum of 75 virtual machines may be used at any point in time. It should be noted that the physical machines have dual processors and there may thus not be competition for a CPU on a machine even though there are multiple users running there concurrently. The user jobs are launched in sequence with a slight delay to allow the best response selection to take the previous job funding into account. This is why users 1 and 2 tend to get to run on more nodes than the other users, as the price has not gone up as much at that point. Their shares will, however, be recomputed automatically and continuously within every 10s allocation interval.
5.3. Best Response Experiments In this set of experiments we are interested in finding out whether an economically driven resource allocation mechanism would allow us to offer differentiated QoS levels to
Nodes 14.5 11
Grid application users. We measure the Time defined as the wall-clock time as perceived by the user to complete the task of sub-jobs, the Cost as the money spent during this time, the Latency as the number of minutes it takes for each sub-job to complete (again in wall-clock time), and the number of Nodes or parallel sub-jobs used by the task. We start by gauging the environment and running the test with all users having the same funding for their jobs. They should hence expect an equal share of the CPUs. We, however, note from the results summarized in Table 1 that users 3-5 received a much lower quality of service, here defined as number of jobs that can be processed within a time unit, because the best response algorithm found it too expensive to fund more than a very low number of hosts. One possible solution to this issue would be to let the user hold back on submitting if not a threshold of minimum hosts to bid on is met. The results from a two-point distribution with users funding their jobs with 100, 100, 500, 500, 500 dollars with a deadline of 5.5 hours is summarized in Table 2. Here we can see that the jobs with a budget of 500 dollars caused the earlier jobs to decrease their shares to allow the more highly funded jobs to complete within their deadline. We again see that fewer hosts were given to user 3-5 but this time the performance level (latency) is better. We also see that these users pay a higher price for their resource usage, as expected.
5.4. Price Prediction Experiments and Simulations In this set of experiments we run the same Grid application job load as in the previous experiments with the difference that we let the total budget of the users be random with a normal distribution. Using the normal distribution analysis presented in Section 4.2, we provide a graph visualization of the price and performance guarantees a user may expect from a host. De-
3000 2500 2000 1500 1000 500
Guarantee 80% Guarantee 90% Guarantee 99%
0
90
Latency(min/job) 29.31 23.46
80
Cost($/h) 5.10 10.9
70
Time(h) 7.07 4.16
60
Users 1−2 3−5
50
Table 2. Two-Point Distribution of Funds
40
Nodes 15 8.7
30
Latency(min/job) 28.66 45.49
20
Cost($/h) 4.19 4.28
10
Time(h) 7.16 6.36
0
Users 1−2 3−5
pending on what guarantee of average performance the user wants, different curves may be followed to decide on how much to spend. For example, looking at the graph in Figure 3 a user who wants 90% guarantee that the CPU performance will be greater than 1.6GHz should spend $22/day when funding the host. There is a certain point where the curves flatten out, and that point would be the recommended budget to spend on that host to get the best performance per funding unit. For the given example it would not make sense for the user to spend more than roughly $60/day. We can also see that to get any kind of feasible performance out of the machine with at least a 80% guarantee the user needs to spend at least $10/day. In this example, we based our prediction on a time window of one day.
CPU Capacity (MHz)
Table 1. Equal Distribution of Funds
Budget ($/day)
Figure 3. Normal distribution prediction with different guarantee levels
The basic AR model presented in Section 4.3 had problems predicting future prices due to sharp price drops when batch jobs completed. To overcome this issue we applied a smoothing function (cubic smoothing spline) before calculating the AR model. To verify the quality of the prediction we took a data sample of 40 hours of price history from our experimental run of Grid jobs described above. The first 20 hours were used to calculate the model and the last 20 hours were used to verify the model. The prediction error was then calculated as follows: n 1 X ε= σi µd n i=1 where µd is the mean of the measured prices in the validation interval, n the number of data points in the validation interval, and σi the standard deviation of the prediction, measurement pair i. An AR(6) model with one hour forecasting (See Figure 4) yielded an ε of 8.96%, whereas a simple benchmark model always predicting the current price to remain for the next hour resulted in an ε of 9.44%. Now, turning to portfolio theory (Section 4.4). There are some issues with this model concerning the definition
6
0.0025
0.0025
0.002
0.002
0.0015
0.0015
0.001
0.001
5.6 5.4 5.2 5 4.8 4.6 4.4 4.2
100
90
80
70
60
40
30
20
0.0005
10
0
0.0005
50
Risk Free Portfolio Equal Share Portfolio
4 3.8
Time
0
0
Figure 5. Risk free portfolio performance vs. equal share portfolio.
45
40
35
30
25
20
15
10
-0.0005 5
-0.0005 0
Time (hours)
1.4e-005
1.2e-005
1e-005
8e-006
6e-006
1 0.9 0.8 0.7 0.6 0.5 0.4 0.3 0.2 0.1 0 4e-006
1 0.9 0.8 0.7 0.6 0.5 0.4 0.3 0.2 0.1 0 2e-006
of risk and asymmetry of distributions as mentioned in Section 4.4, but we also noted in our experiments that a portfolio-based scheduler would not do as well in load balancing batches of user jobs coming in as the best response algorithm which bases its selection on the spot market price, and which could immediately move users away from highbid machines. Portfolio theory may, however, prove useful for long term investments in hosts, e.g. when hosts should be bought to run a continuous application such as a web server. Another observation is that idle hosts tend to get 100% of the share in the portfolio, to avoid this behavior a larger time window needs to be used when collecting the mean and variance statistics from the hosts. To test the risk hedging properties of the portfolios returned by our implementation we ran simulations where 10 hosts are picked either using the calculated risk free portfolio or equal shares. The aggregate performance over time is then measured. Individual mean host performance, performance variance, and variance of performance variances were all randomly generated with a normal distribution. The results, depicted in Figure 5 shows that downside risk could be improved by using the risk free portfolio. Finally, we look at the distribution of prices over three time windows, a week, a day, and an hour. This data can be used to select an appropriate prediction model. For example, if the distribution resembles a normal distribution one could make use of the models described in Section 4.2, if the distribution is symmetric a portfolio analysis may be appropriate. A sample distribution graph is shown in Figure 6. It can be inferred from the graph that the prices exhibit signs of a heavy-tailed distribution (left-skewed) the last hour, mostly fall within the lowest price bracket, but are
right-skewed, mostly in the most expensive bracket when considering a week or day-long window.
0
Figure 4. AR(6) prediction with a one hour forecast and smoothing function.
Probability Density
Price ($/s per CPU cycles/s)
0.003
Predicted Smoothing Measured
Portfolio Performance
0.003
5.8
Price Bracket ($/s per CPU cycles/s) Last Hour
Last Day
Last Week
Figure 6. Price distribution within three different time windows.
To measure how accurate our window approximation is we ran a simulation of different distributions. Normal, Exponential and Beta Distributions were given a time lag of half the window size. At this point there is a maximum influence, or noise, from non-window data. The noise was generated using a uniform random distribution. We noted that normal distributions with a small standard deviation (< 20% of mean) could result in the approximation having its mean shifted slightly compared to the actual distribution. However, in general the approximations followed the actual distributions closely as seen in Figure 7 .
6. Related Work Faucets [27] is a framework for providing market-driven selection of compute servers. Compute servers compete
0.07
0.06
0.06
0.05
0.05
0.04
0.04
0.03
0.03
0.02
0.02
0.01
0.01 100
90
80
70
60
50
40
30
20
0 10
0 0
Probability Density
0.07
Simulated Price Norm(0.5,0.15) Window Approx. Norm(0.5,0.15) Measured Exp(2) Window Approx. Exp(2) Measured Beta(5,1) Window Approx. Beta(5,1) Measured
Figure 7. Window approximation of Normal, Exponential and Beta distributions.
for jobs by bidding out their resources. The bids are then matched with the requirements of the users by the Faucets schedulers. Adaptive jobs can shrink and grow depending on utilization and prioritization. QoS contracts decide how much a user is willing to pay for a job. The main difference to our work is that Faucet does not provide any mechanism for price setting. Further, it has no banking service, use central server based user-name password mechanisms, and does not virtualize resources. Xiao et al. [43] suggest a model where users prioritize their jobs with different budgets and providers schedule jobs based on minimizing penalties from missing promised deadlines. It is argued that a user-initiated auction is more appropriate for lightly loaded system. From our experience with HPC projects like SweGrid, resources are scarce and their is competition for time slots, hence a seller-initiated auction is more appropriate for our work. Chunlin and Layuan [17] propose a two-layered central market. In the first layer the users negotiate with services to meet deadline and budget constraints, in the second layer services purchase resources to meet the user demand. Service and resource prices are set by iteratively adjusting them up and down based on the measured demand and supply, until a market equilibrium is reached. In simulations they show that this model is more efficient in large Grids than a round-robin approach. Our work is less centralized, and thus more scalable and fail-safe, because all resource providers host their own markets. G-commerce [41] is a Grid resource allocation system based on the commodity market model where providers decide the selling price after considering long-term profit and past performance. It is argued and shown in simulations
that this model achieves better price predictability than auctions. However, the auctions used in the simulations are quite different from the ones we use. The simulated auctions are winner-takes-it-all auctions and not proportional share, leading to reduced fairness. Furthermore, the auctions are only performed locally and separately on all hosts leading to poor efficiency across a set of host. In Tycoon the Best Response algorithm ensures fair and efficient allocations across resources [20]. An interesting concept in G-commerce is that users get periodic budget allocations that may expire, which could be useful for controlling periodic resource allocations (as exemplified by NRAC and SNAC [37]) and to avoid price inflation. The price-setting and allocation model differs from our work in that resources are divided into static slots that are sold with a price based on expected revenue. The preemption and agile reallocation properties inherit in the bid-based proportional share allocation mechanism employed in our system to ensure work conservation and prevent starvation is, however, missing from the G-commerce model. Buyya et al. [13] implement a completion time minimizing resource allocation algorithm for bag-of-task applications, utilizing an auctioneer infrastructure akin to the one deployed in Tycoon. The difference to the work presented here is that we use fixed budgets and the best response algorithm to place bids, as opposed to allowing bids to vary between a minimum and maximum value to meet deadlines. This allows us to make more precise statements about the fairness and efficiency of our solution in the equilibrium states. Spawn [40], was one of the first implementations of a computational market, and Tycoon is an incarnation and evolution of many ideas presented in that work. Tycoon, in essence, extends Spawn by providing a Best Response agent for optimal and incentive-compatible bid distribution and host selection, and by virtualizing resources to give more fine-grained control over QoS enforcement. Tycoon also offers a more extensive price prediction infrastructure as presented in this paper. However, the general, continuousbid and proportional share auction architecture is largely the same. Other market based resource allocation systems, not focussing on Grid applications, have been presented in [39, 35, 15, 33]
7. Conclusions We have presented an integrated Grid market of computational resources based on combining a market-based resource allocation system, Tycoon, and a Grid metascheduler and job submission framework, Nordugrid ARC. One of the most challenging integration points was to map the Grid identity to an asserted capability. This prob-
lem was solved by introducing the concept of transfer tokens. This allowed both the private Grid credentials, and the bank account keys to remain local. It also makes it easy for resource users to give out ’gift certificates’, to allow users without a Tycoon client installation to submit (and fund) jobs to the Tycoon cluster. One of the first experiences gained from user feedback of the system was that it was hard to know how much money to use to fund a job. To aid the users in deciding how much funding their jobs would need to complete within a certain deadline, or conversely when a job would be expected to complete given a budget, we developed a suite of prediction models and tools. The accuracy of these predictions depends on the regularity of previous price snapshots and it is therefore crucial, for the results to be good, to pick a time window to study that exhibits these patterns. We therefore also implement a model that allows statistical data within a certain time window to be retrieved, using approximations based on linear smoothing functions. Finally, our experimental results using a Bioinformatics application developed for the Grid, show that the level of performance delivered when submitting a large batch of jobs, can be customized by the incentive compatible use of transfer tokens. Thus the fairness and economically efficiency properties of Tycoon can be carried over to the Grid Market users. Future work includes extending the lightweight prediction model presented here to handle arbitrary distributions and studying how higher-level reservation mechanisms, such as Service Level Agreements, Future Markets, Insurance Systems, and Swing Options can be built on top of the prediction infrastructure presented here to provide more user-oriented QoS guarantees.
[4] EGEE. Enabling Grids for ESciencE. http://egeeintranet.web.cern.ch/egee-intranet/gateway.html, 2005. [5] ESG. Earth System Grid. http://www.earthsystemgrid.org, 2005. [6] NEESit. http://it.nees.org/, 2005. [7] OSG. Open Science Grid. http://www.opensciencegrid.org, 2005. [8] TeraGrid. http://www.teragrid.org, 2005. [9] J. Andrade and J. Odeberg. HapGrid: a resource for haplotype reconstruction and analysis using the computational Grid power in Nordugrid. HGM2004: New Technologies in Haplotyping and Genotyping, April 2004. [10] D. Bosio, J. Casey, A. Frohner, L. Guy, P. Kunszt, E. Laure, S. Lemaitre, L. Lucio, H. Stockinger, K. Stockinger, W. Bell, D. Cameron, G. McCance, P. Millar, J. Hahkala, N. Karlsson, V. Nenonen, M. Silander, O. Mulmo, G.-L. Volpato, G. Andronico, F. DiCarlo, L. Salconi, A. Domenici, R. CarvajalSchiaffino, and F. Zini. Next-generation eu datagrid data management services. In Proceedings of Computing in High Energy and Nuclear Physics, La Jolla, CA, USA, March 2003. [11] Brent N. Chun and Philip Buonadonna and Chaki Ng. Computational Risk Management for Building Highly Reliable Network Services. In Proceedings of the 1st Workshop on Hot Topics in System Dependability, 2005. [12] R. Buyya, D. Abramson, and S. Venugopal. The Grid Economy. Proceedings of the IEEE, Special Issue on Grid Computing, 93(3):479–484, March 2005. [13] R. Buyya, M. Murshed, D. Abramson, and S. Venugopal. Scheduling Parameter Sweep Applications on Global Grids: A Deadline and Budget Constrained Cost-Time Optimisation Algorithm. Software: Practice and Experience (SPE) Journal, 35(5):491–512, April 2005. [14] G. Caronni, T. Curry, P. S. Pierre, and G. Scott. Supernets and snHubs: A Foundation for Public Utility Computing. Technical Report TR-2004-129, Sun Microsystems, 2004. [15] A. Chavez, A. Moukas, and P. Maes. Challenger: a multi8. Acknowledgments agent system for distributed resource allocation. In AGENTS ’97: Proceedings of the first international conference on AuWe thank Bernardo Huberman, Lars Rasmusson, Fang tonomous agents, pages 323–331, New York, NY, USA, 1997. Wu, Li Zhang, and Kate Keahey for fruitful discussions. ACM Press. The Tycoon Grid Market work would not have been possi[16] B. N. Chun, P. Buonadonna, and C. Ng. Computational Risk ble without the funding from the HP/Intel Joint Innovation Management for Building Highly Reliable Network Services. Program (JIP), our JIP liason, Rick McGeer, and our colIn Proceedings of the IEEE First Workshop on Hot Topics in laborators at Intel, Rob Knauerhase and Jeff Sedayao. System Dependability, 2005. The work on the Bioinformatics application was funded [17] L. ChunLin and L. Layuan. A two level market model for by Wallenberg Consortium North Foundation and Vinnova. resource allocation optimization in computational grid. In CF ’05: Proceedings of the 2nd conference on Computing frontiers, pages 66–71, New York, NY, USA, 2005. ACM Press. References [18] S. Clearwater and B. A. Huberman. Swing Options. In Proceedings of 11th International Conference on Computing in [1] Yellow dog Updater, Modified. http://linux.duke.edu/projects/yum/. Economics, June 2005. [2] SUN, Queen’s Univ, First Derivatives to Speed Bank Risk [19] B. Dragovic, K. Fraser, S. Hand, T. Harris, A. Ho, I. Pratt, Analysis. GRID today, 3(30), July 2004. A. Warfield, P. Barham, and R. Neugebauer. Xen and the Art of Virtualization. In Proceedings of the ACM Symposium on [3] The Grid for the Video Industry. GRIDSTART Business Operating Systems Principles, 2003. Newsletter, (2):4, April 2004.
[20] M. Feldman, K. Lai, and L. Zhang. A Price-Anticipating Resource Allocation Mechanism for Distributed Shared Clusters. In Proceedings of the ACM Conference on Electronic Commerce, 2005. [21] I. Foster. Globus toolkit version 4: Software for serviceoriented systems. In IFIP’05: Proceedings of International Conference on Network and Parallel Computing, volume 3799, pages 2–13. LNCS, Springer-Verlag GmbH, 2005. [22] I. Foster and C. Kessleman, editors. The Grid 2: Blueprint for a New Computing Infrastructure. Morgan Kaufmann, 2003. [23] The Future and Emerging Technologies Global Computing Initiative. Technical report, European Commision, DG Information Society, July 2005. [24] S. Graupner, J. Pruyne, and S. Sherad. Making the Utility Data Center a Power Station for the Enterprise Grid. Technical Report HPL-2003-53, Hewlett-Packard Laboratories, 2003. [25] L. J. Halliwell. Mean-Variance Analysis and the Diversification of Risk. Casualty Actuarial Society, St. Louis, Missouri, USA, May 1995. [26] J. Hellerstein, K. Katricioglu, and M. Surendra. An Online, Business-Oriented Optimization of Performance and Availability for Utility Computing . Technical Report RC23325, IBM, December 2003. [27] L. V. Kale, S. Kumar, M. Potnuru, J. DeSouza, and S. Bandhakavi. Faucets: Efficient resource allocation on the computational grid. In ICPP ’04: Proceedings of the 2004 International Conference on Parallel Processing (ICPP’04), pages 396–405, Washington, DC, USA, 2004. IEEE Computer Society. [28] G. Kan. Peer-to-Peer: Harnessing the Power of Disruptive Technologies, chapter Gnutella, pages 94–122. O’Reilly & Associates, Inc., 1st edition, March 2001. [29] K. Lai. Markets are Dead, Long Live Markets. SIGecom Exchanges, 5(4):1–10, July 2005. [30] K. Lai, B. A. Huberman, and L. Fine. Tycoon: A Distributed Market-based Resource Allocation System. Technical report, arXiv, 2004. http://arxiv.org/abs/cs.DC/0404013. [31] K. Lai, L. Rasmusson, E. Adar, S. Sorkin, L. Zhang, and B. A. Huberman. Tycoon: an Implemention of a Distributed Market-Based Resource Allocation System. Technical Report arXiv:cs.DC/0412038, HP Labs, Palo Alto, CA, USA, Dec. 2004. [32] L. Ljung. System Identification: Theory for the User. Prentice Hall, December 1998. [33] T. W. Malone, R. E. Fikes, K. R. Grant, and M. T. Howard. Enterprise: A Market-like Task Scheduler for Distributed Computing Environments. In B. A. Huberman, editor, The Ecology of Computation, number 2 in Studies in Computer Science and Artificial Intelligence, pages 177–205. Elsevier Science Publishers B.V., 1988. [34] H. M. Markowitz. Portfolio Selection. Journal of Finance, 7(1), March 1952. [35] O. Regev and N. Nisan. The Popcorn Market: Online Markets for Computational Resources. In Proceedings of 1st International Conference on Information and Computation Economies, pages 148–157, 1998.
[36] T. Sandholm. emediator: a next generation electronic commerce server. In AGENTS ’00: Proceedings of the fourth international conference on Autonomous agents, pages 341–348, New York, NY, USA, 2000. ACM Press. [37] T. Sandholm, P. Gardfjell, E. Elmroth, L. Johnsson, and O. Mulmo. An ogsa-based accounting system for allocation enforcement across hpc centers. In ICSOC ’04: Proceedings of the 2nd international conference on Service oriented computing, pages 279–288, New York, NY, USA, 2004. ACM Press. [38] O. Smirnova, P. Erola, T. Ekel¨of, M. Ellert, J. Hansen, A. Konsantinov, B. Konya, J. Nielsen, F. Ould-Saada, and A. W¨aa¨ n¨anen. The NorduGrid Architecture and Middleware for Scientific Applications. Lecture Notes in Computer Science, 267:264–273, 2003. [39] M. Stonebraker, P. M. Aoki, W. Litwin, A. Pfeffer, A. Sah, J. Sidell, C. Staelin, and A. Yu. Mariposa: a wide-area distributed database system. The VLDB Journal, 5(1):048–063, 1996. [40] C. A. Waldspurger, T. Hogg, B. A. Huberman, J. O. Kephart, and W. S. Stornetta. Spawn: A Distributed Computational Economy. Software Engineering, 18(2):103–117, 1992. [41] R. Wolski, J. S. Plank, T. Bryan, and J. Brevik. G-commerce: Market formulations controlling resource allocation on the computational grid. In IPDPS ’01: Proceedings of the 15th International Parallel and Distributed Processing Symposium (IPDPS’01), page 10046.2, Washington, DC, USA, 2001. IEEE Computer Society. [42] F. Wu, L. Zhang, and B. A. Huberman. Truth-telling Reservations. http://arxiv.org/abs/cs/0508028, 2005. [43] L. Xiao, Y. Zhu, L. M. Ni, and Z. Xu. Gridis: An incentivebased grid scheduling. In IPDPS ’05: Proceedings of the 19th IEEE International Parallel and Distributed Processing Symposium (IPDPS’05) - Papers, page 65.2, Washington, DC, USA, 2005. IEEE Computer Society.