Research Journal of Finance and Accounting ISSN 2222-1697 (Paper) ISSN 2222-2847 (Online) Vol 2, No 9/10, 2011
www.iiste.org
Market Efficiency, Market Anomalies, Causes, Evidences, and Some Behavioral Aspects of Market Anomalies Madiha Latif* Shanza Arshad,
Mariam Fatima,
Samia Farooq
Institute of Management Sciences Bahauddin Zakaria University, Multan, Pakistan Email:
[email protected] Abstract Market efficiency hypothesis suggests that markets are rational and their prices fully reflect all available information. Due to the timely actions of investors prices of stocks quickly adjust to the new information, and reflect all the available information. So no investor can beat the market by generating abnormal returns. But it is found in many stock exchanges of the world that these markets are not following the rules of EMH. The functioning of these stock markets deviate from the rules of EMH. These deviations are called anomalies. Anomalies could occur once and disappear, or could occur repeatedly. This literature survey is of its own type that discusses the occurrence of different type of calendar anomalies, technical anomalies and fundamental anomalies with their evidences in different stock markets around the world. The paper also discusses the opinion of different researchers about the possible causes of anomalies, how anomalies should be dealt, and what ere the behavioral aspects of anomalies. This issue is still a grey area for research. Key Words: EMH, CAPM, Calender Anomalies, Technical Anomalies, Fundamental Anomalies. 1. Introduction: According to efficient market hypothesis markets are rational and prices of stocks fully reflect all available information. The securities prices quickly adjust to new information as readily that information is available. But according to behavioral finance this kind of efficient market cannot explain the observed anomalies in Market anomalies are the unusual occurrence or abnormality in smooth pattern of stock market. Different researchers like Agrawal & Tendon (1994), Gultekin & Gultekin (1983), and Ariel (1984) exhibited the existence of observed anomalies with their evidences in different stock exchanges of world. But yet the evidences on anomalies are debatable. This review paper explains the market anomalies in both aspects: with respect to market efficiencies and as well as behavioral aspect. The 2nd section of paper will explain market efficiency, forms of market efficiency, fundamental and technical analysis. 3rd section defines market anomalies with three major types of anomalies. For the sake of convenience we divide the anomalies into three types i.e. Fundamental anomalies, technical anomalies and calendar anomilies.Section 4th will explain existence, evidences and possible causes of all of these types of anomalies. .While section 5th includes possible explanation of anomalies with the help of different models of finance. And the final section concludes the whole discussion. 2. Efficient Market Hypothesis Efficient market hypothesis is one of the important paradigms of traditional finance theories. Fama (1970) defined efficient market as a market as a market with large numbers of rational profit maximizing individuals actively competing with each other and doing attempts to predict future market values of individual securities, and where all important relevant information is almost freely available to all investors.
1
Research Journal of Finance and Accounting ISSN 2222-1697 (Paper) ISSN 2222-2847 (Online) Vol 2, No 9/10, 2011
www.iiste.org
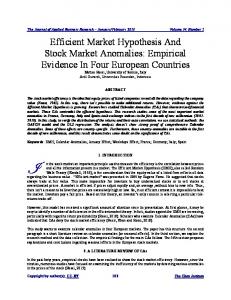
Fig.1Market reaction to surprising favorable event. Fig.2 Market reaction to predictable favorable event The Above figures shows the situation of market, in case of unpredictable event, if the market is efficient, stock prices immediately reflect effect of new event, but it will take some time for the prices to adjust new information, if the market is not efficient. While in the case of predictable event, before the happening of event, prices of stocks will rise, and quickly adjust at the event date, if the market is efficient. (Chuvakhin, 2009) 2.1. Forms of market Efficiency Relevant information includes past information, publicly available information and private information. On the basis of relevant information efficient market is divided into three stages, weak form, semi strong form and strong form. In weak form of EMH, all the past information including past prices and returns is already reflected in the current prices of stocks (Bodie et al. 2007).The assumption of weak form is consistent with random walk hypothesis i.e. stock prices move randomly, and price changes are independent of each other. So if the weak form holds, no one can predict the future on the basis of past information. And no one can beat the market by earning abnormal returns. Therefore, the technical (trend) analysis, in which analysts make the chart of past price movements of stocks to accurately predict future price changes, is of no use (Bodie et al. 2007). However, one can beat the market and get abnormal returns on the basis of fundamental analysis or on the basis of private information (insider trading).
In the semi strong form, current stock prices reflect all publicly available information as well as past information. So no one can make extra profit on the basis of fundamental analysis (Bodie et al. 2007). However, one can beat the market by insider trading. In the strong form of market efficiency, all relevant information including past, public and private information is reflected in the current stock prices. So if the strong form persists, then no one can beat the market in any way, not even by insider trading (Brealey et al.
2
Research Journal of Finance and Accounting ISSN 2222-1697 (Paper) ISSN 2222-2847 (Online) Vol 2, No 9/10, 2011
www.iiste.org
1999). 3. Financial Market Anomalies. Literary meaning of an anomaly is a strange or unusual occurrence. The word anomaly refers to scientific and technological matters. It has been defined by George & Elton (2001) as irregularity or a deviation from common or natural order or an exceptional condition. Anomaly is a term that is generic in nature and it applies to any fundamental novelty of fact, new and unexpected phenomenon or a surprise with regard to any theory, model or hypothesis (George & Elton 2001). Anomalies are the indicator of inefficient markets, some anomalies happen only once and vanish, while others happen frequently, or continuously (Tversky & Kahneman 1986) defined market anomalies as “an anomaly is a deviation from the presently accepted paradigms that is too widespread to be ignored, too systematic to be dismissed as random error, and too fundamental to be accommodated by relaxing the normative system”. While in standard finance theory, financial market anomaly means a situation in which a performance of stock or a group of stocks deviate from the assumptions of efficient market hypotheses. Such movements or events which cannot be explained by using efficient market hypothesis are called financial market anomalies (Silver 2011).For the sake of convenience, Anomalies can be divided into three basic types.,1.Fundamental anomalies2.Technical anomalies .3.Calendar or seasonal anomalies. 3.1. Calendar Anomalies. Calendar anomalies are related with particular time period i.e. movement in stock prices from day to day, month to month, year to year etc .these include weekend effect, turn of the month effect, year-end effect etc (Karz 2011). Calendar anomalies
Description
Study conducted and article
Weekend Effect:
The stock prices are likely to fall on Monday. Means the closing price of Monday is less than the closing price of previous Friday.
Smirlock & Starks (1986)
Turn-of-the-Month Effect:
Turn-of-the-Year Effect
January Effect:
•
•
The prices of stocks are likely to increase in the last trading day of the following month, and the first three days of next month.
Nosheen et al. (2007)
This anomaly describes the increase in the prices of stocks and trading volume of stock exchange in the last week of December and the first half month of January.
Agrawal & Tandon (1994)
The phenomenon of small-company stocks to generate more return than other asset classes and market in the first two
3
Agrawal & Tandon (1994)
Keims (1983) Chatterjee
& Manaiam (1997)
Research Journal of Finance and Accounting ISSN 2222-1697 (Paper) ISSN 2222-2847 (Online) Vol 2, No 9/10, 2011
www.iiste.org
to three weeks of January is called January effect. Fundamental anomaly
Value anomaly
Description
Author
Value anomaly occurs due to false prediction of investors. They overly estimate the future earnings and returns of growth companies and underestimate the future returns and earnings of value companies
Graham & Dodd (1934)
Low Price to Book
The stocks with low price to book ratio generate more return than the stocks having high book to market ratio.
Fama (1991)
High Dividend Yield
Stocks with high dividend yield outperform the market and generate more return. If the yield is high, then the stock generates more return.
Fama & French (1988)
Low Price to Earnings (P/E)
The stocks with low price to earnings ratio are likely generate more returns and outperform the market, while the stocks with high price to earnings ratios tend to underperform than the index.
Goodman & Peavy (1983)
Neglected Stocks
The prior neglected stocks generate more return subsequently over a period of time. While the prior best performers consequently underperform than the index.
De bondt & thaler (1985)
3.2. Fundamental Anomalies:Fundamental anomalies include Value anomalies and small cap effect, Low Price to Book,high dividend yield, Low Price to Sales (P/S),Low Price to Earnings (P/E) (Karz 2011). 3.3. Technical Anomalies "Technical Analysis" includes no. of analyzing techniques use to forecast future prices of stocks on the basis of past prices and relevant past information. Commonly technical analysis use techniques including strategies like resistance support, as well as moving averages. Many researchers like Bodie et al. (2007) have found that when the market holds weak form efficiency, then prices already reflected the past information and technical analysis is of no use. So the investor cannot beat the market by earning abnormal returns on the basis of technical analysis and past information. But here are some anomalies that deviate
4
Research Journal of Finance and Accounting ISSN 2222-1697 (Paper) ISSN 2222-2847 (Online) Vol 2, No 9/10, 2011
www.iiste.org
from the findings of these studies.
Technical anomaly
Description
Article
Moving Averages
An important technique of technical analysis in which buying and selling signals of stocks are generated by long period averages and short period averages. In this strategy buying stocks when short period averages raises over long period averages and selling the stocks when short period averages falls below the long period averages.
Brock(1992)
This technique of technical analysis is based upon resistance and support level. A buy signal is created when the prices reaches at resistance level, which is local maximum. As investor wants to sell at peak, this selling pressure causes the resistance level to breakout than previous level. This breaks out causes a buy signal. A selling signal is created when prices reaches the support level which is minimum price level. Thus technical analysis recommends buying when the prices raises above last peak and selling when prices falls below last trough. But this strategy is difficult to implement.
Brock(1992)
Trading Range Break
Josef (1992) Lakonishok etal. (1992)
Josef (1992) Lakonishok (1992)
et al.
4. Evidences of different types of anomalies. 4.1calender anomalies Calendar and time anomalies contradict the weak form efficiency because weak form efficiency postulates that markets are efficient in past prices and cannot predict future on theses bases. But existence of seasonality and monthly effects contradict market efficiency and in this case investors can earn abnormal return (Boudreaux 1995). Agrawal & Tandon (1994) examine the presence of calendar anomalies in eighteen countries and compared it with the USA.The Calendar anomalies that they considered in their studies are weekend effect, turn-of-the-month effect, the Friday-the thirteen effect, January effect and end-of-December effect Seasonal effect Seasonal influence is found in international markets, in Australian market (Officer ,1975) in Italian Tokyo stock exchange (Ziemba 1991). According to Yakob et al. (2005) there were seasonality effects in ten Asian pacific countries for period of January 2000 to march 2005.They founded that this period was ideal period for examine this effect because of stability and is not influenced by financial crisis of late nineties. Doren et al. (2008) found high volatility in Chinese stock market and that Chinese stocks outperform during the season of new year but not in January. Monday effect Many evidences are present that ensure the presence of weekend effect in United States. Mondays average returns are found to be negative (Starks 1986). Days-of-week effect This effect entails the difference in return of days in week. The findings have been lowest returns on Monday and exceptionally high return on Friday than other days of week (Hess 1981) .Largest variance on
5
Research Journal of Finance and Accounting ISSN 2222-1697 (Paper) ISSN 2222-2847 (Online) Vol 2, No 9/10, 2011
www.iiste.org
Monday and lowest is on Friday. There is mixed findings on it. Dubois & louvet (1995) found that in European countries, Hong Kong and Canada lower return for beginning of week but not necessarily on Monday. Agrawal & Tendon (1994) found that out of 19 countries there are negative Monday returns in nine countries and negative Tuesday return in eight countries. Also the Tuesday returns are lower than Monday returns in those countries. Negative Monday and positive Friday effects are not observed in Indian market (kumari).It was founded that Tuesday returns are negative in Indian markets, while the Monday returns were significantly greater than other days. It was because of settlement period in India i.e. 14 days period that starts on Monday and ends at Friday. Agrawal & Tendon (1994) concluded in the findings that weekend effect is present in the half of the countries. While in the other countries the lowest return are on the Tuesday. Cause: Trading timing-On study on weekend effects shows that negative return on Monday is due to non-trading period from Friday to Monday and that Monday returns are actually positive (Rogalski 1984). Month of the year effect –January effect This effect reflect variation in return of different months in a year (Gultekin & Gultekin 1983).This January effect is related to the size of firms small capitalization firms outperform than large capitalization. Causes: January returns are greatest due to yearend tax loss selling of shares disproportionally (Branch 1977). Ligon (1997) found that January effect is due to large liquidity in this month. There are higher January volume and lower interest rates correlates with greater returns in January. According to watchel (1942) there are higher returns on Monday than other months in year. Rozeff & Kinney (1976) found that in New York exchange average return is 3.5% than other months 0.5% in period 1904 to 1974.The general argument is that January effect is due to tax-loss hypothesis investors sell in December and buy back in January. Keong (2010) concluded that most of the Asian markets exhibit positive December expect Hong Kong, Japan, Korea and china. Few countries also exhibit positive January, April and may effect and only Indonesia exhibit negative august effect. January effect is due to tax loss saving at the end of the tax year, portfolio rebalancing and inventory adjustment of different traders and the role of exchange specialist (Agrawal & Tandon 1994). Year end effect According to Agrawal & Tandon (1994) the possible reason of the year end effect is attributed to window-dressing and inventory adjustment by institutions and pension fund managers. Intra –monthly anomaly Ariel (2002) observed monthly return in United States stock index return. It was found that stocks earn positive average return in beginning and first half of month and zero average return in second half of month. Weak monthly effects have been observed in foreign countries (Jaffe & Westerfield 1989). Australia, United Kingdom and Canada showed same pattern as Ariels found in United States while Japan had opposite effect. Australia and Canada had positive monthly effects while Japan market had negative monthly effects (Boudreau, 1995). Boudreau (1995) extended Jaffe & Westerfield (1989) results and observed monthly effects in Denmark, France, Germany , Norway, Switzerland and negative effect is founded in Asian pacific basin market of Singapore/Malaysia. According to Hensel (2011) cause of occurrence of higher short-term equity return anomalies i.e.Cash flow increased just after and before specific period causes anomalous return,Behavioral constraints as investors feeling and emotions that leads towards sale and purchase of specific equities,Timing constraints like delay in unfavorable reporting,and Slow react of market towards new information Turn of the month effect According to this calendar anomaly the mean returns in early days of the month are higher than other days
6
Research Journal of Finance and Accounting ISSN 2222-1697 (Paper) ISSN 2222-2847 (Online) Vol 2, No 9/10, 2011
www.iiste.org
of the month (Nosheen et al. 2007). Cadsby & Ratner (1992) studied turn of the month effect for USA, Canada, Switzerland, Germany, UK and Australia while no such effect they found in Japan, Hong Kong, Italy and France.Nosheen et al. (2007) reported Turn of the month effect in KSE of Pakistan and stated that turn of the month effect and time of the month effect is almost same. While turn-of- the- month effect which is the large returns on the last trading day of the month is found in fourteen countries (Agrawal & Tandon 1994). Causes. Nosheen et al. (2007 ) the reason behind the turn of the month effect is due to the mental behaviour of the investors that they sell their shares at the end of the month and expect the positive change for the next month and release of new information at the end and start of the new month. Investors in this way get maximum benefit by selling at the end of the month and repurchasing at the start of the new month so that these incorporate new information (Nosheen et al. 2007). 4.2. Fundamental anomalies with their evidences:Value versus growth anomaly According to Graham & Dodd (1934) value strategies outperform the market. In value strategies the stocks that have low price relative to earning, dividend, historical prices are buy out. The value stocks perform well with respect to growth stocks because of actual growth rate or sales of growth stocks are much lower than value stocks. But market overestimate the future growth of growth stocks (Lakonishok 2002; Shleifer et al. 1993).Individual investors overestimate because of two reasons. Firstly they make judgment errors and secondly they mainly focus upon past performance or growth although that growth rate is unlikely to persistent in future. But institutional investors are free from judgmental error but they prefer growth stocks because sponsor prefer these companies who outperformed in past (Lakonishok 2002; Shleifer et al. 1992).Another factor that why money managers prefer growth stock over value stocks because of time horizon individuals prefer stocks that earn abnormal return within few months rather than to wait for a month (Shleifer et al. 1993) Some researchers are of the point of view that superior performance of value stocks are due to its riskiness. But according to Lakonishok (2002) value stocks are not more risky than growth stock based on indicators like beta and return volatility. According to them growth stocks are more affected in down market than value stocks. Price to earnings ratio anomaly It refer to that stocks with low P/E ratio earn large risk adjusted return than high P/E ratio because the companies with low price to earnings are mostly undervalued because investors become pessimistic about their returns after a bad series of earning or bad news. A company with high price to earning tends to overvalued (De bondt & thaler 1985). Dividend yield anomaly:Numerous studies have supported this idea that high dividend yield stock outperforms the market than the low dividend yield stocks. According to Yao et al (2006) stocks with high dividend yield and low payout ratio outperform than the stocks with low dividend yield. Overreaction anomaly: Loser stocks overreact to market than winner stock because overreaction effect is much large for loser than winner stocks (De bondt & thaler, 1985). Ex-dividend date anomaly: According to Sabet et al Ex-dividend anomaly is characterized by abnormal return on that date. They found evidence that there is negative and non-significant return on ex-dividend date and there is positive and significant return on day before the dividend day payment. Low price to sale
7
Research Journal of Finance and Accounting ISSN 2222-1697 (Paper) ISSN 2222-2847 (Online) Vol 2, No 9/10, 2011
www.iiste.org
Stocks with low price to sales ratio tends to outperform than market averages. Companies may face the earning difficulties eventually the prices decline. A decline in sales is more serious than decline in earning. If sales holds up management can recover the earning difficulties, causes a rise in stock price and if sales decline than the stock price will be affected (Web page Market Anomaly)
4.3. Evidence on Technical anomaly Momentum Effect. Hons & Tonks (2001) investigated the trading strategies such as momentum effect in the Us stock market and found that these momentum strategies are present in the stock market in the period of 1977-1996.According to their study investors can gain the advantage by using the momentum strategies .It is the positive autocorrelation in returns for a short period of time and by buying past winners and selling past losers they can gain the abnormal profits (Hons & Tonks 2001). Portfolio is formed by arranging the stocks returns in and ranking them. The top ranked stocks are labeled as losers’ portfolio and the bottom are labeled as winners’ portfolio. But these strategies generate profits only when asset prices exhibit over-recation.Their studies shows that returns on winners’ portfolio are greater than returns on loser’s portfolio because the winner’s portfolio are more riskier than the loser portfolio. 5.Opinions of different researchers about the possible causes of occurrence of anomalies In 1970 the returns were being measured in case if the market is efficient by the joint test of the EMH and CAPM and the results were that there is a fair chances to earn the abnormal returns by using the trading techniques and in 1978 these were named as the anomalies by the journal of financial economics. In start the existence of the anomalies were being denied and wasn’t treat as the counter rather being perceived as the unexpected phenomenon, a surprise and as an anomaly without the full explanation of the term (Kuhn 1977). They don’t have any difference between the counter evidence and the anomaly rather for them; the anomaly is nothing more than an counterevidence with the dishonest euphemism (Lakatos 1970). With the passage of time different researchers developed different opinions about the possible causes of the occurrence of the anomalies. Kuhn (1977) says that the anomalies occur for some specific group with which everything was going right and now they have to face the crisis during their experiments consistently going wrong. Anomalies could be due to the fact that the social sciences fail to incorporate the qualitative aspect of the phenomenon in combination to the quantitative aspect (Frankfurter & McGoun 2001). This fact is being also explained by the Kuhn (1970), the qualitative aspect of the phenomenon is basically the cause of the anomaly which needs to be incorporated in the theory. While Gentry (1975) says that the difference between the market data and the assumption on which the theories are made is the anomaly. In short, according to Gentry (1975) the difference of actual and the expected results of the market line theory is the anomaly. But Jensen (1978) sees the anomalies as our limited scope and exposure to the data and as the outcome of the new data and refined data become available to us, we become finding the inconsistencies in the cruder data and the unrefined techniques we have been using in the past and when the anomalies would be studied in detail they would help to better understand the market efficiency. Next Watt (1978), states that the abnormal returns are due to the inefficiencies in the financial markets, not due to the deficiencies in the asset pricing model. Frankfurter & McGoun (2001) proved that the word anomaly in start was being used as the deviation from the AMH/CAPM but lately named as the BF (Fama, 1998) and thus resulting in the rejection of the EMH/CAPM. According to them anomaly has now taken the place as the synonym of the BF which is also roughly being termed as the “literature of anomalies” (Fama 1998). Furthermore Frankfurter & McGoun (2001) placed BF as the alternative approach to the EMH/CAPM.
8
Research Journal of Finance and Accounting ISSN 2222-1697 (Paper) ISSN 2222-2847 (Online) Vol 2, No 9/10, 2011
www.iiste.org
5.1.How the anomalies should be dealt: The anomalies large enough to cause the hindrance in the normal research should be resolved and if its not that larger, then it could be left (Ball 1978) and Kleidon (1987) says that there is the need of the change of disciplinary foundation for the explanation of the anomalies. Kuhn (1977) perceives anomalies as beneficial for the finance itself and says that though most of the times the anomalies do not result in the discovery of something new but they do break the existing paradigm thus causing in the emergence of the new theories. Another important aspect discussed by the Kuhn (1970) is about the replacement of the paradigm. In science you need to have another paradigm to replace the existing one and if you don’t have then rejecting the existing paradigm is rejecting the science itself. There are hundreds of the anomalies existing but we don’t regard them until we have a better one to replace EMH/CAPM (Lakatos 1970). In short we can code the Fama (1998) argument that until and unless behavioral finance do not prove itself as a better theory from the EMH/CAPM, the presence of anomalies can’t shake the pillar of efficient market hypothesis , no matter how many of them are being discovered. 5.2.Behavioral explanation of anomalies: Failure of different models based on rationale: Different models are being given in different times but many of them fail to explain the causes of the anomalous behavior of the assets. The three factor model of Fama & French (1993) give a model for the analysis of the risk factors but Daniel & Titman (1997) criticized the three factor model that it has no explanation for the long tem effect and the momentum returns for the assets. Next the non-linear model of the Berk et al. (1996) has the explanation for the value premium, size-effect and the momentum effect but failed in the reproducing of the contrarian and the momentum effect and according to Wrouter (2006) the model was quite difficult in use for the empirical testing. And when we talk about the model of Zhang (2000), according to Wrouter (2006), it totally failed to explain the anomalies. Now consider the division of the investors by Boudoukh et al (1994). According to Boudoukh et al.(1994), there are three schools of thought giving the possible explanation of the financial market anomalies: revisionists, loyalists and the heretics.Revisionists thought that markets are efficient and studied the EMH with the time varying economic risk premium. Second are the loyalists who also believe that the markets are efficient and problems are due to the measurement errors in the data. But third school of thought is completely having the different point of views and says that the market is not rational rather they make decisions on the basis of some psychological factors. Wouters (2006) further categorized them into two groups; loyalist and revisionists as the rationalists and heretics as the behaviorists.Wouters (2006) further explains the rationalists as those who believes that the financial markets are efficient and the abnormal returns are either by chance or due to the common risk factors which are being ignored in the initial analysis of stock returns. Wouters (2006) further explains that the behaviorists make their decisions on the basis of the sentiments. The behaviorists are of the view that the all participants are not required to be the rationales rather a small number is being required which drive the whole market. This results in the mispricing of securities and thus results in the market anomalies and the cause is the sentiments of the investors. Behavioral Cause of the overreaction and under reaction of the financial market: According to Wouters (2006) the under and overreaction of the market are due to the psychological reasons of the investors. Barberis & Sheilfer (1998) argues that the under reaction is the result of the conservatism of the investor as the investors do react to the prior information but don’t with the same amount as being required by the information to do and stick to the prior information expecting that the security would do the same as it is being doing in the past. Their finding are consistent with the Author Edwards (1968) describing the slow reaction of the investor, named as conservatism, causing the under reaction. Tversky & Kahneman (1974) described an important aspect of the human behavior representativeness bias which,
9
Research Journal of Finance and Accounting ISSN 2222-1697 (Paper) ISSN 2222-2847 (Online) Vol 2, No 9/10, 2011
www.iiste.org
according to Barberis & Sheilfer (1998) results in overreaction as the investor with the recent information, perceives the same performance in the future as well and overvalues the security and then come to the disappointment resulting to the equilibrium Behavioral Cause of momentum effect and contrarian effect: Barberis & sheilfer (2003) divided the investors on the basis of different investing styles and argued that the investors invest according to the different styles, based upon the past performance, the cause of momentum effect, ending in the price bubble and the herd behavior of the investors in which they invest in the assets on the basis of the common style of investment prevailing in the market giving birth to the continuous rise of fall or the asset prices. Wouter (2006) describe the presence of the positive autocorrelation. Though, they further argued, the prices would come to the equilibrium in long run but this behavior causes the positive autocorrelation in the short run and thus the momentum effect in the short run as well as the contrarian effect in the long run as the in the long run the autocorrelation goes negative. 6. Conclusion: As the efficient market hypothesis defines efficient market is that where all the investors are well informed about all the relevant information about the stocks and they take action accordingly. Due to their timely actions prices of stocks quickly adjust to the new information, and reflect all the available information. So no investor can beat the market by generating abnormal returns. In the weak form of efficient market technical analysis is useless, while in semi strong form, both the technical and fundamental analysis is of no use. And in strong form of efficient market even the insider trader cannot get abnormal return. But it is found in many stock exchanges of the world that these markets are not following the rules of EMH. The functioning of these stock markets deviate from the rules of EMH. These deviations are called anomalies. Anomalies could occur once and disappear, or could occur repeatedly. From the study of anomalies we can conclude that investor can beat the market, and can generate abnormal returns by fundamental, technical analysis, by analyzing the past performance of stocks and by insider trading. There is a lot of researches is done on the existence of various types of abnormalities or deviations of stocks returns from the normal pattern so called anomalies. Different authors segregated anomalies into different types. But there are three main types a) calendar anomalies b) fundamental anomalies c) technical anomalies. Calendar anomalies exist due to deviation in normal behaviors of stocks with respect to time periods. These include turn-of-year, turn-of week effect, weekend effect, Monday effect and January effect. There are different possible causes of theses anomalies like new information is not adjusted quickly, different tax treatments, cashflow adjustments and behavioral constraints of investors. Another type is fundamental anomalies which includes that prices of stocks are not fully reflecting their intrinsic values. These include value versus growth anomaly dividend yield anomaly, overreaction anomaly, price to earnings ratio anomaly and low price to sales anomaly. Value strategies outperform than growth stock because of overreaction of market and growth stocks are more affected by market down movement. Dividend yield anomaly is that high dividend yield stocks outperform the market. Stocks having low price to earnings ratio outperform. Technical anomalies are based upon the past prices and trends of stocks. It includes momentum effect in which investors can outperform by buying past winners and selling past losers.Techncial analysis also includes trading strategies like moving averages and trading breaks which includes resistance and support level. Based upon support and resistance level investors can buy and sell stocks. Yet a lot of research is needed about the causes of these anomalies because it is yet debatable. References: 1. Agrawal, A. And k. Tandon (1994). “Anomalies or illusions? Evidence from stock markets in eighteen countries." Journal of International Money and Finance, 13, pp.83-106. 2. Ariel, R. A. (1987). "A Monthly Effect in Stock Returns." Journal of Financial Economics, 18(1), pp.161-174. 3. Ariel, R. A. (May 1, 2002). "A Monthly Effect in Stock Returns." Journal of Financial Economics, 18(1),
10
Research Journal of Finance and Accounting ISSN 2222-1697 (Paper) ISSN 2222-2847 (Online) Vol 2, No 9/10, 2011
www.iiste.org
pp.161-174. 4. Blandón, J.G, M.M.Blasco, et al. "The Ex-Dividend Day Anomaly in the Spanish Stock Market”9th Global Conference on Business and Economics. Cambridge University, UK October 16-17, 2009. 5. Bodie,Z.A.Kane.A.J. Marcus. 2007. Essentials of investments, 6th edition, McGraw- Hill / Irwin 6. Brealey, R. A. S. C. Myers.A. J. Marcus. 1999. Fundamentals of corporate finance, 2nd Edition, McGraw-hill. 7. Boudreaux*, D. O. (1995). "The Monthly Effect In International Stock Markets: Evidence and implications." Journal of Financial and Strategic Decisions, volume 8 number 1. 8. Brock, W. Josef lakonishok, et al. (1992). "Simple Technical Trading Rules and the Stochastic Properties of Stock Return." Journal of Finance, 47. 9. Cadsby, C.B.and M.Ratner (1992)."Turn-Of-Month and Pre-Holiday Effects On Stock Returns:Some International Evidence." Journal Of Banking & Finance, 16(3),pp. 497-509. 10. Chuvakhin, N. "Efficient Market Hypothesis and Behavioral Finance -Is A Compromise in Sight?” 11. Doran, J., Jiang, D., & Peterson, D. (2009). “Gambling Preference and the New Year Effect of Assets with Lottery Features”. MPRA Paper. 12. F.fama, E. (1970). "Efficient Capital Markets: A Review of Theory and Empirical Work." Journal of Finance 2, 383-417. 13. Fama, E. F. (1991). "Efficient Capital Markets." The Journal of Finance, 46(5), pp.1575-1617. 14. Fama, E. F. And k. R. French (1988). "Dividend Yields and Expected Stock Returns." Financial Economics, 22(1), pp. 3-25.
Journal of
15. French, E. F. F. A. K. R. (1993). "Common Risk Factors in the Returns On The Stocks And Bonds." Journal of Financial Economics, pp.33-53. 16. George M. Frankfurtera, Elton G. Mcgoun (2001). "Anomalies in Finance What Are They and What are They Good For?" International Review of Financial Analysis, 10, p. 22. 17.Goodman, D. A. and J. W. Peavy,(1983). "Industry Relative Price-Earnings Ratios as Indicators of Investment Returns." Financial Analysts Journal, 39(4), pp. 60-66. 18. Graham, D. Cottle. (1962). “Security Analysis: Principles and Techniques”, New York, McGraw-Hill. 19. Gultekin, M. N.& Gultekin, N. B. (1983).”Stock market seasonality*1:International Evidence”. Journal of Financial Economics, 12(4), pp. 469-481. 20. Ziemba, W., & Hensel, C. (1994). “Worldwide security market anomalies”. Philosophical Transactions of the Royal Society of London. Series A: Physical and Engineering Sciences, 347(1684), pp. 495-509. 21. Gibbons, M. R., & Hess, P. (1981). “Day of the week effects and asset returns”. Journal of Business, pp.579-596. 22. Hon, M. T., & Tonks, I. (2003). “Momentum in the UK stock market”. Journal of Multinational Financial Management, 13(1), pp.43-70. 23. Jacob boudoukh, M. P. R., Robert F. Whitelaw (1994). "A tale of three scholls: insight on autocorrelation of white horizon stock returns." Review Of Financial Studies, 7(3),p 32. 24. Jensen, M. (1978).”Some anomalous evidence regarding market efficiency”. Journal of Financial Economics, Vol. 6, Nos. 2/3, pp. 95-101. 25. Tversky, A., & Kahneman, D. (1986). Rational choice and the framing of decisions. Journal of Business, pp.251-278. 26.Karz,G.“Historical Stock market anomalies”. [Online](2010) available at:
11
Research Journal of Finance and Accounting ISSN 2222-1697 (Paper) ISSN 2222-2847 (Online) Vol 2, No 9/10, 2011
www.iiste.org
http://www.investorhome.com/anomaly.htm.[accessed 8 January 2012]. 27. Kleidon, A. W. (1986). Anomalies in Financial Economics: Blueprint for Change? Journal of Business,pp. 469-499. 28. Kuhn, T. S. (1996). “The structure of scientific revolutions”: University of Chicago press. 29. Raj, M., & Kumari, D. (2006). “Day-of-the-week and other market anomalies in the Indian stock market”. International Journal of Emerging Markets, 1(3),pp. 235-246. 30. Lakatos, I. (1970). “History of science and its rational reconstructions.” 31. Lakonishok, J., Shleifer, A, Vishny, R. W., Hart, O., & Perry, G. L. (1992). “The structure and performance of the money management industry”. Brookings Papers on Economic Activity. Microeconomics, 1992, 339-391. 32. Lakonishok, J., Vishny, R. W., & Shleifer, A. (1993). “Contrarian investment, extrapolation, and risk”, National Bureau of Economic Research. 33. Lakonishok, l. K. C. C. A. J. (July 2002). "Value and Growth Investing". 34. Ligon, j. A. (1997). "A Simultaneous Test of Competing Theories Regarding the January Effect”, 2 (1), pp. 13-23. 35. Lim boon keong*, d. N. C. Y. A. C. H. L. (2010). "Month-of-the-year effects in Asian countries: a 20-year study." African Journal of Business Management, 4(7), pp. 1351-1362. 37. M. Dubois A, P. Louvet (1995). "The Day-Of-The-Week Effect: The International Evidence." Journal of Banking and Finance. 38. N.patel, p., s. Yao, et al. (2006). "High yield,low payout." 39. Barberis, N., & Shleifer, A. (2003). “Style investing. Journal of Financial Economics”, 68(2), pp.161-199. 40. OfficeR, R. R. (1975). "Seasonality in Australian Capital Markets: Market Efficiency and Empirical Issues." Journal of Financial Economics 2(1), pp.29-51. 41. Rogalski, R. J. (1984). "New findings regarding day-of-the-week returns over trading and non-trading periods: a note." Journal of Finance, pp.1603-1614. 42. Rozeff, M. S. And W. R. Kinney (1976). "Capital Market Seasonality: The Case of Stock Returns."Journal of Financial Economics 3(4), pp.379-402. 43. Shiller, R. J. (1998). "Human Behavior and the Efficiency of the Financial System." national bureau of economic research,34. 44. Silver, T. (2011). Making sense of market anomalies.[online] www. Investopedia.com 45. Starks, M. S. L. (1986). "Day-of-the-week and intraday effects in stock returns*." 46. Thaler, w. F. M. D. B. R. (1984). "Does The Stock Market Overreact?" Journal Of Finance 40,pp. 793-805. 47. Wachtel, S. B. (1942). “Certain observations on seasonal movements in stock prices”. The Journal of Business Of The University Of Chicago, 15(2), 184-193. 48. Watts, R. L. (1978). “Systematic abnormal'returns after quarterly earnings announcements.” Journal Of Financial Economics, 6(2-3), pp.127-150. 49. Wouters, T. I. M. (2006). Style investing: behavioral explanations of stock market anomalies: University Library Groningen][Host]. 50. Yakob, N. A., Beal, D., & Delpachitra, S. (2005).”Seasonality in the Asia Pacific stock markets”. Journal of Asset Management, 6(4), pp.298-318.
12
Research Journal of Finance and Accounting ISSN 2222-1697 (Paper) ISSN 2222-2847 (Online) Vol 2, No 9/10, 2011
www.iiste.org
51.Yalçın, K. C. Market Rationality:“Efficient Market Hypothesis versus Market Anomalies.” European Journal Of Economic And Political Studies, 23. 52. Ali, S., & Akbar, M. (2009). “Calendar Effects in Pakistani Stock Market”. International Review of Business Research Papers, 5(1), pp. 389-404. 53. Ziemba, W. T. (1991). “Japanese security market regularities* 1: Monthly, turn-of-the-month and year, holiday and golden week effects”, Japan and the World Economy, 3(2), pp. 119-146.
13
This academic article was published by The International Institute for Science, Technology and Education (IISTE). The IISTE is a pioneer in the Open Access Publishing service based in the U.S. and Europe. The aim of the institute is Accelerating Global Knowledge Sharing. More information about the publisher can be found in the IISTE’s homepage: http://www.iiste.org The IISTE is currently hosting more than 30 peer-reviewed academic journals and collaborating with academic institutions around the world. Prospective authors of IISTE journals can find the submission instruction on the following page: http://www.iiste.org/Journals/ The IISTE editorial team promises to the review and publish all the qualified submissions in a fast manner. All the journals articles are available online to the readers all over the world without financial, legal, or technical barriers other than those inseparable from gaining access to the internet itself. Printed version of the journals is also available upon request of readers and authors. IISTE Knowledge Sharing Partners EBSCO, Index Copernicus, Ulrich's Periodicals Directory, JournalTOCS, PKP Open Archives Harvester, Bielefeld Academic Search Engine, Elektronische Zeitschriftenbibliothek EZB, Open J-Gate, OCLC WorldCat, Universe Digtial Library , NewJour, Google Scholar