Using the idea of an absorbing state, we can define an absorbing Markov chain. .... C. R. W. Markov Chains 13. FOR REVIE
Markov Chains
1
MARKOV CHAINS
T HINK
ABOUT IT
If we know the probability that the child of a lower-class parent becomes middle-class or upperclass, and we know similar information for the child of a middle-class or upper-class parent, what is the probability that the grandchild or great-grandchild of a lower-class parent is middle- or upper-class? Using Markov chains, we will learn the answers to such questions. A stochastic process is a mathematical model that evolves over time in a probabilistic manner. In this section we study a special kind of stochastic process, called a Markov chain, where the outcome of an experiment depends only on the outcome of the previous experiment. In other words, the next state of the system depends only on the present state, not on preceding states. Applications of Markov chains in medicine are quite common and have become a standard tool of medical decision making. Markov chains are named after the Russian mathematician A. A. Markov (1856–1922), who started the theory of stochastic processes.
Transition Matrix In sociology, it is convenient to classify people by income as lower-class, middle-class, and upper-class. Sociologists have found that the strongest determinant of the income class of an individual is the income class of the individual’s parents. For example, if an individual in the lower-income class is said to be in state 1, an individual in the middle-income class is in state 2, and an individual in the upper-income class is in state 3, then the following probabilities of change in income class from one generation to the next might apply.* Table 1 shows that if an individual is in state 1 (lower-income class) then there is a probability of 0.65 that any offspring will be in the lower-income class, a probability of 0.28 that offspring will be in the middle-income class, and a probability of 0.07 that offspring will be in the upper-income class.
Table 1
Current Generation
State 1 2 3
Next Generation 1 2 3 0.65 0.28 0.07 0.15 0.67 0.18 0.12 0.36 0.52
The symbol pij will be used for the probability of transition from state i to state j in one generation. For example, p23 represents the probability that a person in state 2 will have offspring in state 3; from the table above, p23 � 0.18. *For an example with actual data, see Glass, D. V., and J. R. Hall, “Social Mobility in Great Britain: A Study of Intergenerational Changes in Status,” in Social Mobility in Great Britain, D. V. Glass, ed., Routledge & Kegan Paul, 1954. This data is analyzed using Markov chains in Finite Markov Chains by John G. Kemeny and J. Laurie Snell, Springer-Verlag, 1976.
An Addison-Wesley product. Copyright © 2003 Pearson Education, Inc.
2
Markov Chains
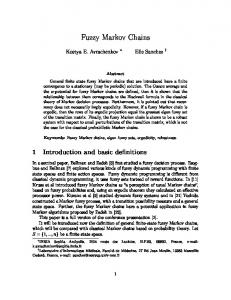
Also from the table, p31 � 0.12, p22 � 0.67, and so on. The information from Table 1 can be written in other forms. Figure 1 is a transition diagram that shows the three states and the probabilities of going from one state to another.
0.28 2
0.65
0.67
1 0.15 0.18
0.12
0.36
0.07 3
0.52
FIGURE 1
In a transition matrix, the states are indicated at the side and the top. If P represents the transition matrix for the table above, then 1 2 3
�
1
2
0.65 0.28 0.15 0.67 0.12 0.36
3
�
0.07 0.18 � P. 0.52
A transition matrix has several features: 1. It is square, since all possible states must be used both as rows and as columns. 2. All entries are between 0 and 1, inclusive; this is because all entries represent probabilities. 3. The sum of the entries in any row must be 1, since the numbers in the row give the probability of changing from the state at the left to one of the states indicated across the top.
Markov Chains A transition matrix, such as matrix P above, also shows two key features of a Markov chain. MARKOV CHAIN
A sequence of trials of an experiment is a Markov chain if 1. the outcome of each experiment is one of a set of discrete states; 2. the outcome of an experiment depends only on the present state, and not on any past states. For example, in transition matrix P, a person is assumed to be in one of three discrete states (lower, middle, or upper income), with each offspring in one of these same three discrete states. An Addison-Wesley product. Copyright © 2003 Pearson Education, Inc.
Markov Chains
3
The transition matrix P shows the probability of change in income class from one generation to the next. Now let us investigate the probabilities for changes in income class over two generations. For example, if a parent is in state 3 (the upper-income class), what is the probability that a grandchild will be in state 2? To find out, start with a tree diagram, as shown in Figure 2. The various probabilities come from transition matrix P. The arrows point to the outcomes “grandchild in state 2”; the grandchild can get to state 2 after having had parents in either state 1, state 2, or state 3. The probability that a parent in state 3 will have a grandchild in state 2 is given by the sum of the probabilities indicated with arrows, or FOR REVIEW Multiplication of matrices was covered in Chapter 10 of Calculus with Applications for the Life Sciences. To get the entry in row i, column j of a product, multiply row i of the first matrix times column j of the second matrix and add up the products. For example, to get the element in row 1, column 1 of P 2, where
�
0.65 P � 0.15 0.12
0.28 0.67 0.36
�
0.0336 � 0.2412 � 0.1872 � 0.4620. Current generation (parent)
Third generation (grandchild) 0.65 0.28
1 0.07
0.12
0.15 0.36
3
0.07 0.18 , 0.52
we calculate �0.65� �0.65� � �0.28� �0.15� � �0.07� �0.12� � 0.4729 � 0.47. To get row 3, column 2, the computation is �0.12� �0.28� � �0.36� �0.67� � �0.52� �0.36� � 0.462 � 0.46. You should review matrix multiplication by working out the rest of P 2 and verifying that it agrees with the result given in Example 1.
Next generation (child)
0.67
2 0.18
0.52
0.12 0.36
3 0.52
Probability of each outcome
1
(0.12)(0.65) � 0.078
2
(0.12)(0.28) � 0.0336
3 1
(0.12)(0.07) � 0.0084 (0.36)(0.15) � 0.054
2
(0.36)(0.67) � 0.2412
3 1
(0.36)(0.18) � 0.0648
2
(0.52)(0.36) � 0.1872
3
(0.52)(0.52) � 0.2704
(0.52)(0.12) � 0.0624
FIGURE 2
We used pij to represent the probability of changing from state i to state j in one generation. This notation can be used to write the probability that a parent in state 3 will have a grandchild in state 2: p31 � p12 � p32 � p22 � p33 � p32. This sum of products of probabilities should remind you of matrix multiplication—it is nothing more than one step in the process of multiplying matrix P by itself. In particular, it is row 3 of P times column 2 of P. If P 2 represents the matrix product P � P, then P 2 gives the probabilities of a transition from one state to another in two repetitions of an experiment. Generalizing, P k gives the probabilities of a transition from one state to another in k repetitions of an experiment.
EXAMPLE
1 Transition Matrices
�
��
For transition matrix P (income-class changes), 0.65 P 2 � 0.15 0.12
0.28 0.67 0.36
0.07 0.18 0.52
0.65 0.15 0.12
0.28 0.67 0.36
��
0.07 0.47 0.18 � 0.22 0.52 0.19
0.39 0.56 0.46
�
0.13 0.22 . 0.34
(The numbers in the product have been rounded to the same number of decimal places as in matrix P.) The entry in row 3, column 2 of P 2 gives the probability that a person in state 3 will have a grandchild in state 2; that is, that an An Addison-Wesley product. Copyright © 2003 Pearson Education, Inc.
4
Markov Chains
upper-class person will have a middle-class grandchild. This number, 0.46, is the result (rounded to two decimal places) found through using the tree diagram. Row 1, column 3 of P 2 gives the number 0.13, the probability that a person in state 1 will have a grandchild in state 3; that is, that a lower-class person will have an upper-class grandchild. How would the entry 0.47 be interpreted? EXAMPLE
2 Powers of Transition Matrices In the same way that matrix P 2 gives the probability of income-class changes after two generations, the matrix P 3 � P � P 2 gives the probabilities of change after three generations. For matrix P,
�
0.65 P � P � P � 0.15 0.12 3
2
0.28 0.67 0.36
��
0.07 0.18 0.52
0.47 0.22 0.19
0.39 0.56 0.46
��
0.13 0.38 0.22 � 0.25 0.34 0.23
0.44 0.52 0.49
�
0.17 0.23 . 0.27
(The rows of P 3 don’t necessarily total 1 exactly because of rounding errors.) Matrix P 3 gives a probability of 0.25 that a person in state 2 will have a greatgrandchild in state 1. The probability is 0.52 that a person in state 2 will have a great-grandchild in state 2. A graphing calculator with matrix capability is useful for finding powers of a matrix. If you enter matrix A, then multiply by A, then multiply the product by A again, you get each new power in turn. You can also raise a matrix to a power just as you do with a number.
Distribution of States Suppose the following table gives the initial distribution of people in the three income classes.
Table 2 Class Lower Middle Upper
State 1 2 3
Proportion 21% 68% 11%
To see how these proportions would change after one generation, use the tree diagram in Figure 3 on the next page. For example, to find the proportion of people in state 2 after one generation, add the numbers indicated with arrows. 0.0588 � 0.4556 � 0.0396 � 0.5540 In a similar way, the proportion of people in state 1 after one generation is 0.1365 � 0.1020 � 0.0132 � 0.2517, and the proportion of people in state 3 after one generation is 0.0147 � 0.1224 � 0.0572 � 0.1943. The initial distribution of states, 21%, 68%, and 11%, becomes, after one generation, 25.17% in state 1, 55.4% in state 2, and 19.43% in state 3. These
An Addison-Wesley product. Copyright © 2003 Pearson Education, Inc.
Markov Chains
State
State 0.65 0.28
1 0.07
0.21
0.15 0.68
0.67
2 0.18
0.11
0.12 0.36
3 0.52
5
Probability
1
(0.21)(0.65) = 0.1365
2
(0.21)(0.28) = 0.0588
3 1
(0.21)(0.07) = 0.0147 (0.68)(0.15) = 0.1020
2
(0.68)(0.67) = 0.4556
3 1
(0.68)(0.18) = 0.1224
2
(0.11)(0.36) = 0.0396
3
(0.11)(0.52) = 0.0572
(0.11)(0.12) = 0.0132
FIGURE 3
distributions can be written as probability vectors (where the percents have been changed to decimals rounded to the nearest hundredth) �0.21
0.68
0.11�
and
�0.25
0.55
0.19�,
respectively. A probability vector is a matrix of only one row, having nonnegative entries, with the sum of the entries equal to 1. The work with the tree diagram to find the distribution of states after one generation is exactly the work required to multiply the initial probability vector, �0.21 0.68 0.11�, and the transition matrix P: X 0 � P � �0.21
0.68
�
0.65 0.11� 0.15 0.12
0.28 0.67 0.36
�
0.07 0.18 � �0.25 0.52
0.55
0.19�.
In a similar way, the distribution of income classes after two generations can be found by multiplying the initial probability vector and the square of P, the matrix P 2. Using P 2 from above, X 0 � P � �0.21 2
0.68
�
0.47 0.11� 0.22 0.19
0.39 0.56 0.46
�
0.13 0.22 � �0.27 0.34
0.51
0.21�.
Next, we will develop a long-range prediction for the proportion of the population in each income class. Our work thus far is summarized below. Suppose a Markov chain has initial probability vector X 0 � �i1 i2 i3 � � � in� and transition matrix P. The probability vector after n repetitions of the experiment is X0 � P n.
An Addison-Wesley product. Copyright © 2003 Pearson Education, Inc.
6
Markov Chains
Using this information, we can compute the distribution of income classes for three or more generations as illustrated in Table 3. The initial probability vector, which gives the distribution of people in each social class, is �0.21 0.68 0.11�.
Table 3 After Generation n 0 1 2 3 4 5 6 7
Lower-Class 0.210 0.252 0.270 0.278 0.282 0.285 0.286 0.286
Middle-Class 0.680 0.554 0.512 0.497 0.490 0.489 0.489 0.489
Upper-Class 0.110 0.194 0.218 0.225 0.226 0.225 0.225 0.225
The results seem to approach the numbers in the probability vector �0.286 0.489 0.225�. What happens if the initial probability vector is different from �0.21 0.68 0.11�? Suppose �0.75 0.15 0.1� is used; the same powers of the transition matrix as above give us the results in Table 4.
Table 4 After Generation n 0 1 2 3 4 5 6 7 8 9
Lower-Class 0.75 0.522 0.407 0.349 0.318 0.303 0.295 0.291 0.289 0.286
Middle-Class 0.15 0.347 0.426 0.459 0.475 0.482 0.485 0.487 0.488 0.489
Upper-Class 0.1 0.132 0.167 0.192 0.207 0.215 0.220 0.222 0.225 0.225
Although it takes a little longer, the results again seem to be approaching the numbers in the probability vector �0.286 0.489 0.225�, the same numbers approached with the initial probability vector �0.21 0.68 0.11�. In either case, the long-range trend is for about 50% of the people to be classifed as middle class. This example suggests that this long-range trend does not depend on the initial distribution of social class.
Regular Transition Matrices
One of the many applications of Markov chains is in finding long-range predictions. It is not possible to make long-range predictions with all transition matrices, but for a large set of transition matrices, long-range predictions are possible. Such predictions are always possible with regular transition matrices. A transition matrix is regular if some power of the
An Addison-Wesley product. Copyright © 2003 Pearson Education, Inc.
Markov Chains
7
matrix contains all positive entries. A Markov chain is a regular Markov chain if its transition matrix is regular. EXAMPLE
3 Regular Transition Matrices
�
�
Decide whether the following transition matrices are regular. 0.75 (a) A � 0 0.6
0.25 0.5 0.4
0 0.5 0
Solution Square A.
�
0.5625 A � 0.3 0.45 2
�
0.3125 0.45 0.35
�
0.125 0.25 0.2
�
Since all entries in A2 are positive, matrix A is regular. 0.5 0 (b) B � 0
�
0 1 0
0.5 0 1
� �
Solution Find various powers of B.
0.25 B � 0 0 2
0 1 0
0.75 0.125 3 0 ;B � 0 1 0
0 1 0
� �
0.875 0.0625 4 0 ;B � 0 1 0
0 1 0
�
0.9375 0 1
Further powers of B will still give the same zero entries, so no power of matrix B contains all positive entries. For this reason, B is not regular.
NOTE If a transition matrix P has some zero entries, and P 2 does as well, you may wonder how far you must compute P k to be certain that the matrix is not regular. The answer is that if zeros occur in the identical places in both P k and P k�1 for any k, they will appear in those places for all higher powers of P, so P is not regular. Suppose that v is any probability vector. It can be shown that for a regular Markov chain with a transition matrix P, there exists a single vector V that does not depend on v, such that v � P n gets closer and closer to V as n gets larger and larger. EQUILIBRIUM VECTOR OF A MARKOV CHAIN
If a Markov chain with transition matrix P is regular, then there is a unique vector V such that, for any probability vector v and for large values of n, v � P n � V. Vector V is called the equilibrium vector or the fixed vector of the Markov chain. In the example of income class, the equilibrium vector V is approximately �0.286 0.489 0.225�. Vector V can be determined by finding P n for larger and
An Addison-Wesley product. Copyright © 2003 Pearson Education, Inc.
8
Markov Chains
larger values of n, and then looking for a vector that the product v � P n approaches. Such an approach can be very tedious, however, and is prone to error. To find a better way, start with the fact that for a large value of n, v � P n � V, as mentioned above. From this result, v � P n � P � V � P, so that v � P n � P � v � P n�1 � VP. Since v � P n � V for large values of n, it is also true that v � P n�1 � V for large values of n (the product v � P n approaches V, so that v � P n�1 must also approach V). Thus, v � P n�1 � V and v � P n�1 � VP, which suggests that VP � V. If a Markov chain with transition matrix P is regular, then there exists a probability vector V such that VP � V. This vector V gives the long-range trend of the Markov chain. Vector V is found by solving a system of linear equations, as shown in the next example. EXAMPLE
4 Income Class Find the long-range trend for the Markov chain in the income class example with transition matrix
�
0.65 0.15 0.12
0.28 0.67 0.36
�
0.07 0.18 0.52
Solution This matrix is regular since all entries are positive. Let P represent this transition matrix, and let V be the probability vector �v1 v2 v3�. We want to find V such that
�v1
or
v2
VP � V, v3�P � �v1
v2
v3�.
Use matrix multiplication on the left. �0.65v1 � 0.15v2 � 0.12v3
0.28v1 � 0.67v2 � 0.36v3
0.07v1 � 0.18v2 � 0.52v3� � �v1
Set corresponding entries from the two matrices equal to get 0.65v1 � 0.15v2 � 0.12v3 � v1, 0.28v1 � 0.67v2 � 0.36v3 � v2, 0.07v1 � 0.18v2 � 0.52v3 � v3. and Simplify these equations. �0.35v1 � 0.15v2 � 0.12v3 � 0 0.28v1 � 0.33v2 � 0.36v3 � 0 0.07v1 � 0.18v2 � 0.48v3 � 0
An Addison-Wesley product. Copyright © 2003 Pearson Education, Inc.
v2
v3�
Markov Chains
9
It is easy to see that the last equation is simply the sum of the first two equations multiplied by �1, so we will drop this equation. (The equations in the system obtained from VP � V are always dependent.) To find the values of v1, v2, and v3, recall that V � �v1 v2 v3� is a probability vector, so that v1 � v2 � v3 � 1. To find v1, v2, and v3, solve the system �0.35v1 � 0.15v2 � 0.12v3 � 0 0.28v1 � 0.33v2 � 0.36v3 � 0 v1 � v2 � v3 � 1. Using the Gauss-Jordan method, we obtain the reduced system of equations
104 363 532 0 1 0 . 1,089 245 0 0 1 1,089 Thus, v1 � 104 363, v2 � 532 1,089, and v3 � 245 1,089 and the V � �104 363 532 1,089 245 1,089� � equilibrium vector is �0.2865 0.4885 0.2250�. 1
0
0
Some powers of the transition matrix P in Example 1 (the income class example) with entries rounded to two decimal places are shown here.
�
0.34 P 4 � 0.27 0.26
�
�
0.47 0.20 0.50 0.23 , 0.29 0.25
�
0.29 P � 0.29 0.29 16
0.29 P 10 � 0.29 0.29 0.49 0.49 0.49
�
0.49 0.49 0.49
�
0.22 0.23 , 0.23
0.22 0.22 0.22
As these results suggest, higher and higher powers of the transition matrix P approach a matrix having all rows identical; these identical rows have as entries the entries of the equilibrium vector V. This agrees with the statement above: the initial state does not matter. Regardless of the initial probability vector, the system will approach a fixed vector V. This unexpected and remarkable fact is the basic property of regular Markov chains: the limiting distribution is independent of the initial distribution. This happens because some power of the transition matrix has all positive entries, so that all the initial probabilities are thoroughly mixed. We can now summarize these results. PROPERTIES OF REGULAR MARKOV CHAINS
Suppose a regular Markov chain has a transition matrix P. 1. As n gets larger and larger, the product v � P n approaches a unique vector V for any initial probability vector v. Vector V is called the equilibrium vector or fixed vector.
An Addison-Wesley product. Copyright © 2003 Pearson Education, Inc.
10
Markov Chains
2. Vector V has the property that VP � V. 3. To find V, solve a system of equations obtained from the matrix equation VP � V, and from the fact that the sum of the entries of V is 1. 4. The powers P n come closer and closer to a matrix whose rows are made up of the entries of the equilibrium vector V.
Absorbing Markov Chains Not all Markov chains are regular. In fact, some of the most important life science applications of Markov chains do not involve transition matrices that are regular. One type of Markov chain that is widely used in the life sciences is called an absorbing Markov chain. When we use the ideas of Markov chains to model living organisms, a common state is death. Once the organism enters that state, it is not possible to leave. In this situation, the organism has entered an absorbing state. For example, suppose a Markov chain has transition matrix
1 2
1
0.2
0.6
2 3
1 0.3
3
0.6
0.2
0.1
FIGURE 4
�
1
2
0.3 0 0.6
0.6 1 0.2
3
�
0.1 0 � P. 0.2
The matrix shows that p12, the probability of going from state 1 to state 2, is 0.6, and that p22, the probability of staying in state 2, is 1. Thus, once state 2 is entered, it is impossible to leave. For this reason, state 2 is called an absorbing state. Figure 4 shows a transition diagram for this matrix. The diagram shows that it is not possible to leave state 2. Generalizing from this example leads to the following definition. ABSORBING STATE
State i of a Markov chain is an absorbing state if pii � 1. Using the idea of an absorbing state, we can define an absorbing Markov chain. ABSORBING MARKOV CHAIN
A Markov chain is an absorbing chain if and only if the following two conditions are satisfied: 1. the chain has at least one absorbing state; and 2. it is possible to go from any nonabsorbing state to an absorbing state (perhaps in more than one step). Note that the second condition does not mean that it is possible to go from any nonabsorbing state to any absorbing state, but it is possible to go to some absorbing state. EXAMPLE
5 Absorbing Markov Chains Identify all absorbing states in the Markov chains having the following matrices. Decide whether the Markov chain is absorbing.
An Addison-Wesley product. Copyright © 2003 Pearson Education, Inc.
Markov Chains
1
0.5
(a)
2 3
2 0.3
0.2
1
3
1
FIGURE 5
1
1 1
(b)
2 0.4
2 3 4
0.9 4
3 0.1
1
FIGURE 6
EXAMPLE
2
3
1 0.3 0
0 0.5 0
0 0.2 1
�
1
Solution Since p11 � 1 and p33 � 1, both state 1 and state 3 are absorbing states. (Once these states are reached, they cannot be left.) The only nonabsorbing state is state 2. There is a 0.3 probability of going from state 2 to the absorbing state 1, and a 0.2 probability of going from state 2 to state 3, so that it is possible to go from the nonabsorbing state to an absorbing state. This Markov chain is absorbing. The transition diagram is shown in Figure 5.
1
0.6
�
11
�
2
3
4
0.6 0 0.9 0
0 1 0 0
0.4 0 0.1 0
0 0 0 1
�
1
Solution States 2 and 4 are absorbing, with states 1 and 3 nonabsorbing. From state 1, it is possible to go only to states 1 or 3; from state 3 it is possible to go only to states 1 or 3. As the transition diagram in Figure 6 shows, neither nonabsorbing state leads to an absorbing state, so that this Markov chain is nonabsorbing.
6 Management of Gallstones Physicians who diagnose asymptomatic gallstones are faced with the decision to either immediately remove the gall bladder to prevent possible life-threatening complications or to postpone surgery until complications do occur. What is the long-term trend of each strategy? Solution In the absence of a clinical study, Markov chain analysis is often the only effective way to evaluate the benefits and risks of various medical treatment strategies. Markov chains can be used to model the scenario above.* Suppose that in very simplified “postpone surgery” strategy, a patient will continue to have asymptomatic gallstones (state A) from one 4-month period to the next with probability 0.95. One of two major complications (state C), cholecystitis or biliary complications, may result, requiring surgery, with probability of 0.04. Because of the patient’s specific age, she will have the probability of natural death of 0.01 (state D). If the disease progresses and becomes symptomatic, then surgery is performed with a risk of death from complications due to surgery of 0.005. Once successful surgery is performed, the patient enters state recovery (state R). Ninety percent of the patients move onto the well state (W) while 9% stay in the recovery state each year and 1% die of natural causes. Once a patient enters the well state, she continues there until death, with probability 0.99. The following 5 � 5 matrix is the transition matrix for the strategy to postpone surgery until complications occur.
*Sox, H., M. Blatt, M. Higgins, and K. Marton, Medical Decision Making, Butterworth Publishing, Boston, 1988, pp. 191–193.
An Addison-Wesley product. Copyright © 2003 Pearson Education, Inc.
Markov Chains
A
C
0.95 0 P� 0 0 0
R
0.04 0 0 0 0
W
0 0 0.995 0 0.09 0.90 0 0.99 0 0
D
0.01 0.005 0.01 0.01 1
A C R W D
Notice that state D is an absorbing state. Once the patient enters that state, it is impossible to leave. For the long-term trend of this strategy, find various powers of the transition matrix. A computer or a graphing calculator can be used to verify the following results, rounded to two decimal places.
12
0.66 0 8 P � 0 0 0 0.19 0 P 32 � 0 0 0
0.03 0 0 0 0 0.01 0 0 0 0
0.03 0 0 0 0 0.01 0 0 0 0
0.20 0.93 0.92 0.92 0 0.51 0.73 0.72 0.72 0
0.08 0.07 0.08 0.08 1 0.27 0.27 0.28 0.28 1
As these results suggest, when P is raised to higher and higher powers, the system will tend toward the absorbing state, so that the probability is 1 that the patient will eventually die. This example suggests the following properties of absorbing Markov chains, which can be verified using more advanced methods. 1. Regardless of the original state of an absorbing Markov chain, in a finite number of steps the chain will enter an absorbing state and then stay in that state. 2. The powers of the transition matrix get closer and closer to some particular matrix. In addition, absorbing Markov chains have a third property not illustrated in Example 6. 3. The long-term trend depends on the initial state —changing the initial state can change the final result. The third property distinguishes absorbing Markov chains from regular Markov chains, where the final result is independent of the initial state. This property is not illustrated in Example 6 since there is only one absorbing state. In situations where there is more than one absorbing state, as in Exercise 58, property 3 is apparent. It would be preferable to have a method for finding the final probabilities of entering an absorbing state without finding all the powers of the transition matrix,
An Addison-Wesley product. Copyright © 2003 Pearson Education, Inc.
Markov Chains
13
as in Example 6. We do not really need to worry about the absorbing states (to enter an absorbing state is to stay there). Therefore, it is necessary only to work with the nonabsorbing states. To see how this is done, let us use as an example the transition matrix from the gallstone problem in Example 6. Rewrite the matrix so that the rows and columns corresponding to the absorbing state(s) come first. D
A C R W
A
C
D
1 0 0.01 0.95 0.005 0 0.01 0 0.01 0
R
0 0 0.04 0 0 0.995 0 0.09 0 0
W
0 0 0 � P 0.90 0.99
Let I1 represent the 1 � 1 identity matrix in the upper left corner; let O represent the matrix of zeros in the upper right; let R represent the matrix in the lower left; and let Q represent the matrix in the lower right. Using these symbols, P can be written as P�
� � I1 R
O . Q
The fundamental matrix for an absorbing Markov chain is defined as matrix F, where F � �In � Q��1. Here In is the n � n identity matrix corresponding in size to matrix Q, so that the difference In � Q exists. For the gallstone problem, using I4 gives FOR REVIEW To find the inverse of a matrix, we first form an augmented matrix by putting the original matrix on the left and the identity matrix on the right: �A I�. The Gauss-Jordan process is used to turn the matrix on the left into the identity. The matrix on the right is then the inverse of the original matrix: �I A�1�.
F�
� � � �� � � � � 1 0 0 0
0 1 0 0
0 0 1 0
0 0.95 0 0 � 0 0 1 0
0.05 0 � 0 0
�0.04 1 0 0
20.00 0 � 0 0
0.80 1 0 0
0 �0.995 0.91 0
0.87 1.09 1.10 0
0.04 0 0 0
0 0 �0.90 0.01
0 0.995 0.09 0
0 0 0.90 0.99
�1
�1
78.72 98.41 . 98.90 100
The inverse was found using techniques from Chapter 10 of Calculus with Applications for the Life Sciences. In Chapter 10, we also discussed finding the inverse of a matrix with a graphing calculator.
An Addison-Wesley product. Copyright © 2003 Pearson Education, Inc.
14
Markov Chains
The fundamental matrix gives the expected number of visits to each state before absorption occurs. For example, if the patient is currently asymptomatic, the first row of the fundamental matrix just computed says that she expects to have 20 four-month time periods (about 6.67 years) on average in this state and 20.00 � 0.80 � 0.87 � 78.72 � 100.39 four-month time periods in the various living states before death. That is, her life expectancy is 100.39 3 � 33.46 years. To see why this is true, consider a Markov chain currently in state i. The expected number of times that the chain visits state j at this step is 1 for i and 0 for all other states. The expected number of times that the chain visits state j at the next step is given by the element in row i, column j of the transition matrix Q. The expected number of times the chain visits state j two steps from now is given by the corresponding entry in the matrix Q 2. The expected number of visits in all steps is given by I � Q � Q 2 � Q 3 � � � � . To find out whether this infinite sum is the same as �I � Q��1, multiply the sum by �I � Q�: �I � Q � Q 2 � Q 3 � � � �� �I � Q� � I � Q � Q 2 � Q 3 � � � � � Q � Q 2 � Q 3 � � � � � I, which verifies our result. It can be shown that Pk �
�
Im �I � Q � Q 2 � � � � � Q k�1�R
�
O , Qk
where Im is the m � m identity matrix. As k l �, Q k l On , the n � n zero matrix, and Pk l
� � Im FR
O , On
so we see that FR gives the probabilities that if the system was originally in a nonabsorbing state, it ends up in one of the absorbing states.* Finally, use the fundamental matrix F along with matrix R found above to get the product FR.
�
20.00 0 FR � 0 0
0.80 1 0 0
0.87 1.09 1.10 0
�� � � �
78.73 98.41 98.90 100
0.01 1 0.005 1 � 0.01 1 0.01 1
The product matrix FR gives the probability that if the system was originally in a particular nonabsorbing state, it ended up in the absorbing state. For example, the probability is 1 that if the patient was originally asymptomatic she ended up dying, which, unfortunately, is what we expect. In situations where there is more than one absorbing state, the product FR will show the probability that a nonabsorbing state will end up in a particular absorbing state. Let us summarize what we have learned about absorbing Markov chains.
*We have omitted details in these steps that can be justified using advanced techniques.
An Addison-Wesley product. Copyright © 2003 Pearson Education, Inc.
Markov Chains
15
PROPERTIES OF ABSORBING MARKOV CHAINS
1. Regardless of the initial state, in a finite number of steps the chain will enter an absorbing state and then stay in that state. 2. The powers of the transition matrix get closer and closer to some particular matrix. 3. The long-term trend depends on the initial state. 4. Let P be the transition matrix for an absorbing Markov chain. Rearrange the rows and columns of P so that the absorbing states come first. Matrix P will have the form P�
� � Im R
O , Q
where Im is an identity matrix, with m equal to the number of absorbing states, and O is a matrix of all zeros. The fundamental matrix is defined as F � �In � Q��1, where In has the same size as Q. The element in row i, column j of the fundamental matrix gives the number of visits to state j that are expected to occur before absorption, given that the current state is state i. 5. The product FR gives the matrix of probabilities that a particular initial nonabsorbing state will lead to a particular absorbing state.
EXAMPLE
7 Long-term Trend Find the long-term trend for the transition matrix
�
1 2 3
1
2
0.3 0 0
0.2 1 0
3
�
0.5 0 � P. 1
Solution Rewrite the matrix so that absorbing states 2 and 3 come first.
� � 2
2 3 1
Here R � �0.2
1 0 0.2
3
0 1 0.5
1
0 0 0.3
0.5� and Q � �0.3�. Find the fundamental matrix F.
F � �I1 � Q��1 � �1 � 0.3� �1 � �0.7� �1 � �1 0.7� � �10 7� The product FR is FR � �10 7� �0.2
0.5� � �2 7
5 7� � �0.286
0.714�.
If the system starts in the nonabsorbing state 1, there is a 2 7 chance of ending up in the absorbing state 2 and a 5 7 chance of ending up in the absorbing state 3.
An Addison-Wesley product. Copyright © 2003 Pearson Education, Inc.
16
Markov Chains
KEY TERMS regular Markov chain equilibrium (or fixed) vector absorbing state
Markov chain probability vector regular transition matrix
state transition diagram transition matrix
absorbing chain fundamental matrix
EXERCISES Decide whether each of the matrices in Exercises 1 – 4 could be a probability vector.. 11. �0.4
0.2
0�
12.
� 14
1 8
5 8
�
13. �0.07
0.04
0.37
14. �0.3
0.52�
Decide whether each of the matrices in Exercises 5 – 8 could be a transition matrix, by definition. Sketch a transition diagram for any transition matrices. 15.
�
�
0.5 0
0 0.5
6.
� � 2 3
1 3
1
0
7.
� � 1 4 1 2
3 4 1 2
8.
�0.1
0.8�
� � 1 4
3 4
2 1
0 2 3
0 1 3
In Exercises 9– 11, write any transition diagrams as transition matrices. 9.
10. 0.9
1/2 1/3
1/3
A
0.1 A
B
11.
0.6
0.6
B
0.1
C 1/3 1
0.3
1/2
0.08
0.4
0.3
0.2 C
C
0.9 B
A 0.6
Find the first three powers of each of the transition matrices in Exercises 12–15 (for example, A, A2, and A3 in Exercise 12). For each transition matrix, find the probability that state 1 changes to state 2 after three repetitions of the experiment. 12. A �
�
1 0.8
0 0.2
�
13. C �
�
0.5 0.72
�
0.5 0.28
14. D �
�
0.3 0 0.6
0.2 0 0.1
0.5 1 0.3
�
For each of the following transition matrices, find the first five powers of the matrix. Then find the probability that state 2 changes to state 4 after 5 repetitions of the experiment. 0.1 0.2 16. 0.2 0.3 0.1
0.2 0.1 0.1 0.1 0.3
0.2 0.1 0.4 0.1 0.1
0.3 0.2 0.2 0.2 0.1
0.2 0.4 0.1 0.3 0.4
0.02
0.2
0.7
0.3 0.4 17. 0.1 0.2 0.1
0.2 0.2 0.3 0.1 0.1
0.3 0.1 0.2 0.3 0.4
0.1 0.2 0.2 0.2 0.2
18. a. Verify that X 0 � P n can be computed in two ways: (1) by first multiplying P by itself n times, then multiplying X 0 times this result; and (2) by multiplying X 0 � P, multiplying this result by P, and continuing to multiply by P a total of n times. (Hint: Use the fact that matrix multiplication is associative.)
An Addison-Wesley product. Copyright © 2003 Pearson Education, Inc.
0.1 0.1 0.2 0.2 0.2
�
0.8 15. E � 0.3 0
0.1 0.6 1
�
0.1 0.1 0
Markov Chains
b. Which of the two methods in part a is simpler? Explain your answer. Which of the transition matrices in Exercises 19 –22 are regular?
19.
�
�
0.2 0.9
0.8 0.1
20.
�
�
1 0.6
0 0.4
21.
� �
0 0.4 1
1 0.2 0
0 0.4 0
0.1 0.4 0.1
0.1 0.4 0.2
0.8 0.2 0.7
Find the equilibrium vector for each transition matrix in Exercises 23 – 26. 23.
� � 1 4 1 2
3 4 1 2
24.
�
�
0.3 0.4
0.7 0.6
25.
� �
22.
26.
� �
0.5 0 0.1
0.2 0 0.4
0.5 0.1 0.2
0.2 0.4 0.2
0.3 0.5 0.6
27. Find the equilibrium vector for the transition matrix
�
�
1�p , q
p 1�q
where 0 � p � 1 and 0 � q � 1. Under what conditions is this matrix regular?
� �
28. Show that the transition matrix
1 4
K� 0 0
3 4
0 1 0
0 1
has more than one vector V such that VK � V. Why does this not violate the statements of this section? 29. Let P�
�
a11 a21
�
a12 a22
be a regular matrix having column sums of 1. Show that the equilibrium vector for P is �1 2 1 2�. 30. Notice in Example 4 that the system of equations VP � V, with the extra equation that the sum of the elements of V must equal 1, had exactly one solution. What can you say about the number of solutions to the system VP � V? Find all absorbing states for the transition matrices in Exercises 31 –34. Which are transition matrices for absorbing Markov chains?
31.
33.
�
�
0.15 0 0.4
0.05 1 0.6
0.8 0 0
0.32 0.42 0 1
0.41 0.30 0 0
0.16 0 0 0
�
32.
�
0.11 0.28 1 0
34.
�
0.4 0 0.9
0 1 0
0.2 0 0.9 0
0.5 1 0.02 0
�
�
0.6 0 0.1
0.1 0 0.04 0
�
0.2 0 0.04 1
Find the fundamental matrix F for the absorbing Markov chains with the matrices in Exercises 35–40. Also, find the product matrix FR.
35.
�
1 0 0.2
0 1 0.3
�
0 0 0.5
36.
� � 1 0 0 1
0 0
1 3
1 3
1 3
An Addison-Wesley product. Copyright © 2003 Pearson Education, Inc.
� � 1
37.
0
0
0 0 0
1
0 0 0
1 4
1 4
1 4
1 4
1 3
2 3
� �
0.3 1 0.5
17
18
38.
Markov Chains
� � 1 4
1 2
0 0
1 0 0
1 2
0 0 1 0
1 0 39. 0.1 0.3 0
1 4
0 0 1 2
0 1 0.2 0.5 0
0 0 0.3 0.1 0
0 0 0.2 0 0
0 0 0.2 0.1 1
0.4 0 40. 0 0.1 0
0.2 1 0 0.5 0
0.3 0 1 0.1 0
0 0 0 0.1 0
0.1 0 0 0.2 1
41. How can we calculate the expected total number of times a Markov chain will visit state j before absorption, regardless of the current state? 42. Suppose an absorbing Markov chain has only one absorbing state. What is the product FR? 43. How can you tell by looking at a matrix whether it represents the transition matrix from a Markov chain? 44. Under what conditions is the existence of an equilibrium vector guaranteed? 45. How can you tell from the transition matrix whether a Markov chain is absorbing or not? 46. Can a Markov chain be both regular and absorbing? Explain.
Applications LIFE SCIENCES 47. Immune Response A study of immune response in rabbits classified the rabbits into four groups, according to the strength of the response.* From one week to the next, the rabbits changed classification from one group to another, according to the following transition matrix. 1 2 3 4
� � 1
2
3
4
5 7
2 7 1 2
0
0
1 3 1 2 1 4
1 6 1 2 3 4
0 0 0
0 0
a. What proportion of the rabbits in group 1 were still in group 1 five weeks later? b. In the first week, there were 9 rabbits in the first group, 4 in the second, and none in the third or fourth groups. How many rabbits would you expect in each group after 4 weeks? c. By investigating the transition matrix raised to larger and larger powers, make a reasonable guess for the longrange probability that a rabbit in group 1 or 2 will still be in group 1 or 2 after an arbitrarily long time. Explain why this answer is reasonable. 48. Research with Mice A large group of mice is kept in a cage having connected compartments A, B, and C. Mice in compartment A move to B with probability 0.3 and
to C with probability 0.4. Mice in B move to A or C with probabilities of 0.15 and 0.55, respectively. Mice in C move to A or B with probabilities of 0.3 and 0.6, respectively. Find the long-range prediction for the fraction of mice in each of the compartments. 49. Medical Prognosis A study using Markov chains to estimate a patient’s prognosis for improving under various treatment plans gives the following transition matrix as an example:† well ill dead
�
ill
dead
0.3 0 0
0.5 0.5 0
0.2 0.5 1
�
well
a. Estimate the probability that a well person will eventually end up dead. b. Verify your answer to part a using the matrix product FR. c. Find the expected number of cycles that a well patient will continue to be well before dying, and the expected number of cycles that a well patient will be ill before dying. 50. Contagion Under certain conditions, the probability that a person will get a particular contagious disease and die from it is 0.05, and the probability of getting the disease and surviving is 0.15. The probability that a survivor will infect
*McGilchrist, C. A., C. W. Aisbett, and S. Cooper, “A Markov Transition Model in the Analysis of the Immune Response,” Journal of Theoretical Biology, Vol. 138, 1989, pp. 17– 21. †Beck, J. Robert, and Stephen G. Paukeer, “The Markov Process in Medical Prognosis,” Medical Decision Making, Vol. 4, No. 3, 1983, pp. 419– 458.
An Addison-Wesley product. Copyright © 2003 Pearson Education, Inc.
Markov Chains
another person who dies from it is also 0.05, that a survivor will infect another person who survives it is 0.15, and so on. A transition matrix using the following states is given below. A person in state 1 is one who gets the disease and dies, a person in state 2 gets the disease and survives, and a person in state 3 does not get the disease. Consider a chain of people, each of whom interacts with the previous person and may catch the disease from the individual, and then may infect the next person. a. Verify that the transition matrix is as follows:
1
First Person
2 3
�
2
0.05 0.05 0
�
3
0.15 0.15 0
0.8 0.8 1
b. Find F and FR. c. Find the probability that the disease eventually disappears. d. Given a person who has the disease and survives, find the expected number of people in the chain who will get the disease until a person who does not get the disease is reached. 51. Medical Prognosis A study of patients at the University of North Carolina Hospitals used a Markov chain model with three categories of patients: 0 (death), 1 (unfavorable status), and 2 (favorable status).* The transition matrix for a cycle of 72 hr was as follows. 0 1 2
�
1
2
1 0.085 0.017
0 0.779 0.017
0 0.136 0.966
�
0
Normal Overweight
Thin
Normal
Overweight
0.3 0.2 0.1
0.5 0.6 0.5
0.2 0.2 0.4
Find the probabilities of the following for a man of normal weight. 52. Thin son 53. Thin grandson 54. Thin great-grandson
Second Person 1
Thin
19
Find the probabilities of the following for an overweight man. 55. Overweight son 56. Overweight grandson 57. Overweight great-grandson Suppose that the distribution of men by weight is initially given by �0.2 0.55 0.25�. Find each of the following distributions. 58. After 1 generation 59. After 2 generations 60. After 3 generations 61. Find the long-range prediction for the distribution of weights. Genetics Researchers sometimes study the problem of mating the offspring from the same two parents; two of these offspring are then mated, and so on. Let A be a dominant gene for some trait, and a the recessive gene. The original offspring can carry genes AA, Aa, or aa. There are six possible ways that these offspring can mate.
a. Find the fundamental matrix. b. For a patient with a favorable status, find the expected number of cycles that the patient will continue to have that status before dying.
State 1 2 3 4 5 6
c. For a patient with an unfavorable status, find the expected number of cycles that the patient will have a favorable status before dying. Medical Research A medical researcher is studying the risk of heart attack in men. She first divides men into three weight categories: thin, normal, and overweight. By studying the male ancestors, sons, and grandsons of these men, the researcher comes up with the following transition matrix.
Mating AA and AA AA and Aa AA and aa Aa and Aa Aa and aa aa and aa
62. Suppose that the offspring are randomly mated with each other. Verify that the transition matrix is given by the matrix below.
*Chen, Pai-Lien, Estrada J. Bernard, and Pranab K. Sen, “A Markov Chain Model Used in Analyzing Disease History Applied to a Stroke Study,” Journal of Applied Statistics, Vol. 26, No. 4, 1999, pp. 413–422.
An Addison-Wesley product. Copyright © 2003 Pearson Education, Inc.
20
Markov Chains
1
2
3
4
5
6
1
1
0
2
1 4
3
0
0 0 1 0 2 0 0
1
0 0 0
0 0 0
4
1 16
1 4
5
0 0
0 0 0 0
1 4 1 4
1 4 1 2
1 16 1 4
0
0
1
6
1 8
1 4
stituency, while 15% switched to conservative and 5% to independent. The conservatives retained 70% and lost 20% to the liberals. The independents retained 60% and lost 20% each to the conservatives and liberals. Assume that these trends continue. a. Write a transition matrix using this information. b. Write a probability vector for the initial distribution.
63. Identify the absorbing states.
Find the percent of each type of voter at the end of each of the following months.
64. Find matrix Q.
c. July
d. August
65. Find F, and the product FR.
e. September
f. October
66. If two parents with the genes Aa are mated, find the number of pairs of offspring with these genes that can be expected before either the dominant or the recessive gene no longer appears. 67. If two parents with the genes Aa are mated, find the probability that the recessive gene will eventually disappear.
70. Cricket The results of cricket matches between England and Australia have been found to be modeled by a Markov chain.* The probability that England wins, loses, or draws is based on the result of the previous game, with the following transition matrix: Wins
OTHER APPLICATIONS
Loses
68. Housing Patterns In a survey investigating changes in housing patterns in one urban area, it was found that 75% of the population lived in single-family dwellings and 25% in multiple housing of some kind. Find years later, in a follow-up survey, of those who had been living in singlefamily dwellings, 90% still did so, but 10% had moved to multiple-family dwellings. Of those in multiple-family housing, 95% were still living in that type of housing, while 5% had moved to single-family dwellings. Assume that these trends continue.
Draws
�
�
Wins
Loses
Draws
0.443 0.277 0.266
0.364 0.436 0.304
0.193 0.287 . 0.430
a. Write a transition matrix for this information. b. Write a probability vector for the initial distribution of housing. What percent of the population can be expected in each category after the following time periods? c. 5 yr
d. 10 yr
e. Write the transition matrix for a 10-yr period. f. Use your result from part e to find the probability that someone living in a single-family dwelling is still doing so 10 yr later. 69. Voting Trends At the end of June in a presidential election year, 40% of the voters were registered as liberal, 45% as conservative, and 15% as independent. Over a one-month period, the liberals retained 80% of their con-
a. Compute the transition matrix for the game after the next one, based on the result of the last game. b. Use your answer from part a to find the probability that, if England won the last game, England will win the game after the next one. c. Use your answer from part a to find the probability that, if Australia won the last game, England will win the game after the next one. 71. Criminology A study of male criminals in Philadelphia found that the probability that one type of offense is fol-
*Colwell, Derek, Brian Jones, and Jack Gillett, “A Markov Chain in Cricket,” The Mathematics Gazette, June 1991.
An Addison-Wesley product. Copyright © 2003 Pearson Education, Inc.
Markov Chains
21
lowed by another type can be described by the following transition matrix.* Nonindex Injury Theft Damage Combination
Nonindex
Injury
Theft
0.645 0.611 0.514 0.609 0.523
0.099 0.138 0.067 0.107 0.093
0.152 0.128 0.271 0.178 0.183
Damage Combination
0.033 0.033 0.030 0.064 0.022
0.071 0.090 0.118 0.042 0.179
a. For a criminal who commits theft, what is the probability that his next crime is also a theft? b. For a criminal who commits theft, what is the probability that his second crime after that is also a theft? c. If these trends continue, what are the long-term probabilities for each type of crime? 72. Education At one liberal arts college, students are classified as humanities majors, science majors, or undecided. There is a 20% chance that a humanities major will change to a science major from one year to the next, and a 45% chance that a humanities major will change to undecided. A science major will change to humanities with probability 0.15, and to undecided with probability 0.35. An undecided will switch to humanities or science with probabilities of 0.5 and 0.3, respectively. a. Find the long-range prediction for the fraction of students in each of these three majors. b. Compare the result of part a with the result in Exercise 29. Make a conjecture, and describe how this conjecture, if true, would allow you to predict the answer to part a with very little computation. 73. Rumors The manager of the slot machines at a major casino makes a decision about whether or not to “loosen up” the slots so that the customers get a larger payback. The manager tells only one other person, a person whose word cannot be trusted. In fact, there is only a probability p, where 0 � p � 1, that this person will tell the truth. Suppose this person tells several other people, each of whom tells several people, what the manager’s decision is. Suppose there is always a probability p that the decision is passed on as heard. Find the long-range prediction for the fraction of the people who will hear the decision correctly. (Hint: Use a transition matrix; let the first row be � p 1 � p� and the second row be �1 � p p�.)
74. Education A study of students taking a 20-question chemistry exam tracked their progress from one testing period to the next.† For simplicity, we have grouped students scoring from 0 to 5 in group 1, from 6 to 10 in group 2, from 11 to 15 in group 3, and from 15 to 20 in group 4. The result is the following transition matrix. 1 2 3 4
�
2
3
4
0.585 0.44 0.276 0.044
0.34 0.42 0.452 0.292
0.01 0.098 0.254 0.664
�
1
0.065 0.042 0.018 0
a. Find the long-range prediction for the proportion of the students in each group. b. The authors of this study were interested in the number of testing periods required before a certain proportion of the students had mastered the material. Suppose that once a student reaches group 4, the student is said to have mastered the material and is no longer tested, so the student stays in that group forever. Initially, all of the students in the study were in group 1. Find the number of testing periods you would expect for at least 70% of the students to have mastered the material. (Hint: Try increasing values of n in x0 � P n.) 75. Weather The weather in a certain spot is classified as fair, cloudy without rain, or rainy. A fair day is followed by a fair day 60% of the time, and by a cloudy day 25% of the time. A cloudy day is followed by a cloudy day 35% of the time, and by a rainy day 25% of the time. A rainy day is followed by a cloudy day 40% of the time, and by another rainy day 25% of the time. What proportion of days are expected to be fair, cloudy, and rainy over the long term?
*Stander, Julian, et al., “Markov Chain Analysis and Specialization in Criminal Careers,” The British Journal of Criminology, Vol. 29, No. 4, Autumn 1989, pp. 319– 335. The rounding was changed slightly so the rows of the transition matrix sum to 1. †Gunzenhauser, Georg W., and Raymond G. Taylor, “Concept Mastery and First Passage Time,” National Forum of Teacher Education Journal, Vol. 1, No. 1, 1991–1992, pp. 29 – 34.
An Addison-Wesley product. Copyright © 2003 Pearson Education, Inc.
22
Markov Chains
76. Ehrenfest Chain The model for the Ehrenfest chain consists of 2 boxes containing a total of n balls, where n is any integer greater than or equal to 2. In each turn, a ball is picked at random and moved from whatever box it is in to the other box. Let the state of the Markov process be the number of balls in the first box. a. Verify that the probability of going from state i to state j is given by the following.
i n i Pij � 1 � n 1 0
if i 1 and j � i � 1 if i � n � 1 and j � i � 1 if i � 0 and j � 1 or i � n and j � n � 1 otherwise.
b. Verify that the transition matrix is given by 0
1
2
3
0
0
1
1 n
2
0
1 0 0 1 0 1�n 0 2 1 � 2n 0 n
� � �
� � �
� � �
� � �
� � �
n
0
0
0
0
� � �
n
��� ��� ���
0 0 0
� � �
� � �
���
0
c. Write the transition matrix for the case n � 2. d. Determine whether the transition matrix in part c is a regular transition matrix. e. Determine an equilibrium vector for the matrix in part c. Explain what the result means. 77. Language One of Markov’s own applications was a 1913 study of how often a vowel is followed by another vowel or a consonant by another consonant in Russian text. A similar study of a passage of English text revealed the following transition matrix. Vowel Consonant
Vowel
Consonant
0.12 0.54
0.88 0.46
a. Verify that the transition matrix is given by 1 2 3
� � 1
2
3
1 2 1 3
1 2 1 3 1 2
0
0
1 3 1 2
.
b. Find the long-range trend for the fraction of time the guard spends in front of each door. 79. Student Retention At a particular two-year college, a student has a probability of 0.25 of flunking out during a given year, a 0.15 probability of having to repeat the year, and a 0.6 probability of finishing the year. Use the states below.
State 1 2 3 4
Meaning Freshman Sophomore Has flunked out Has graduated
a. Write a transition matrix. Find F and FR. b. Find the probability that a freshman will graduate. c. Find the expected number of years that a freshman will be in college before graduating or flunking out. 80. Transportation The city of Sacramento recently completed a new light rail system to bring commuters and shoppers into the downtown area and relieve freeway congestion. City planners estimate that each year, 15% of those who drive or ride in an automobile will change to the light rail system; 80% will continue to use automobiles; and the rest will no longer go to the downtown area. Of those who use light rail, 5% will go back to using an automobile, 80% will continue to use light rail, and the rest will stay out of the downtown area. Assume those who do not go downtown will continue to stay out of the downtown area.
Find the percent of letters in the English text that are expected to be vowels. 78. Random Walk Many phenomena can be viewed as examples of a random walk. Consider the following simple example. A security guard can stand in front of any one of three doors 20 ft apart in front of a building, and every minute he decides whether to move to another door chosen at random. If he is at the middle door, he is equally likely to stay where he is, move to the door to the left, or move to the door to the right. If he is at the door on either end, he is equally likely to stay where he is or move to the middle door.
An Addison-Wesley product. Copyright © 2003 Pearson Education, Inc.
Markov Chains
a. Write a transition matrix. Find F and FR. b. Find the probability that a person who commuted by automobile ends up avoiding the downtown area. c. Find the expected number of years until a person who commutes by automobile this year no longer enters the downtown area. 81. Education Careers Data has been collected on the likelihood that a teacher, or a student with a declared interest in teaching, will continue on that career path the following year.* We have simplified the classification of the original data to four groups: high school and college students, new teachers, continuing teachers, and those who have quit the profession. The transition probabilities are given in the following matrix. Student New Continuing Quit
Student
New
Continuing
Quit
0.70 0 0 0
0.11 0 0 0
0 0.86 0.88 0
0.19 0.14 0.12 1
a. Find the expected number of years that a student with an interest in teaching will spend as a continuing teacher. b. Find the expected number of years that a new teacher will spend as a continuing teacher. c. Find the expected number of additional years that a continuing teacher will spend as a continuing teacher. d. Notice that the answer to part b is larger than the answer to part a, and the answer to part c is even larger. Explain why this is to be expected.
23
82. Rat Maze A rat is placed at random in one of the compartments of the maze pictured. The probability that a rat in compartment 1 will move to compartment 2 is 0.3; to compartment 3 is 0.2; and to compartment 4 is 0.1. A rat in compartment 2 will move to compartments 1, 4, or 5 with probabilities of 0.2, 0.6, and 0.1, respectively. A rat in compartment 3 cannot leave that compartment. A rat in compartment 4 will move to 1, 2, 3, or 5 with probabilities of 0.1, 0.1, 0.4, and 0.3, respectively. A rat in compartment 5 cannot leave that compartment.
1
2
3
4
5
a. Set up a transition matrix using this information. Find matrices F and FR. Find the probability that a rat ends up in compartment 5 if it was originally in the given compartment. b. 1
c. 2
d. 3
e. 4
f. Find the expected number of times that a rat in compartment 1 will be in compartment 1 before ending up in compartment 3 or 5. g. Find the expected number of times that a rat in compartment 4 will be in compartment 4 before ending up in compartment 3 or 5.
e. What other states might be added to this model to make it more realistic? Discuss how this would affect the transition matrix.
*Taylor, Raymond G., “Forecasting Teacher Shortages,” National Forum of Educational Administration and Supervision Journal, Vol. 7, No. 2, 1990.
An Addison-Wesley product. Copyright © 2003 Pearson Education, Inc.
A N S W E R S
T O
S E L E C T E D
E X E R C I S E S
Markov Chains 1. No
3. Yes 5. No
7. Yes
1/4 1
A
11. Yes; B
�
C
�
B
C
0.2 0.02 0
0.2 0.08 0.6
13. C �
� �
0.8 15. E � 0.3 0
0.1 0.6 1
0.1 0.67 0.1 ; E 2 � 0.42 0 0.3
0.23 0.26 matrix; 0.23 0.19 0.17
0.21 0.18 0.18 0.19 0.20
0.24 0.26 0.24 0.27 0.26
0.2205 0.2206 0.2182 0.2183 0.2176
0.1916 0.1922 0.1920 0.1909 0.1906
0.17 0.16 0.19 0.18 0.19
0.2523 0.2512 0.2525 0.2526 0.2533
2 1/2
�
A
0.6 0.9 0.4
9. Not a transition diagram
1/2
3/4
�
� �
0.5 0.72
0.24 0.49 0.6
0.5 0.61 ; C2 � 0.28 0.5616
� �
0.09 0.608 0.09 ; E 3 � 0.483 0.1 0.42
0.15 0.226 0.14 0.222 0.16 ; 0.219 0.17 0.213 0.18 0.213
0.192 0.196 0.189 0.192 0.189
0.21932 0.1582 0.21956 0.1582 0.1592 ; 0.21905 0.21880 0.1595 0.21857 0.1598
0.1774 0.1778 0.1781 0.1787 0.1787
0.249 0.252 0.256 0.252 0.252 0.19167 0.19152 0.19152 0.19144 0.19148
� �
0.39 0.5858 ; C3 � 0.4384 0.596448
0.301 0.426 0.49
0.177 0.174 0.177 0.181 0.183
�
0.091 0.091 ; 0.301 0.09
�
0.4142 ; 0.4142 0.403552
17. The first power is the given
0.156 0.156 0.159 ; 0.162 0.163
0.25227 0.25226 0.25227 0.25251 0.25253
0.17795 0.17794 0.17818 0.17817 0.17824
0.15879 0.15872 0.15898 ; 0.17794 19. Regular 0.15908 0.15918
21. Regular 23. �2 5 3 5� 25. �14 83 19 83 50 83� 27. ��1 � q� �2 � p � q� �1 � p� �2 � q � p�� 31. State 2 is absorbing; matrix is that of an absorbing Markov chain. 33. No absorbing states; matrix is not that of an absorbing Markov chain. FR �
35. F � �2�; FR � �0.4
� �
4 17 11 34
�
15 34 37 68
0.6� 37. F �
11 34 9 68
�
1 1 3
�
�
0 1 3 ; FR � 4 3 4 9
�
2 3 5 9
39. F �
51. a.
61. �7 36
5 9
Liberal
69. a.
Conservative Independent
�
26.144 42.484
b. 42.484
c. 26.144
1 4� 63. States 1 and 6
�
�
25 17 5 34
5 17 ; 35 34
41. Sum the elements in column j of the fundamental matrix 47. a. About 0.1859
b. About 2.34 in group 1, 2.62 in group 2, 3.47 in group 3, and 4.56 in group 4 c. 0 6.536 3.268
�
C
I
0.15 0.70 0.20
0.05 0.10 0.60
�
L
0.80 0.20 0.20
�
53. 0.2
8 3 4 3 65. F � 4 3 2 3
b. �0.40
0.45
4 3 8 3 8 3 4 3
59. �0.1945
c. 10 7; 10 7
� � �
55. 0.4 57. 0.256 1 6 4 3 1 3 1 6
49. a. 1
2 3 4 3 ; FR � 4 3 8 3
3 4 1 2 1 2 1 4
0.5555
1 4 1 2 1 2 3 4
0.25�
67. 1 2
0.15� c. 44% liberal, 40.5% conservative, and 15.5% independent
25 An Addison-Wesley product. Copyright © 2003 Pearson Education, Inc.
26
Markov Chains
d. 46.4% liberal, 38.05% conservative, and 15.55% independent e. 47.84% liberal, 36.705% conservative, and 15.455% independent f. 48.704% liberal, 35.9605% conservative, and 15.3355% independent 71. a. 0.271 b. 0.187 c. 0.607 for nonindex, 0.097 for injury, 0.174 for theft, 0.032 for damage, and 0.090 for combination. 73. 1 2 Fair
75.
Cloudy Rainy
�
�
Fair
Cloudy
Rainy
0.60 0.40 0.35
0.25 0.35 0.40
0.15 0.25 ; Long-range prediction is 48.7% fair, 31.1% cloudy, and 20.1% rainy. 0.25
�
0.15 0 79. a. P � 0 0
0.6 0.15 0 0
c. 580 289 � 2.007 years
0.25 0.25 1 0
�
0 0.6 20 17 ;F� 0 0 1
81. a. 2.63
�
b. 7.17
�
�
240 289 145 289 ; FR � 20 17 5 17
�
144 289 12 17
c. 8.33
An Addison-Wesley product. Copyright © 2003 Pearson Education, Inc.
77. 38%
b. 144 289