Markov Model of Wind Power Time Series Using Bayesian Inference of Transition Matrix 1
Peiyuan Chen, 2Kasper Klitgaard Berthelsen, 1Birgitte Bak-Jensen, 1Zhe Chen Department of Energy Technology, Aalborg University, 2Department of Mathematical Sciences, Aalborg University
[email protected],
[email protected],
[email protected],
[email protected],
1
Abstract-This paper proposes to use Bayesian inference of transition matrix when developing a discrete Markov model of a wind speed/power time series and 95% credible interval for the model verification. The Dirichlet distribution is used as a conjugate prior for the transition matrix. Three discrete Markov models are compared, i.e. the basic Markov model, the Bayesian Markov model and the birth-and-death Markov model. The proposed Bayesian Markov model shows the best accuracy in modeling the autocorrelation of the wind power time series.
I.
INTRODUCTION
Wind farms with ever-increasing capacity are injecting wind power to the electrical grid worldwide, especially in countries such as Germany, Denmark, Spain, USA and China [1]. The energy strategy of the Danish Government by 2025 indicates the possibility of building offshore wind farm with an overall capacity of 4600 MW, which approximately corresponds to 50% of Danish electricity consumption [2]. In contrast to traditional power generation, wind power is highly fluctuating and not fully controllable. In power system modeling, for instance, for reliability analysis, a traditional power generation is usually modeled by the outage rate of each generator unit. However, this is not sufficient for modeling a wind farm, as wind power is a stochastic generation during normal operation [3]. In order to capture its stochastic behavior, both the autocorrelation and probability distribution of wind power generation should be taken into account. In the literature, there are two main types of wind speed/wind power models developed, i.e. autoregressive moving average (ARMA) models [4], [5] and Markov models [6]-[9]. In [4], an autoregressive (AR) model is applied to a transformed wind speed time series; while in [5], an ARMA model is directly applied. The discrete Markov model is mainly based on a transition matrix [6], [7]. The birth-anddeath Markov model developed in [8], [9] is a simplified Markov model, as it considers only transition rates among two adjacent states. An ARMA model usually requires fewer parameters than does a Markov model. However, it is discussed in [7] that although it provides a good modeling in autocorrelation, an ARMA model cannot guarantee a good fit in probability distribution. A discrete state-space Markov chain requires discretizing the original time series into n states. The number
978-1-4244-4649-0/09/$25.00 ©2009 IEEE
of parameter of a kth-order Markov model is nk(n-1), which increases exponentially as the order increases. Both types of models incorporate the aleatory uncertainty due to the use of random number generation. However, the uncertainty of model parameters, referred to as the epistemic uncertainty, is not considered. This paper uses a discrete Markov chain for the modeling of a wind power time series and takes into account the uncertainty of the transition matrix by using Bayesian inference. First of all, the theories of discrete Markov chain and Bayesian inference are presented. Secondly, the application of discrete Markov chain and Bayesian inference in modeling of wind power time series is discussed. Verification of the Markov model by using credible intervals is proposed. Finally, discrete Markov chain models are developed on the basis of hourly wind power data measured from the Nysted offshore wind farm in Denmark. The simulated time series from three different Markov models, i.e. the basic Markov model, the Bayesian Markov model and the birth-and-death Markov model, are compared with the measurement. II.
METHODOLOGY
A. Discrete Markov Chain A random walk is a simple example of a discrete Markov chain [10]. A discrete Markov chain describes random movement among a finite number of states. This paper only considers Markov chain on a finite number of states, i.e. s1,…, sn. The probability one moves to another state depends only on its current state, not on the previous states visited. Mathematically, it is expressed as
(
P Yt +1 = s j | Y0 = s i0 ,..., Yt −1 = s it −1 , Yt = s i
(
)
= P Yt +1 = s j | Yt = s i = pij
)
(1)
where the random process (Y0, Y1,…), with a n-state space S={s1,…, sn}, is said to be a Markov chain with transition matrix P. The transition matrix P consists of transition probabilities pij, which describe the probabilities of moving to state sj when in state si. A Markov chain is (time) homogeneous if pij does not change with time t, otherwise inhomogeneous. An n-state transition matrix P is expressed as
627
⎡ p11 ⎢ p P = ⎢ 21 ⎢ ... ⎢ ⎢⎣ pn1
p12 p22 ... pn 2
... ... ... ...
p1n ⎤ ⎥ p2n ⎥ . ... ⎥ ⎥ pnn ⎥⎦
(2)
The first row in P provides the probabilities of moving to all states (state s1 to sn) from state s1; the second row provides the transition probabilities from state s2, and so on. The sum of the transition probabilities at each row is 1, i.e. n
∑ pij = 1
j =1
for all i = 1, ..., n.
(3)
A Markov chain is said to be irreducible, if it is possible to go from any state to any other state in one or more steps; it is said to be periodic, if the return to a particular state only happens at regular intervals, otherwise aperiodic. A Markov chain has an invariant distribution if it is irreducible and aperiodic. A probabilistic vector λ = (λ1, …, λn) with nonnegative entries is said to be an invariant distribution of P, if it satisfies: (4)
λP =λ.
where Σλi = 1.The discrete Markov chain based on the model defined above is a 1st order Markov chain, namely, the probability one moves to another state depends only on its current state. The parameter number of a 1st order transition matrix is n2. The transition probability of a kth order Markov chain depends on the current state and its previous (k-1) states. For example, the transition matrix of a 2nd order Markov chain can be written as
P
n 2 ×n
= ⎡⎣ P1n×n , ..., Pnn×n ⎤⎦
T
(5)
n×n
where P is a 1st order transition matrix with n Markov state. The parameter number is n3 for a 2nd order transition matrix, and nk+1 for a kth order one. B. Birth-and-death Markov Chain Another Markov model based on the birth-and-death Markov chain is developed in [8], [9]. The model simplifies state transitions by defining transition rates between immediately adjacent states only. The residence time of state i, i.e. the time of staying at state i before going to a different state, is assumed exponentially distributed with the rate parameter equal to the transition rate divided by the length of the simulated time series. The generation of new time series states is directly determined by the random-generated residence time. The detailed procedure of the modeling is provided in [9]. C. Bayesian Inference The fundamental approach of Bayesian inference is to construct a joint probability model for both the observed quantities (the data) and the unobserved quantities (parameter values of distributions) [11], [12]. Assume y is the observed
978-1-4244-4649-0/09/$25.00 ©2009 IEEE
quantity which is a realization of a random variable Y, and that the distribution of Y depends on an unobserved quantity θ which is a realization of another random variable Θ. Assume that Θ is distributed according to π(θ), which is referred to as the prior density. Conditional on Θ = θ, assume that Y is distributed according to a known data density π(y|θ), which is referred to as the likelihood function or the data distribution. According to the definition of conditional probability, the joint distribution of Y and Θ has the density
π ( y ,θ ) = π (θ ) π ( y |θ ) .
(6)
The prior density π(θ) reflects the prior knowledge or prior uncertainty regarding Θ before y is observed. The data distribution π(y|θ) is chosen such that it is consistent with the problem of interest. According to the definition of conditional probability, the conditional distribution of Θ given Y = y has the density
π (θ | y ) =
π ( y ,θ ) π (θ )π ( y |θ ) = ∝ π (θ ) π ( y|θ ) , π ( y) π ( y)
(7)
where π(θ|y) is the posterior density of Θ; π(y) is the normalizing constant; π(θ)π(y|θ) is the unnormalized posterior density. The posterior density π(θ|y) is the updated knowledge of the prior density π(θ). In other words, the prior uncertainty about the parameter Θ is reduced due to the observed data y. The Bayesian inference is based on the posterior density, which can be used, e.g., to predict the future observations. III.
APPLICATION IN WIND POWER TIME SERIES MODELING
This section first of all discusses a basic procedure of constructing a discrete Markov chain of a wind power time series. Then, the application of Bayesian inference on the transition matrix is presented. Another discrete Markov model, based on the birth-and-death Markov chain, is also briefly discussed. Finally, criteria of the model verification are provided. A. Maximum Likelihood Estimation of transition matrix The maximum likelihood estimation of the transition matrix P is obtained by maximizing the likelihood function or the data distribution π(y|P) given the observation y. In this case, the observation is y = ( yt : t =1,…,N ) .
(8)
where N is the total length (number of hours) of the measured wind power time series. The data distribution is a multinomial distribution and expressed as n
n
N
π ( y|P ) ∝ Π Π pij ij . i =1 j =1
where ‘ ∝ ’ indicates ‘proportional to’ and
628
(9)
N −1
N ij = ∑
t =1
n
⎡ yt = si , yt +1 = s j ⎤ , ⎣ ⎦
⎧1,
[Z ] = ⎨
if Z is true
⎩0, if Z is false
p ij =
n
∑ N ij
=
Nij Ni
( )
E pij =
,
for i , j = 1, … , n.
(10)
ij
Ni . N
(11)
According to (4), the vector of state probability λ = [π(s1),…,π(sn)] is an invariant distribution of the transition matrix P. In other words, if the length of the simulated time series is long enough, the state probability of the simulated time series converges to that of the measured one. This property of the Markov chain ensures an accurate modeling of the probability distribution of a time series. B. Bayesian inference of transition matrix There are two uncertainties within the model, i.e. aleatory uncertainty from the random number generation, and epistemic uncertainty from the uncertainty of estimated transition probabilities. The latter one is not considered in the basic Markov model with maximum likelihood estimation. Unlike when using the maximum likelihood estimation, the Bayesian approach ensures aperiodicity and irreducibility. The following describes how to incorporate the uncertainty of transition matrix into the above Markov model. In a Bayesian approach, it is necessary to specify a prior distribution for the transition matrix P. Let Pi denote the ith row of P. Assume a prior that P1 , …, Pn are independently distributed, and that Pi ∼ dir (α i1 ,…,α in )
parameters α i1 , α i 2 ...α in > 0 . Recall that the density of Dirichlet distribution is 1
B (α )
n
α −1
∏ pij ij j =1
(16)
the simplex S ={( x1 ,…, xn ) : ∑ xi =1, xi ≥ 0} . In this case,
E(pij) = 1/n. If we have prior knowledge from previous ‘experiment’, we can incorporate this in the choice of the αij parameters of the prior. According to (7), with the data distribution as in (9) and prior distribution as in (14), the posterior distribution is now
⎛ ⎝
n
n
N
⎞⎛ ⎠⎝
n
n
α −1
⎞ ⎠
π ( y|P ) π ( P ) ∝ ⎜ Π Π pij ij ⎟⎜ Π Π pij ij ⎟ i =1 j =1 i =1 j =1 n
n
=ΠΠ
i =1 j =1
N +α −1 pij ij ij .
(17)
That is, a posterior P1 , …, Pn given observations y are independently distributed with Pi | y ∼ dir ( Ni1 +α i1 ,…,N in +α in ) ,
(18)
Note that by construction the transition matrix is always irreducible and aperiodic. C. Model Verification 1. Autocorrelation and cumulative distribution function In statistics, autocorrelation function (ACF) of time series (X0, X1,…) with time-lag d is defined as ACF ( d ) =
(
Cov X t = si , X t + d = s j
σ X2
).
(19)
2
where Cov() is the covariance function; σX is the variance of the time series. According to the definition of autocovariance function and based on the assumption of wide sense stationary (WSS) of the time series, the ACF of time-lag d can be further expressed by
(13) ACF ( d ) =
where pij is subjected to (3) and B(α) is a constant defined by a multinomial Beta function. Therefore, the prior distribution of P has the density
978-1-4244-4649-0/09/$25.00 ©2009 IEEE
for i , j = 1, … , n.
This corresponds to each Pi being uniformly distributed on
(12)
where dir (α i1 ,…,α in ) denotes a Dirichlet distribution with
(15)
∑ α ij
where E( ) is to take the expectation. In the following simulation, assume
α = 1,
In addition, the state probability, i.e. the probability mass function of the state value si is
α ij n
j =1
j =1
dir (α i1 ,…,α in ) =
(14)
.
Equation (12) gives that
.
π ( si ) =
α −1
i =1 j =1
It is noted that if the last observation yN = si, then Nii = Nii+1. This is to ensure that sum of all Nij equals to N. Therefore, the maximum likelihood estimation of transition probabilities are
N ij
n
π ( P ) ∝ Π Π pij ij
m T P d s − μX2
σX2
.
where μX is the mean value of the time series, and
629
(20)
s = ⎣⎡ s1 ,…, s n ⎦⎤
T T
T m = ⎡⎣π ( s1 ) s1 ,…,π ( s n ) s n ⎤⎦ = λ • s.
Therefore, the ACF of a transition matrix based Markov chain can be theoretically calculated given the state vector s, state probability vector λ, and transition matrix P. The ACF of a Markov chain can also be calculated using (19) with the simulated time series. However, this leads to different ACF values if different simulations are performed. This will be further illustrated in section IV. The cumulative distribution function (CDF) of the (discretized) time series can be obtained by j
( )
CDF s j = ∑ λi , i =1
for j = 1, … , n.
(21)
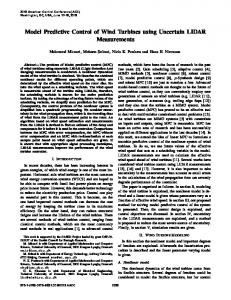
As explained in the end of section III A, the state probability vector λ is the invariant distribution of the transition matrix P. Namely. the state probability λi of the Markov chain converges to that of the original time series. 2. Credible interval The credible interval [11] is a terminology used in Bayesian statistics. A 95% credible interval is the interval between the 2.5% and 97.5% percentiles of the posterior distribution of a random variable. An example of a 95% credible interval of random variable X is shown in Fig. 1.
PDF
PDF of Random Variable X 1 0.8 0.6 0.4 0.2 0 0
1
1.5
2
2.5
3
3.5
4
3.5
4
CDF
CDF of Random Variable X 1 0.8 97.5% 0.6 0.4 0.2 2.5% 0 0 0.5
j
fij =
∑p
(22)
im
m =1
Initialize the first state value of the wind power Markov chain X: Xt = 1 = si. Generate a uniform-distributed random number r. The next state value at t = t + 1 is determined by: ⎪⎧ s1 , Xt = ⎨ ⎪⎩ sq +1 ,
r ≤ fi1 fiq < r ≤ fi ( q +1)
(23)
B. The 95% credible interval
2 2.5 3 X Fig. 1. 95% credible interval of a random variable X.
1
1.5
The reason to use a credible interval instead of a classical confidence interval is that a 95% credible interval can be directly interpreted as containing the true parameter with high probability, i.e. 0.95. Whereas after a 95% confidence interval is calculated, it either includes or excludes the true parameter and thus loses the meaning of 0.95 probability. IV.
A. Simulation techniques First of all, the measured wind power time series needs to be discretized. Determine the number of states n and divide [0, Xmax] into (n-1) equally spaced intervals. Xmax is the maximum value of the measured wind power. For a Markov chain model, the state vector and transition probability should then be determined. The 1st state value s1 is 0. The values of the remaining (n-1) states are chosen as the mean values of the data falling into corresponding intervals. Form the transition matrix P and calculate the corresponding cumulative transition matrix F, in which the element is defined by:
where i = q+1; q is an integer value within [1, n-1]. Repeat the step until t is equal to the defined length of the Markov chain. In this way, a wind power Markov chain is generated from a 1st order Markov model. For higher order Markov models, the procedure is the same but with a higher order transition matrix similar to (5).
95% 0.5
hourly data to be used in the following simulation. The simulation results are discussed in terms of the 95% credible interval, Bayesian inference of transition matrix and comparison of different Markov models. If not stated, the number of Markov state is 10 and the length of the simulated Markov chain is 8760 hours.
APPLICATION IN WIND POWER TIME SERIES MODELING
The simulation is based on measured wind power data from the Nysted offshore wind farm connected to the 132 kV station at the Lolland-Falster distribution system in Denmark. The total capacity of the wind farm is 165.6 MW. It consists of 72 wind turbines, each with capacity of 2.3 MW. The data are measured every 15 min and range from January 1, 2005 to May 31, 2007. The measured 15-min data are averaged into
978-1-4244-4649-0/09/$25.00 ©2009 IEEE
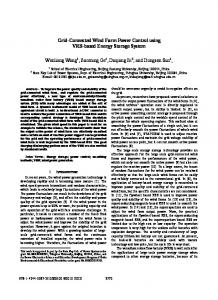
1. Simulation results Two different transition matrices are used for winter (October to April) and summer period (May to September) to account for the seasonality. Therefore, the Markov model is time-inhomogeneous. The ACF of wind power time series in winter from the measurement in 2005 and 2006 as well as two simulated ones are shown in Fig. 2. The 95% credible interval of the ACF is shown in Fig. 3. 2. Discussion The two simulated wind power time series shown in Fig. 2 are different from each other due to the aleatory uncertainty caused by the random number generation. However, it is difficult to judge the validity of the Markov model with individual time series. By using the credible interval, as shown in Fig. 3, it can be said that the ACF of the simulated time series is within the two solid curves for 95% of the time. In other words, if the 95% credible interval of ACF does not contain the ACF of the measured time series, it can be said that the model does not provide satisfactory results. The same
630
inference of transition matrix, the Bayesian Markov model provides superior results to the basic Markov model. As shown in Fig. 5, the 95% credible intervals of both the ACF and CDF contain corresponding measurement results in 2005 and 2006. In this way, the 1st order Bayesian Markov model is validated against the measurement.
C. Bayesian inference of transition matrix 1. Simulation results The transition matrix is calculated based on the limited data set, the uncertainty of which is taken into account by using Bayesian inference to derive a probability distribution for each of the transition probabilities. For instance, the probabilistic density function (PDF) of the transition probability p11 by using Bayesian inference and the maximum likelihood estimation is shown in Fig. 4. The ACF and CDF of wind power time series in winter by Bayesian Markov model from the measurement in 2005 and 2006 as well as the 95% credible interval are shown in Fig. 5. Autocorrelation
ACF of wind power (Basic Markov model) 1 0.8 0.6 0.4 0.2 0
2005 winter 2006 winter simu. 1 simu. 2
3
6
9
12 15 Lag (Hour)
18
21
24
Fig. 2. ACF of wind power time series in winter: measurement in 2005 (dotted), measurement in 2006 (dashed-dotted) and two simulations (solid)
Autocorrelation
ACF of wind power (Basic Markov Model) 1 0.8 0.6 0.4 0.2 0
2005 winter 2006 winter 95% credible interval
3
6
9
12 15 Lag (Hour)
18
21
24
Fig. 3. ACF of wind power time series in winter by basic Markov model: measurement in 2005 (dotted), measurement in 2006 (dashed-dotted) and 95% credible interval from simulation (solid)
PDF
PDF of transition probability p11 (winter) 40 30 20 10 0 0.78
Bayesian inference Maximum likelihood
0.8
0.82 0.84 Transition probability
0.86
0.88
Fig. 4. PDF of transition probability p11 in winter by Bayesian inference (solid) and maximum likelihood estimation (dashed)
2. Discussion The main difference between the Bayesian Markov model and the basic Markov model is that the former one includes the uncertainty of transition matrix while the latter one uses a fixed transition matrix obtained from the maximum likelihood estimation. With two types of uncertainties included, the aleatory uncertainty from the random number generation and the epistemic uncertainty from the Bayesian
978-1-4244-4649-0/09/$25.00 ©2009 IEEE
Autocorrelation
ACF of wind power (Bayesian Markov Model) 1 0.8 0.6 0.4 0.2 0
Probability
judgment applies to the CDF. The model is validated if the 95% credible intervals of both the ACF and CDF contain corresponding measurement results. Although the data in both 2005 and 2006 are used to build the Markov model, the 95% credible interval of ACF does not contain that of the measured time series in 2005 for the lag time between 3 and 18 hours, as shown in Fig. 3. This is caused by the limited data set and the model is thus sensitive to the data set used. In order to account for the sensitivity of the model to the data set, the uncertainty of transition matrix should be included.
1 0.8 0.6 0.4 0.2 0 0
2005 winter 2006 winter 95% credible interval
3
6
9
12 15 18 21 Lag (Hour) CDF of wind power (Bayesian Markov Model)
24
2005 winter 2006 winter 95% credible interval
0.2
0.4 0.6 Power (p.u.)
0.8
1
Fig. 5. ACF (top) and CDF (bottom) of wind power time series in winter by Bayesian Markov model: measurement in 2005 (dotted), measurement in 2006 (dashed-dotted) and 95% credible interval from simulation (solid)
D. Comparison of different Markov models The considered types of Markov models are the basic Markov model, the Bayesian Markov model and the birthand-death Markov model. A comparison among the three types of Markov models, in terms of the core model, transition condition, parameter number and uncertainty considered, are summarized in Table I. The birth-and-death model can be considered a simplified model to the other two models in the sense that it considers only the transition to immediately adjacent states. In this regard, the results are expected to be worse than the basic model as shown in Fig. 6, although the simplification leads to a reduction in the parameter number of the model. It is worth pointing out that no matter which types of (1st order) Markov model used, the transition matrix or transition rate models the autocorrelation of lag 1. Autocorrelations of lags higher than 1 are not directly modeled. However, as shown in Fig. 6, the simplification used in the birth-and-death Markov model leads to a constantly lower value of ACF at lag 1 as well. The Bayesian Markov model is essentially the same as the basic model but including the uncertainty of the transition matrix. In other words, the Bayesian Markov model improves the accuracy of the model without increasing the total parameter number. In the literature, in order to achieve a higher accuracy of the model, higher state and order number are usually the resort [7], [9]. The problem with higher state and order number is, as indicated in Table I, the dramatic increase of the parameter number to represent the model. Given a certain amount of data in total, the amount of data used to estimate each parameter decreases as n and k increases. As a result, the uncertainty of the parameter estimation increases. This is also one of the reasons why models with higher state and/or order number are not guaranteed to have a better performance as shown in [7].
631
TABLE I COMPARISON OF MARKOV MODELS FOR WIND POWER TIME SERIES Type Core model Transition Parameter Uncertainty condition number considered Basic Transition To all states nk+1 Aleatory matrix Bayesian Transition To all states nk+1 Aleatory & matrix Epistemic Aleatory Birth & Transition rate To adjacent (n-1)2k death states only n: state number; k: order of model
Autocorrelation
The authors would like to thank the Danish distribution company SEAS-NVE for providing the measurement data from the Nysted offshore wind farm. REFERENCES [1]
[2]
ACF of wind power (Birth-and-Ddeath Markov Model) 1 0.8 0.6 0.4 0.2 0 0
ACKNOWLEDGMENT
[3] 2005 winter 2006 winter 95% credible interval
3
6
9
12 15 18 21 24 Lag (Hour) Fig. 6. ACF of wind power time series in winter by birth-and-death Markov model: measurement in 2005 (dotted), measurement in 2006 (dashed-dotted) and 95% credible interval from simulation (solid)
[4] [5] [6]
E. Application of wind power model The developed wind power model can generate time series of arbitrary length. The model can be incorporated into the reliability analysis of wind farms, e.g. to obtain a probability distribution of the expected generated wind energy (EGWE) index of a wind farm. The model can also be used in shortrange and long-range planning of power systems integrated with wind power. Although the model is illustrated by using wind power time series, it can be directly applied to wind speed time series modeling. The developed Markov model can be served as a potential candidate of the tool for wind power forecasting with a few hours ahead (e.g. 1 to 3 hours) when the numerical weather prediction is not available. The uncertainty of the forecasting can also be evaluated by the 95% credible interval. V.
CONCLUSIONS AND FUTURE WORK
[7] [8] [9] [10] [11] [12] [13] [14] [15]
This paper improves the existing discrete Markov model of a wind power time series by taking into account the parameter uncertainty, i.e. the uncertainty of transition matrix. The uncertainty of transition matrix is modeled through Bayesian inference. This paper also proposes to use credible interval to evaluate the accuracy of the model so that a fair judgment can be made from the statistical point of view regarding the validity of the model. A comparison among the basic Markov model, the Bayesian Markov model and the birth-and-death Markov model is made. From the point view of the 95% credible interval of ACF, the most accurate model is the Bayesian Markov model and the least accurate model is the birth-and-death Markov model. The seasonality of the wind power is accounted for by applying the model for summer and winter separately. The application of the wind power model in reliability analysis and power system planning are briefly discussed. Due to the variations of wind speed in different years, the year-to-year variation can also be included in the model if for instance ten-year data are available.
978-1-4244-4649-0/09/$25.00 ©2009 IEEE
632
[1] EWEA (2008, Mar.). Pure Power-Wind Energy Scenarios up to 2030, [Online].Available:http://www.ewea.org/fileadmin/ewea_documents/do cuments/publications/reports/purepower.pdf Danish Energy Authority (2007, Apr.), Future offshore wind power sites–2025, [Online]. Available: http://www.ens.dk/graphics/Publikationer/Havvindmoeller/Fremtidens_ %20havvindm_UKsummery_aug07.pdf N. B. Negra, O. Holmstrøm, B. Bak-Jensen, and P. Sørensen, “Wind farm Generation Assessment for Reliability Analysis of Power Systems”, Wind Engineering, vol. 31, pp. 383-400, Dec. 2007. B. G. Brown, R. W. Katz and A. H. Murphy, "Time Series Models to Simulation and Forecast Wind Speed and Wind Power," Journal of Climate and Applied Meteorology, vol. 23, pp. 1184-1195, May 1984. R. Billinton, H. Chen and R. Ghajar, “Time-series models for reliability evaluation of power systems including wind energy,” Microelectron. Reliab., vol. 36, pp. 1253-1261, 1996. A. Shamshad, M. A. Bawadi, W. M. A. Wan Hussin, T. A. Majid and S. A. M. Sanusi, "First and Second Order Markov Chain Models for Synthetic Generation of Wind Speed Time Series," Energy, vol. 30, pp. 693-708, 2005. G. Papaefthymiou and B. Klöckl, "MCMC for Wind Power Simulation, " IEEE Trans. Energy Conversion, vol. 23, pp. 234-240, Mar. 2008. F. Castro Sayas and R. N. Allan, "Generation Availability Assessment of Wind Farms," IEE Proc. Generation, Transmission, Distribution, vol. 143, pp. 507-518, Sep. 1996 N. B. Negra, O. Holmstrøm, B. Bak-Jensen and P. Sørensen, "Model of a Synthetic Wind Speed Time Series Generator," Wind Energy, vol. 11, pp. 193-209, 2008 J. R. Norris, "Markov Chains," Cambridge: Cambridge University Press, 1997, pp. 33-39. P. M. Lee, "Bayesian statistics: an introduction," New York: Edward Arnold, 1989 J. Albert, "Bayesian computation with R," New York: Springer, 2007, pp. 104-106. K. V. Mardia, J. T. Kent and J. M. Bibby, "Multivariate Analysis," London: Academic Press, 1994, pp. 44. C. W. Therrien and M. Tummala, "Probability for electrical and computer engineers," Boca Raton: CRC Press, 2004, pp. 200-203, 5253. P. Chen, Z. Chen, B. Bak-Jensen, R. Waagepetersen and S. Sörensen, "Verification of Probabilistic Model of a Distribution System with Integration of Dispersed Generation," in Proc. 2008 16th Power Systems Computation Conf.