Acta Polytechnica Hungarica
Vol. 15, No. 1, 2018
Markowitz Portfolio Selection Using Various Estimators of Expected Returns and Filtering Techniques for Correlation Matrices
Andr´as London, Imre Gera, Bal´azs B´anhelyi ´ ad t´er 2, Hungary University of Szeged, Institute of Informatics, 6720 Szeged, Arp´
[email protected]
Abstract: In this study we examine the performance of the Markowitz portfolio optimization model using stock time series data of various stock exchanges and investment period intervals. Several methods are used to estimate expected returns, then different “noise” filtering techniques are applied on the correlation matrix containing the pairwise correlations of the time series. The performance of the methods is compared using the estimated and realized returns and risks, respectively. The results show that the estimated risk is closer to the realized risk using filtering methods in general. Bootstrap analysis shows that ratio between the realized return and the estimated risk (Sharpe ratio) is also improved by filtering. In terms of the expected return estimation results show that the James-Stein estimator improves the reliability of the portfolio, which means that the realized risk is closer to the estimated risk in this case. Keywords: Portfolio optimization; Markowitz model; Random matrix theory; Hierarchical clustering
1
Introduction
The portfolio optimization is one of the fundamental problems in asset management that aims to reduce the risk of an investment by diversifying it into assets expected to fluctuate independently [7]. In his seminal work [17], Markowitz formulated the problem as a quadratic programming task: given the expected return of the portfolio, the risk, a quadratic function that is measured via the covariances of the asset time series, has to be minimized. Recently, the investigation of the correlation coefficient matrix, that is a normalization of the covariance matrix appears in the objective function of the model, has received a big amount of attention, see, without being exhaustive, e.g. [4, 6, 12, 13, 22, 24]. The question of quantifying the degree of statistical uncertainty, called “noise” especially in the statistical physics community, present in the correlation matrix and filter the part of information which is robust against this uncertainty has been addressed and tested [4, 10, 12, 13, 14]. Filtered – 217 –
Andr´as London et al.
Markowitz Portfolio Selection Using...
correlation matrices have been successfully used in portfolio optimization for risk reduction [13, 22, 24]. However, most of these studies assumed that the investor has perfect knowledge on the future returns at the time of optimization. In this study we investigate and test the portfolio optimization problem by using several filtering procedures applied to the correlation matrix given by the pairwise asset correlations. The performance of the procedures is simply measured by comparing the predicted and realized risk and return they provide, respectively. For more details on performance analysis of portfolio selection, see [26] for example. In this work the we assume that future returns are not known at the time of the investment. Moreover, besides the maximum likelihood estimator (i.e. the average of daily returns) we try other methods to calculate the expected returns. The structure of this paper is the following. In Section 2 we describe the Markowitz portfolio optimization problem together with some possible estimations of the expected returns (Sec. 2.1) and several filtering procedures that can be performed on the correlation matrices (Sec. 2.2). In Section 3 we present our results with the detailed description of data sets, the experimental setup and evaluation metrics we used (Sec. 3.1, Sec. 3.2 and Sec. 3.3). Finally we draw some conclusions and indicate potential future work.
2
Markowitz portfolio optimization model
Given n risky assets, a portfolio composition is determined by the weights pi (i = 1, . . . , n), such that ∑ni pi = 1, indicating the fraction of wealth invested in asset i. The expected return and the variance of the portfolio p are calculated as n
r p = prT = ∑ pi ri
(1)
i=1
and n
n
σ p2 = pΣpT = ∑ ∑ σi j pi p j ,
(2)
i=1 j=1
respectively, where ri is the expected return of asset i, σi j is the covariance between asset i and j and Σ is the covariance matrix. Vectors are considered as row vectors in this paper. We should point out that only the proportions p1 , . . . , pn are needed to determine the performance of the portfolio. It means that the values r p and σ p2 are the same for any investment volume if the weights are the same. In the classical Markowitz model [17] the risk is measured by the variance providing a quadratic optimization problem consists in finding vector p, such that ∑ni=1 pi = 1 which minimizes σ p2 for a given “minimal expected return” value of r p . Here, we assume that short selling is allowed and therefore pi can be negative. The solution of this problem, found by Markowitz, is p∗ = λ Σ−1 1T + γΣ−1 rT ,
(3) – 218 –
Acta Polytechnica Hungarica
Vol. 15, No. 1, 2018
where 1 = (1, . . . , 1) while the other parameters are λ = (C − r p B)/D and γ = (r p A − B)/D using the notations A = 1Σ−1 1T , B = 1Σ−1 rT ,C = rΣ−1 rT and D = AC − B2 . However, Eq. 3 is rarely used to solve the Markowitz portfolio optimization problem due to numerical stability problems with matrix inversion [5]. Instead, we used the Lagrange multiplier method for optimization (see Sec. 3.3). Next we will describe three possible methods to calculate the expected stock returns in a given period.
2.1
Estimators for the expected returns
Considering the price time series of n assets and denoting the closure price of asset i in time t (t = 0, 1, . . . , T ) by Pi (t), the daily logarithmic return of i is defined as ri (t + 1) = log
Pi (t + 1) = log Pi (t + 1) − log Pi (t). Pi (t)
(4)
In case of stationary independent normal returns (as random variables) the maximum likelihood estimator is the sample mean of the past observations of ri as it was defined by rˆiML =
1 T
T
∑ ri (t).
(5)
t=1
Hence, for the portfolio we define rˆ ML = (ˆr1ML , . . . , rˆnML ),
(6)
The maximum likelihood return estimation can be highly inefficient since assets with high past returns are likely to contain more positive estimation errors than others. The positive part trimming could further reduce the risk and the James-Stein estimator [11] provides a constructive shrinkage estimator in order to do it. The James-Stein estimation for the expected return for asset i is rˆ JS = (1 − w)ˆrML + wr0 1,
(7)
where r0 =
1Σ−1 rˆ TML λ (n + 2)(T − 1) ,w = and λ = . λ +T (ˆrML − r0 1)Σ−1 (ˆrML − r0 1)T 1Σ−1 1T
In this calculation, each sample mean is shrunk toward the average return of the minimum variance portfolio r0 . – 219 –
Andr´as London et al.
Markowitz Portfolio Selection Using...
For small sample size, usually below 50, it was observed that there is no evidence that common asset expected returns are different. If all expected returns are assumed to be equal, the minimum-variance portfolio is efficient and rˆ MV = r0 1.
(8)
Finally, the covariance between asset i and j is estimated by the formula σˆ i,2 j =
1 T ∑ (ri (t) − rˆi )(r j (t) − rˆ j ), T − 1 t=1
(9)
where rˆi is denotes the estimated value of the with respect the estimator used.
2.2
Filtering the statistical uncertainty
Random matrix theory √ The correlation coefficient between asset i and j is defined as ρi j = σi j / σi σ j , where σi = σii is the standard deviation (often called average volatility) of asset i. A simple random matrix is a matrix whose elements are random numbers from a given distribution [19]. In context of asset portfolios random matrix theory (RMT) can be useful to investigate the effect of statistical uncertainty in the estimation of the correlation matrix [24]. Given the time series of length T of the returns of n assets and assuming that the returns are independent Gaussian random variables with zero mean and unit variance (σ 2 =1), in the limit n → ∞, T → ∞ such that Q = T /n is fixed, the distribution Prm (λ ) of the eigenvalues of a random correlation matrix (Crm ) is given by p (λ − λmin )(λmax − λ ) Q Prm (λ ) = , (10) 2πσ 2 λ where λmin and λmax are the minimum and maximum eigenvalues, respectively [23], given in the form s 1 1 2 λmax,min = σ (1 + ± 2 ). (11) Q Q Previous studies have pointed out that the largest eigenvalue of correlation matrices from returns of financial assets is completely inconsistent with Eq. 10 and refers the common behavior of the stocks in the portfolio, i.e. the behavior of the market itself. [12, 20]. Since Eq. 10 is strictly valid only for n → ∞, T → ∞, we constructed random matrices for the certain n and T values of the data sets we used and we compared the largest eigenvalues and the spectrum C and Crm . Since Trace(C) = n the variance of the part not explained by the largest eigenvalue can be quantified as σ 2 = 1 − λlargest /n. We can recalculate λmin and λmax in Eq. 11 and construct a filtered diagonal matrix get by setting to zero all eigenvalues of C smaller than λmax and transform it to the basis of C with setting the diagonal elements to one. A possible RMT approach for portfolio optimization, following [22], is to use Σrm (that can be easily calculated form Crm ) instead of Σ in the Markowitz model. – 220 –
Acta Polytechnica Hungarica
Vol. 15, No. 1, 2018
Cluster Dendrogram 2.0
Minimal Spanning Tree of 40 BUX Assets
ORMESTER
RABA TRINV EXTERNET FORRAST TWDINVEST
KARPOT
NUTEX GSPARK KULCSSOFT OPIMUS SHOP 4IG ESTMEDIA FUTURAQUA ENEFI NORDTELEKOM UPDATE1 MASTERPLAST CSEPEL PVALTO KONZUM OTT1 VISONKA ZWACK BIF PANNERGY CIGPANNONIA EMASZ EFTBUXOTP MTELEKOM ELMU ANY
EFTBUXOTP
KARPOT
ENEFI
NUTEX
ELMU
CSEPEL
KULCSSOFT OPIMUS SHOP
FORRASOE KEG
ALTERA PLOTINUS
Height
1.5
1.6
1.7
1.8
1.9
CIGPANNONIA FUTURAQUA ESTMEDIA EMASZ
ORMESTER
MOL
FORRASOE GSPARK
KEG
TRINV
RABA
PVALTO
ANY
OTP
BIF OTT1 RICHTER MTELEKOM MASTERPLAST KONZUM VISONKA ZWACK PANNERGY NORDTELEKOM
4IG
UPDATE1
MOL OTP RICHTER
1.4
ALTERA
TWDINVEST
PLOTINUS
FORRAST
EXTERNET
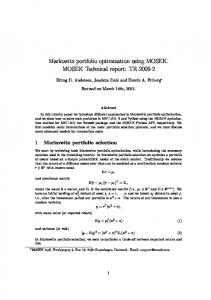
Figure 1 Indexed hierarchical tree - obtained by the single linkage clustering algorithm - and the associated MST of the correlation matrix of 40 assets of the Budapest Stock Exchange
Hierarchical clustering Correlation based clustering can be considered as a filtering procedure transforming the correlation matrix such that a smaller number of distinct elements retains. The correlation matrix C has n(n − 1)/2 ∼ n2 element therefore it contains a large amount of information even for a small number of assets considered in the portfolio. Mantegna and others showed that the single linkage hierarchical clustering algorithm (closely related to minimal spanning trees (MST) of graphs) provide meaningful economic information using only n − 1 elements of the correlation matrix [15]. The effectiveness of clustering methods have been shown in many studies, e.g. in [2, 9, 18, 25]. To construct the MST, the correlation matrix C is pconverted into a distance matrix D, for instance following [15, 16], using di j = 2(1 − ρi j ) ultrametric distance. Ultrametric distances are such distances that satisfy the inequality di j ≤ max{dik , dk j }, which is a stronger assumption that the standard triangular inequality. The distance matrix D can be seen as representing a fully connected graph of the assets with edge weights di j representing a similarity of the time series of assets i and j. For this graph (i.e. a distance matrix) one can use the Kruskal algorithm in order to obtain the MST of n − 1 elements and then construct the filtered correlation matrix Csl using just the n − 1 correlation coefficients converted back from the n − 1 distances in the MST. Figure 1 shows an illustrative example for hierarchical clustering and the associated spanning tree obtained using the Budapest Stock Exchange data set. For portfolio optimization, we used Σsl instead of Σ in the Markowitz model. In [24] the authors proposed a new portfolio optimization method using another widespread hierarchical clustering procedure, namely the average linkage algorithm. While the single linkage clustering procedure basically follows the greedy Kruskal MST method, the average linkage algorithm, in an iteration step, defines the distance between an element and a cluster as the average distance between the element and each element in the cluster. For detailed description, see e.g. [1]. For portfo– 221 –
Andr´as London et al.
Markowitz Portfolio Selection Using...
lio optimization, we can use Σal constructed using average linkage clustering in the Markowitz model.
3 3.1
Results Data description
To compare the performance of the methods we analyzed two different data sets. The first data set consists of n = 40 stocks traded in the Budapest Stock Exchange (BSE) in the period 1995-2016, using 5145 records of daily returns per stock. The second data set contains the stock time series of n = 48 companies of the Information Technology sector (Hardware + Software) that are available on Yahoo Finance (YF) (https://finance.yahoo.com/) in almost the same period as the BSE data with 5395 records of daily returns of each stock. We consider t = t0 as the time when the optimization is performed. Since the covariance matrix has ∼ n2 distinct elements while the number of records used in the estimation is nT , the length of the time series need to be T >> n to get small errors on the covariance. On the other hand, for large T the non-stationarity of the time series more likely appears. The problem is known as the “curse of dimensionality” [27]. To handle this, we computed the covariance matrix and expected returns using the [−T, 0] interval with T = 50 ≈ n, T = 100 > n and T = 500 >> n days preceding t = 0. The calculation of the expected returns, the covariance matrix and filtered covariance matrices was performed using the time series data of this interval. Then, the realized returns and realized risk (for each method) were calculated using the data on the [0, T ] interval. To quantify and compare the different methods considered, we used the measures described in the next section. We should also mention here, that solving the Markowitz portfolio selection method as a quadratic programming problem is particularly simple when Σ (in. Eq. 2) is positive semi-definite and the constraints are equalities (as in Eq. 1). It is not difficult to see that the positive semi-definiteness is true for the original covariance matrix and also for the filtered matrix obtained by the RMT method. In [1] it was proved that the filtered correlation matrix obtained by the single linkage clustering procedure is always positive definite if all the elements of the obtained filtered correlation matrix are positive. This is usually the case for correlations of stock time series and it has been observed for all the matrices we have used. Moreover, it was proved in the same paper that the filtered correlation matrix obtained by using the average linkage clustering method is also positive definite under the same conditions as in the case of the single linkage procedure.
3.2
Performance evaluation
To measure the performance of a portfolio selected by the different models, we use the following measures to investigate how the estimated and the realized quantities – 222 –
Acta Polytechnica Hungarica
Vol. 15, No. 1, 2018
relate to each other. For portfolio p, the Sharpe ratio measures the excess return (realized) per unit of risk (estimated): Sp =
rp − r f σˆ p2
(12)
The portfolio risk, due to the estimation of the correlation matrix is calculated as Rp =
|σˆ p2 − σ p2 | σˆ p2
(13)
where σˆ p2 is the predicted risk, while σ p2 is the realized risk of the portfolio.
3.3
Simulation setup and results
We implemented our simulation environment in R [21]. We are given a data set of stock time series and the input parameters the timeInverval T , vector of startingTimes t0 = (t01 , . . . ,t0k ) and rp = (r1p , . . . , r`p ) vector of expectedReturns (equal steps between the average return and the maximal return over all asset by default). The simulation procedure is done via the following steps: 1. For each starting time t0j the asset.solve.Complete.SelectTimes() subroutine checks whether the portfolio optimization can be done for that starting time on interval [−T,t0j ] • if yes, it calculates the optimal portfolio using asset.solve.Complete.R() • if not1 , it goes to the next starting time t0j+1 2. The subroutine stores portfolio weights and the data required for performance evaluation The subroutine asset.solve.Complete.R() works as follows: 1. Determines the expected returns using maximum likelihood, James-Stein and minimum variance estimations 2. Determines the covariance matrix of stock time series 3. Calculates the filtered covariance matrices using the RMT, the single linkage and average linkage procedures 4. Portfolio optimization is performed for each return estimation • using the Lagrange multipliers method of the ’Rsolnp’ package [8] calculates the optimal weights for each covariance matrix • calculates the portfolio risk according to the optimal weights 1
Usually, data with lots of missing (NA) values results in a singular covariance matrix and optimization cannot be performed – 223 –
Andr´as London et al.
Markowitz Portfolio Selection Using...
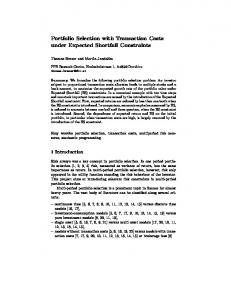
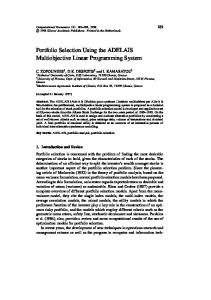
• determines the realized risk and Sharpe-ratio In order to improve the running times the ‘doParallel’ R package [3] was used (here we do not describe the details of parallelization).2 To check the robustness of the methods, a standard bootstrap experiment was performed. We considered 50 starting times randomly and solved the optimization problem using the time series on the intervals [ − T,t0j ] (T = 50, 100, 500, j = 1, . . . , 50). For each portfolio, the predicted risk was calculated according to Eq. 2 for fixed expected returns from the average ∑ni=1 ri /n to the maximum expected return max{ri : i = 1, . . . , n} with equal spans. The Lagrange multiplier method, that is available in ’Rsolnp’ R package, was used for the optimization. In each case, the portfolios with realized returns in the top and bottom 10% were dropped. The realized risk using the determined stock weights at t0j , the realized covariance matrix and realized returns were calculated on [t0j , T ]. Fig. 2 and Fig. 3 show the ratio of the ratio of the realized risk σ p2 (continuous line) and the predicted risk σˆ p2 (dashed line) as the function of the expected return r p obtained by the different procedures for the BSE data set and Yahoo data set, respectively. For each T , the time of the investment t0j ( j = 1, . . . , 50) and the set of stocks were the same. For the BSE data set, the classic method and the RMT method provide similar realized returns that are always higher using hierarchical clustering (single and average linkage). On the other hand, the risk ratio R p (i.e. the reliability of the portfolio) is also significantly decreased (see Fig. 2, and Tab. 1 “Risk Ratio” column), but the deviations of the realized returns were increased. The Sharpe ratio of the hierarchical clustering methods were smaller than using the other methods, since the estimated risk was often higher than the risk obtained when using the classic and the RMT methods. It can be observed that each method provided better expected returns and smaller risk ratio (i.e. better reliability) for the smaller values of T (T = 50, 100, see Tab. 1). The results show that the James-Stein return estimation, although it increases the deviation of the realized returns, provides smaller risk ratios and improvements on the Sharpe ratio. The Sharpe-ratio of the minimum variance portfolio (see Tab. 1 last four column) was the highest due to very small expected risk the method estimated, while its reliability is significantly smaller than using the other return estimators. For the Yahoo data set similar is true for the realized returns as in the case of BSE data set. Here, the smallest risk ratio was obtained when T = 100 days (Fig. 3 middle left and right). It can also be observed, that usage the James-Stein return estimator provided better results (realized returns, Sharpe ratio), while the usage minimum variance estimator decreased the risk ratio in some cases. 2
We used ‘doParallel’ and its dependencies to create a parallel back end for the loop construction provided by the ‘forEach’ package. – 224 –
Acta Polytechnica Hungarica
Vol. 15, No. 1, 2018
Conclusions In this paper, we investigated the Markowitz portfolio selection problem using filtered correlation matrices obtained using different filtering procedures, namely a random matrix theory approach and hierarchical clustering approaches. Furthermore, we used several estimators to determine the expected return of a portfolio. A large set of experiments have shown that using filtered covariance matrices the classic Markowitz solution can be outperformed in terms of realized returns and reliability, meaning that the realized risk and the estimated risk are closer to each other in case of filtering. Our simulations show that the different filtering procedures provide different portfolio optimization results: the most useful method can be different depending on the risk level of the portfolio, the investment period size and reliabilty of the risk and return estimation. We think that other filtering procedures combined with different return estimators could also provide interesting or better results for different parameters (e.g. expected returns, portfolio size, investment period length) of the optimization problem. References [1]
A NDERBERG , M. R. Cluster analysis for applications. monographs and textbooks on probability and mathematical statistics, 1973.
[2]
BASALTO , N., B ELLOTTI , R., D E C ARLO , F., FACCHI , P., AND PASCAZIO , S. Clustering stock market companies via chaotic map synchronization. Physica A: Statistical Mechanics and its Applications 345, 1 (2005), 196–206.
[3]
C ALAWAY, R ICH , W. S., AND T ENENBAUM , D. Foreach Parallel Adaptor for the ‘parallel’ Package, 2015. R package version 2.14.
[4]
C ONLON , T., RUSKIN , H. J., AND C RANE , M. Random matrix theory and fund of funds portfolio optimisation. Physica A: Statistical Mechanics and its applications 382, 2 (2007), 565–576.
[5]
D U C ROZ , J. J., AND H IGHAM , N. J. Stability of methods for matrix inversion. IMA Journal of Numerical Analysis 12, 1 (1992), 1–19.
[6]
E L A LAOUI , M. Random matrix theory and portfolio optimization in moroccan stock exchange. Physica A: Statistical Mechanics and its Applications 433 (2015), 92–99.
[7]
E LTON , E. J., G RUBER , M. J., B ROWN , S. J., AND G OETZMANN , W. N. Modern portfolio theory and investment analysis. John Wiley & Sons, 2009.
[8]
G HALANOS , A., AND T HEUSSL , S. Rsolnp: General Non-linear Optimization Using Augmented Lagrange Multiplier Method, 2015. R package version 1.16.
[9]
G IADA , L., AND M ARSILI , M. Data clustering and noise undressing of correlation matrices. Physical Review E 63, 6 (2001), 061101.
¨ [10] G UHR , T., AND K ALBER , B. A new method to estimate the noise in financial correlation matrices. Journal of Physics A: Mathematical and General 36, 12 (2003), 3009. [11] JAMES , W., AND S TEIN , C. Estimation with quadratic loss. In Proceedings of the fourth Berkeley symposium on mathematical statistics and probability (1961), vol. 1, pp. 361–379. [12] L ALOUX , L., C IZEAU , P., B OUCHAUD , J.-P., AND P OTTERS , M. Noise dressing of financial correlation matrices. Physical review letters 83, 7 (1999), 1467. – 225 –
Andr´as London et al.
Markowitz Portfolio Selection Using...
[13] L ALOUX , L., C IZEAU , P., P OTTERS , M., AND B OUCHAUD , J.-P. Random matrix theory and financial correlations. International Journal of Theoretical and Applied Finance 3, 03 (2000), 391–397. [14] M ALEVERGNE , Y., AND S ORNETTE , D. Collective origin of the coexistence of apparent random matrix theory noise and of factors in large sample correlation matrices. Physica A: Statistical Mechanics and its Applications 331, 3 (2004), 660–668. [15] M ANTEGNA , R. N. Hierarchical structure in financial markets. The European Physical Journal B-Condensed Matter and Complex Systems 11, 1 (1999), 193–197. [16] M ANTEGNA , R. N., AND S TANLEY, H. E. Introduction to econophysics: correlations and complexity in finance. Cambridge university press, 1999. [17] M ARKOWITZ , H. Portfolio selection: Efficient diversification of investments. cowles foundation monograph no. 16, 1959. [18] M ASLOV, S. Measures of globalization based on cross-correlations of world financial indices. Physica A: Statistical Mechanics and its Applications 301, 1 (2001), 397–406. [19] M EHTA , M. L. Random matrices, vol. 142. Academic press, 2004. [20] P LEROU , V., G OPIKRISHNAN , P., ROSENOW, B., A MARAL , L. A. N., AND S TAN LEY, H. E. Universal and nonuniversal properties of cross correlations in financial time series. Physical Review Letters 83, 7 (1999), 1471. [21] R C ORE T EAM. R: A Language and Environment for Statistical Computing. R Foundation for Statistical Computing, Vienna, Austria, 2013. [22] ROSENOW, B., P LEROU , V., G OPIKRISHNAN , P., AND S TANLEY, H. E. Portfolio optimization and the random magnet problem. EPL (Europhysics Letters) 59, 4 (2002), 500. [23] S ENGUPTA , A. M., AND M ITRA , P. P. Distributions of singular values for some random matrices. Physical Review E 60, 3 (1999), 3389. [24] T OLA , V., L ILLO , F., G ALLEGATI , M., AND M ANTEGNA , R. N. Cluster analysis for portfolio optimization. Journal of Economic Dynamics and Control 32, 1 (2008), 235–258. [25] T UMMINELLO , M., A STE , T., D I M ATTEO , T., AND M ANTEGNA , R. N. A tool for filtering information in complex systems. Proceedings of the National Academy of Sciences of the United States of America 102, 30 (2005), 10421–10426. ´ , A., AND O RMOS , M. Performance analysis of equally weighted portfolios: [26] U RB AN Usa and hungary. Acta Polytechnica Hungarica 9, 2 (2012), 155–168. [27] Z IMEK , A., S CHUBERT, E., AND K RIEGEL , H.-P. A survey on unsupervised outlier detection in high-dimensional numerical data. Statistical Analysis and Data Mining 5, 5 (2012), 363–387.
– 226 –
Acta Polytechnica Hungarica
Vol. 15, No. 1, 2018
Return−Risk Ratios (JAMES−STEIN)
Risk 0.000
0.002
0.004
1e−04 2e−04 3e−04 4e−04 5e−04 6e−04
Risk
0e+00 1e−04 2e−04 3e−04 4e−04 5e−04 6e−04
Return−Risk Ratios (CLASSIC) Classic RMT Cluster (Single) Cluster (Average)
0.006
Classic RMT Cluster (Single) Cluster (Average)
−0.00105
−0.00100
−0.00095
Return
4e−04 3e−04
Classic RMT Cluster (Single) Cluster (Average)
Risk
1e−04
2e−04
Risk
1e−04 0.000
0.001
0.002
0.003
0.004
−0.00029
−0.00028
−0.00027
Return
−0.00026
−0.00025
Return
Return−Risk Ratios (JAMES−STEIN) 6e−04
Return−Risk Ratios (CLASSIC)
5e−04
Classic RMT Cluster (Single) Cluster (Average)
Classic RMT Cluster (Single) Cluster (Average)
Risk
1e−04
1e−04
2e−04
2e−04
3e−04
3e−04
4e−04
4e−04
5e−04
−0.00085
Return−Risk Ratios (JAMES−STEIN)
Classic RMT Cluster (Single) Cluster (Average)
2e−04
3e−04
4e−04
Return−Risk Ratios (CLASSIC)
Risk
−0.00090
Return
0.0000
0.0005
0.0010
0.0015
−0.00025
Return
−0.00020
−0.00015
−0.00010
Return
Figure 2 The ratio of the realized risk σ p2 and the predicted risk σˆ p2 as the function of expected portfolio return (continuous line) and realized return (dashed line) for the different procedures as T = 50, 100, 500 (top-down) using the maximum likelihood estimator (left panels) and the James-Stein estimator (right panel). The data set contains 40 BSE stocks in the period 1995-2016.
– 227 –
Andr´as London et al.
Markowitz Portfolio Selection Using...
Return−Risk Ratios (JAMES−STEIN)
8e−04
Classic RMT Cluster (Single) Cluster (Average)
2e−04
2e−04
4e−04
6e−04
Risk
6e−04 4e−04
Risk
8e−04
Return−Risk Ratios (CLASSIC) Classic RMT Cluster (Single) Cluster (Average)
0.001
0.002
0.003
0.004
0.00097
0.00098
0.00099
Return
0.00102
0.00103
Return−Risk Ratios (JAMES−STEIN)
7e−04
Classic RMT Cluster (Single) Cluster (Average)
Classic RMT Cluster (Single) Cluster (Average)
Risk 4e−04
4e−04
5e−04
5e−04
Risk
6e−04
6e−04
7e−04
0.00101
Return
Return−Risk Ratios (CLASSIC)
0.0000
0.0005
0.0010
0.0015
0.0020
0.0025
0.0030
0.000140
0.000145
Return
0.000155
0.000160
8e−04
Return−Risk Ratios (JAMES−STEIN)
4e−04
4e−04
5e−04
5e−04
Risk
6e−04
Classic RMT Cluster (Single) Cluster (Average)
6e−04
7e−04
Classic RMT Cluster (Single) Cluster (Average)
7e−04
8e−04
0.000150 Return
Return−Risk Ratios (CLASSIC)
Risk
0.00100
0e+00
5e−04
1e−03
−8.15e−05
Return
−8.10e−05
−8.05e−05
Return
Figure 3 The ratio of the realized risk σ p2 and the predicted risk σˆ p2 as the function of expected portfolio return (continuous line) and realized return (dashed line) for the different procedures as T = 50, 100, 500 (top-down) using the maximum likelihood estimator (left panels) and the James-Stein estimator (right panel). The data set contains 48 IT sector companies with available historical time series data in the Yahoo finance page in the period 1995-2016
– 228 –
– 229 –
Classic RMT Single linkage Average linkage Classic RMT Single linkage Average linkage Classic RMT Single linkage Average linkage
Filtering Classic RMT Single linkage Average linkage Classic RMT Single linkage Average linkage Classic RMT Single linkage Average linkage
-0.00058 -0.00057 -0.00048 -0.00045 0.00030 0.00030 0.00012 0.00022 -0.00030 -0.00030 -0.00032 -0.00030
Realized Return 0.00123 0.00124 0.00121 0.00073 0.00013 0.00015 0.00119 0.00017 -0.00047 -0.00052 -0.00011 -0.00053 0.00335 0.00334 0.00335 0.00328 0.00223 0.00223 0.00213 0.00218 0.00070 0.00070 0.00069 0.00068
Average return estimator Realized Return (sd) 0.00465 0.00465 0.00304 0.00189 0.00153 0.00154 0.00294 0.00114 0.00121 0.00127 0.00121 0.00127 -3.76019 -3.62685 -0.55588 0.37105 1.58302 1.59425 0.62113 1.08339 -1.11800 -1.11424 -1.05861 -1.08412
Sharpe ratio 8.18922 7.92646 4.77064 0.51529 7.66392 7.87615 12.90469 8.95616 -11.41798 -14.16135 -2.19925 -13.73743 1.69646 1.69695 1.57894 1.44763 0.07236 0.07074 0.26152 0.16704 0.38939 0.38804 0.37295 0.36562
Risk Ratio 2.30546 2.31340 0.73042 0.52383 2.01878 2.02137 1.44612 1.20554 3.06961 3.29680 2.94493 2.96084 -0.00055 -0.00055 -0.00049 -0.00045 0.00033 0.00034 0.00014 0.00024 -0.00029 -0.00029 -0.00031 -0.00029
Realized Return 0.00117 0.00118 0.00192 0.00185 0.00101 0.00099 0.00164 0.00133 -0.00015 -0.00016 0.00013 -0.00009 0.00331 0.00331 0.00335 0.00328 0.00226 0.00226 0.00219 0.00222 0.00070 0.00070 0.00070 0.00069
James-Stein estimator Realized Return (sd) 0.00466 0.00466 0.00502 0.00475 0.00328 0.00325 0.00352 0.00339 0.00115 0.00115 0.00132 0.00108 -3.46238 -3.45527 -0.55640 0.53901 1.64966 1.66608 0.55639 1.11380 -1.05358 -1.05042 -1.03993 -1.03587
Sharpe ratio 6.85066 7.14867 11.82008 10.52615 12.57921 12.34801 13.56478 13.76679 -1.61974 -1.86695 1.26614 -0.25504 1.64100 1.64236 1.58649 1.45527 0.06094 0.05837 0.25039 0.15679 0.36550 0.36223 0.34634 0.35142
Risk Ratio 2.14136 2.16424 0.76601 0.68557 1.99415 2.00979 1.45191 1.22242 2.70563 2.72909 2.88015 2.79321 -0.00075 -0.00075 -0.00074 -0.00068 0.00024 0.00024 0.00009 0.00017 -0.00024 -0.00024 -0.00027 -0.00024
Realized Return 0.00084 0.00084 0.00107 0.00100 0.00070 0.00069 0.00080 0.00072 0.00026 0.00026 0.00034 0.00028 0.00318 0.00317 0.00331 0.00318 0.00199 0.00199 0.00187 0.00194 0.00062 0.00061 0.00061 0.00059
Min variance estimator Realized Return (sd) 0.00461 0.00461 0.00452 0.00447 0.00280 0.00280 0.00282 0.00280 0.00080 0.00080 0.00077 0.00075
-9.20659 -9.19923 -4.67897 -3.80231 0.10471 0.09566 -0.46180 -0.33963 -0.69456 -0.69082 -0.67158 -0.69585
Sharpe ratio 298776 214031 155939 266844 520868 508169 406972 422477 23937 24031 20362 22544
1.44308 1.44350 1.45398 1.28830 0.01050 0.01217 0.15097 0.08565 0.38257 0.38035 0.36608 0.35530
Risk Ratio 3.32719 3.32716 1.17548 1.34028 3.52232 3.52259 2.65070 3.28602 4.75457 4.75513 3.17707 4.24691
Table 1 Bootstrap experiments using 50 random samples for each value of T when the return is the mean of the average expected return of the portfolio and the maximal expected return over all stocks
T = 500
T = 100
Yahoo data set T = 50
T = 500
T = 100
T = 50
BSE data set
Acta Polytechnica Hungarica Vol. 15, No. 1, 2018